
A new lysosome-targetable fluorescent probe for detection of endogenous hydrogen polysulfides in living cells and inflamed mouse model†
Li
Liang‡
,
Weiqing
Li‡
,
Jinrong
Zheng
,
Ruixi
Li
,
Haiyan
Chen
 * and
Zhenwei
Yuan
*
* and
Zhenwei
Yuan
*
Department of Biomedical Engineering, School of Engineering, China Pharmaceutical University, 24 Tongjia Lane, Gulou District, Nanjing 210009, China. E-mail: yuanzhenwei@cpu.edu.cn; chenhaiyan@cpu.edu.cn; Fax: +86-25-83271046; Tel: +86-25-83271080
First published on 23rd October 2019
Abstract
Hydrogen polysulfides (H2Sn, n > 1) belong to sulfane sulfur in the reactive sulfur species (RSS) family and play significant roles in maintaining biological homeostasis in organisms. The detection of H2Sn in living systems is essential, but further understanding of its “intact” function in living cells has been limited, owing to the lack of appropriate analytical tools. In this work, a new fluorescent probe PP-PS was designed for the detection of endogenous H2Sn. The probe has a large Stokes shift (178 nm), low detection limit (1 nM), and short response time (1 minute). Besides, PP-PS was successfully applied in the imaging of endogenous H2Sn in lysosomes of living cancer cells, xenograft mouse tumor tissues, and LPS-induced mouse inflammation tissues. These results revealed that the probe PP-PS could act as a new fluorescence imaging tool to study the function of intracellular hydropolysulfides.
1. Introduction
Reactive sulfur species (RSS) are a family of sulfur-containing molecules found in biological systems, including thiols, hydrogen sulfide, persulfides, polysulfides, and so on.1 Recently, many RSS have been demonstrated to exert interesting biological functions.2–10 The literature published in the past few years has increasingly shown that H2S is a mediator of many physiological and/or pathological processes, especially in the cardiovascular system.11–16 Hydrogen polysulfides (H2Sn, n > 1) can be considered as oxidized forms of H2S and belong to sulfane sulfur in the RSS family. H2S and H2Sn are redox partners so that H2Sn can be produced by H2S, and H2Sn can also degrade by itself into a precursor of H2S. Because of these properties, some biological mechanisms which were originally attributed to H2S may be mediated by H2Sn.17–20 For instance, an abnormally high concentration of H2Sn was found at the site of inflammation due to the overexpression of cystathionine g-lyase (CSE). There is growing evidence showing that H2Sn, as an activator,21–25 is associated with transcription factors, ion channels, and tumor suppressors for modulating biological functions. Therefore, H2Sn is closely related to a variety of pathophysiological conditions and diseases, including Parkinson's disease (PD), Huntington's disease (HD), ethylmalonic encephalopathy, and even cancer.26–28H2Sn should be more effective than H2S in S-sulfhydration from the standpoint of reactivity. For a better understanding of the roles of H2Sn and H2S, new detection methods should be developed based on the fundamental chemistry/reactivity of H2Sn. The traditional methods used for detecting H2Sn are mainly mass spectrometry and UV spectroscopy.29 However, these methods are limited because of their drawbacks like long detection time, low sensitivity, and complicated procedures.
Recently, a few fluorescent probes have been developed for detecting H2Sn, but some of them have unsatisfactory properties and can only detect high concentrations of H2Sn. It should be noted that probes with a proximal absorbance peak and fluorescence peak would result in self-quenching and auto-fluorescence, which will affect the detection sensitivity (Table S1†).
Given the above considerations, a simple synthetic fluorescent probe PP-PS was designed for determining exogenous and endogenous H2Sn in living cells/tissues. PP-OH is an excellent fluorophore with good water solubility and large Stokes shift, so it can avoid self-quenching significantly.30,31PP-PS has relatively low background fluorescence due to the intramolecular charge transfer (ICT) process. Our results have shown that the probe PP-PS has a large Stokes shift, good light stability, high fluorescence quantum yield, and a certain lysosome localization effect. PP-PS selectively restores strong fluorescence in response to H2Sn. The probe works well in a physiological environment and has high sensitivity and selectivity to endogenous and exogenous hydrogen polysulfides produced in cancer cells. It is worth mentioning that we have used the animal inflammation model to successfully prove that the fluorescent probe PP-PS can detect H2Sn produced by inflammation in vivo and can be imaged.
In a word, the fluorescent probe PP-PS could be successfully applied to the detection of H2Sn in the animal inflammation model and have a distinct fluorescence signal.
2. Results and discussion
2.1. Synthesis
The synthetic route to PP-PS (2-(1-phenylimidazo[1,5-a]pyridin-3-yl)phenyl-2-(benzoylthio)benzoate) is shown in Scheme 1.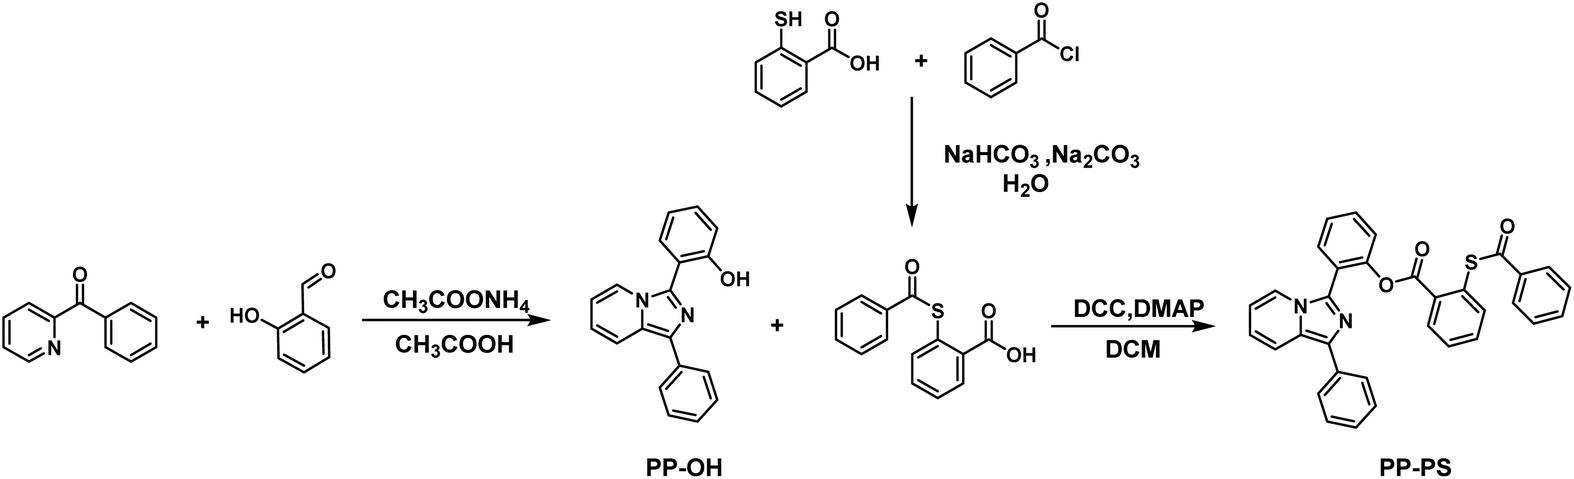 | ||
| Scheme 1 Synthetic route of the probe PP-PS. | ||
The compound PP-OH was prepared according to the reported method with some modifications.31 2-Benzoylpyridine (600 mg, 3.27 mmol, 1 eq.), salicylaldehyde (4.91 mmol, 1.5 eq.), ammonium acetate (1260 mg, 16.37 mmol, 5 eq.) and 20 mL glacial acetic acid were mixed and stirred at 100 °C under an inert atmosphere for 5 h. After cooling to room temperature, acetic acid was removed by evaporation under reduced pressure. The crude product was purified by column chromatography with petroleum ether and CH2Cl2 (2![[thin space (1/6-em)]](https://www.rsc.org/images/entities/char_2009.gif) :1, v/v) and a yellow-green solid powder was obtained (800 mg, yield 85.31%).
:1, v/v) and a yellow-green solid powder was obtained (800 mg, yield 85.31%).
1H NMR (300 MHz, CDCl3-d) δ 8.52 (d, J = 7.3 Hz, 1H), 7.89 (ddd, J = 7.6, 6.5, 1.3 Hz, 3H), 7.77 (dd, J = 7.8, 1.6 Hz, 1H), 7.49 (t, J = 7.8 Hz, 2H), 7.39–7.30 (m, 2H), 7.19 (dd, J = 8.3, 1.2 Hz, 1H), 7.01 (td, J = 7.6, 1.3 Hz, 1H), 6.86 (ddd, J = 9.3, 6.4, 0.9 Hz, 1H), 6.69 (ddd, J = 7.4, 6.3, 1.2 Hz, 1H). 13C NMR (300 MHz, CDCl3-d) δ 156.56, 133.86, 129.99, 128.86, 127.05, 126.75, 124.31, 122.54, 120.44, 119.49, 119.03, 117.91, 114.16, 114.08. HRMS (ESI): calcd for C19H14N2O [M + H]+m/z 287.1106, found 287.1179 (Fig. S1–S3†).
The compound 2-benzoylsulfanyl-benzoic acid was prepared according to the report by Tecilla et al.32 Thiosalicylic acid (500 mg, 3.24 mmol) was dissolved in a solution of NaHCO3 (817 mg, 9.73 mmol) in H2O (25 mL). The thiosalicylic acid solution was cooled to 0 °C. Benzoyl chloride (456 mg, 3.24 mmol) and Na2CO3 (687 mg, 6.49 mmol) were then added. The reaction mixture was stirred for 30 min at 0 °C and then stirred for an additional 45 minutes at room temperature. Subsequently, the reaction mixture was acidified with concentrated HCl forming a white precipitate. The precipitate was collected and washed with cold water to obtain a white product (715 mg, yield 84.76%). 1H NMR (300 MHz, CDCl3-d) δ 8.12 (d, J = 7.8 Hz, 1H), 8.03 (d, J = 7.7 Hz, 2H), 7.68 (d, J = 7.7 Hz, 1H), 7.61 (q, J = 6.7 Hz, 2H), 7.54 (t, J = 7.6 Hz, 1H), 7.48 (t, J = 7.6 Hz, 2H) (Fig. S4†).
PP-PS (2-(1-phenylimidazo[1,5-a]pyridin-3-yl)phenyl-2-(benzoylthio)benzoate). A mixture of PP-OH (100 mg, 349 μmol), 2-benzoylsulfanyl-benzoic acid (180 mg, 698 μmol), N,N′-dicyclohexylcarbodiimide (DCC, 144 mg, 698 μmol) and 4-dimethylaminopyridine (DMAP, 8.5 mg, 69.8 μmol) was dissolved in 10 mL anhydrous dichloromethane and stirred at room temperature overnight under the protection of nitrogen. The crude product was purified by column chromatography with gradient elution using petroleum ether and CH2Cl2 (1:1, v/v) to obtain a yellow solid powder (115 mg, 62.53%). Purity: 99.75% (HPLC). 1H NMR (300 MHz, CDCl3-d) δ 7.95–7.90 (m, 2H), 7.87 (ddd, J = 8.1, 7.0, 1.3 Hz, 3H), 7.83–7.74 (m, 3H), 7.59–7.38 (m, 10H), 7.28 (dd, J = 7.6, 1.3 Hz, 2H), 6.78–6.71 (m, 1H), 6.53–6.47 (m, 1H). 13C NMR (300 MHz, CDCl3-d) δ 149.25, 136.89, 136.53, 135.00, 133.65, 133.53, 132.24, 131.42, 131.37, 130.51, 129.28, 128.70, 128.63, 127.58, 127.46, 126.66, 126.42, 123.57, 123.18, 122.37, 119.91, 118.88, 113.07. HRMS (ESI): calcd for C33H22N2O3S [M + H]+m/z 527.1351, found 527.1428 (Fig. S5–S8†).
2.2. Optical properties
Hydrogen polysulfides were derived from Na2S2, which was prepared according to T. Takata's report.33 First, the fluorescence characteristics of PP-PS toward H2Sn were studied. As shown in Fig. 1a, the UV-visible absorption peak of the probe appeared only at 300 nm, which is a characteristic peak of PP-OH. After the addition of Na2S2, the absorption peak showed a weak blue shift, indicating the reactions between the probe and H2Sn.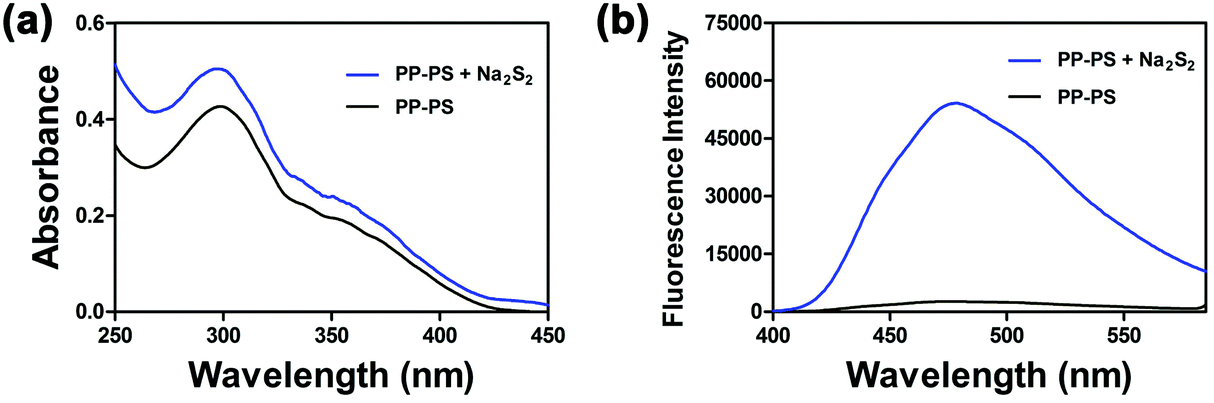 | ||
| Fig. 1 Absorption spectra (a) and fluorescence spectra (b: λex = 300 nm) of PP-PS (10 μM) before and after reacting with Na2S2 (50 μM) in PBS buffer (10 mM, pH 7.4, containing 1 mM CTAB) for 30 min. | ||
Besides, the 2-benzoylsulfanyl-benzoic acid group quenches fluorescence by intramolecular charge transfer, thus providing relatively low background fluorescence. Therefore, PP-PS exhibits a weak fluorescence signal (quantum yield Φ = 0.0132). The addition of Na2S2 to the PP-PS solution resulted in a significant increase in fluorescence at 478 nm (Fig. 1b, quantum yield Φ = 0.12549).31 Both the absorption and fluorescence spectra indicated the reaction between the probe and H2Sn. The results substantiated that PP-PS could detect H2Sn through the fluorescence properties at 478 nm (λex = 300 nm).
To investigate the sensitivity of PP-PS, we performed titration experiments with different concentrations (0–100 μM) of Na2S2.34,35 As shown in Fig. 2a and b, the fluorescence in the wavelength range of 400–580 nm gradually increases with the addition of Na2S2. The fluorescence intensity reached the maximum after adding 50 μM Na2S2 to the PP-PS solution, and the maximum increase was around 20.3 fold. Five equivalents of Na2S2 (50 μM) were added to PP-PS (10 μM) in PBS buffer to evaluate the dynamic response of PP-PS toward H2Sn. After mixing the probe with Na2S2, the fluorescence intensity at 478 nm was greatly increased within 1 minute, and the complete response reached an equilibrium state within 5 min (Fig. 2c and d). These results indicate that the probe PP-PS could detect H2Sn rapidly at λex/em = 300/478 nm.
 | ||
| Fig. 2 Fluorescence emission spectra (a) and fluorescence intensity (b, λem = 478 nm) of PP-PS (10 μM) after treating with different amounts of Na2S2 (0–100 μM) in PBS buffer (10 mM, pH 7.4, containing 1 mM CTAB); fluorescence emission spectra (c) and fluorescence intensity (d, λem = 478 nm) of PP-PS (10 μM) with time after addition of 50 μM Na2S2 in PBS buffer (10 mM, pH 7.4, containing 1 mM CTAB). | ||
Besides, the fluorescence intensity of the probe at 478 nm showed a good linear relationship with the Na2S2 concentration in the range of 0–20 μM (R2 = 0.99409, Fig. S9†). Furthermore, according to the formula LOD = (3σ/k), the corresponding detection limit of PP-PS for H2Sn is about 1 nM. These results indicated that PP-PS has high sensitivity to H2Sn and could quantitatively detect the concentration of H2Sn through the fluorescence intensity at λex/em = 300/478 nm.
To investigate the effect of various pH environments on the probe response process, we examined the fluorescence properties of PP-PS in response to H2Sn in the pH range from 3 to 10. As shown in Fig. S10,† the fluorescence of the reaction system is almost unaffected by pH in the range of 5–9, indicating that the probe is stable to Na2S2 in the physiological pH range, which facilitates further applications of the probe in living tissue imaging.
2.3. Selectivity studies
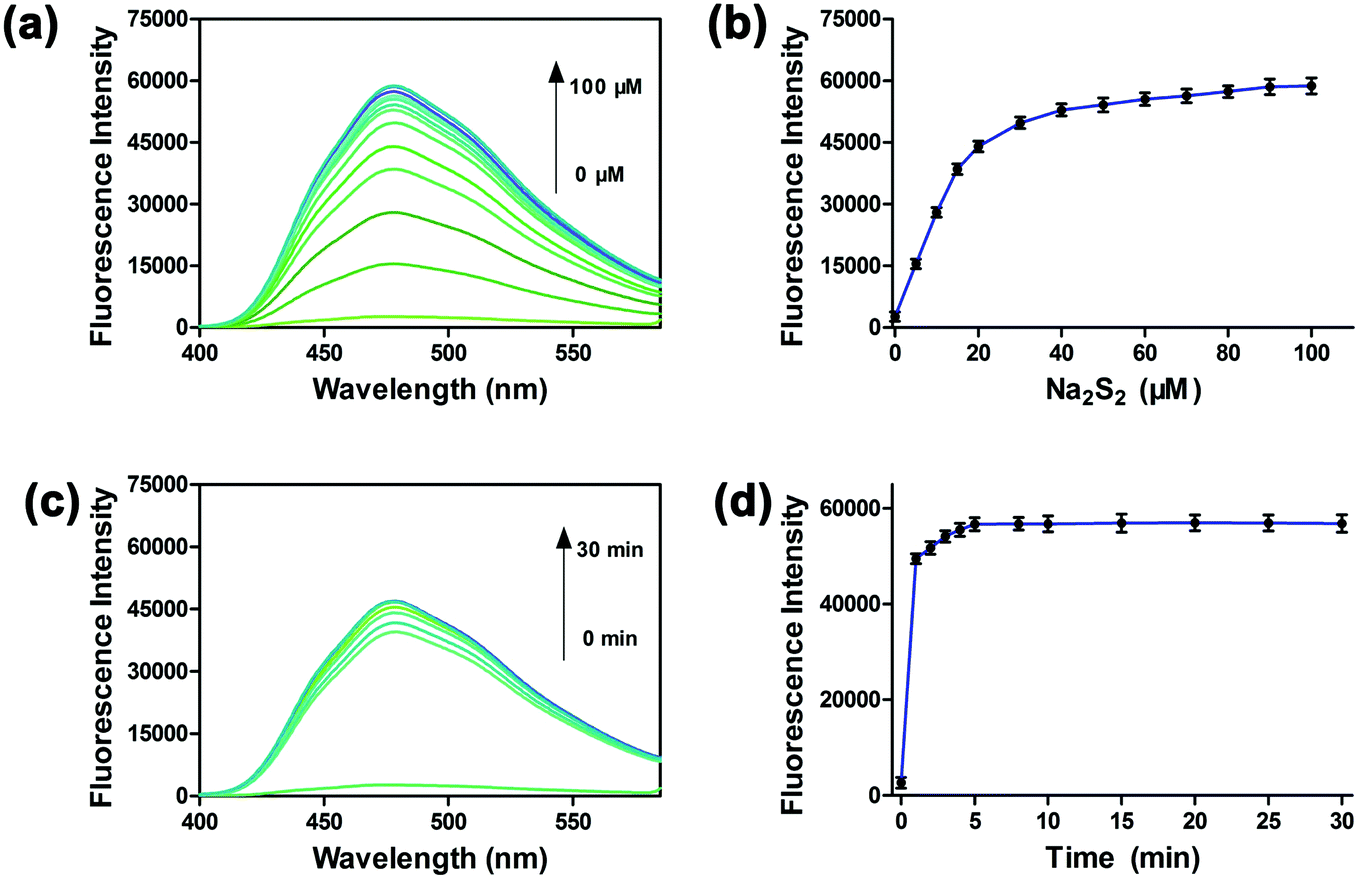
In order to investigate the selectivity of the probe PP-PS (10 μM) towards H2Sn, the reaction system in PBS buffer was treated with different interfering agents (1000 μM). The interfering species included metal ions, biothiols, and reactive oxygen species (blank, GSH, Cys, Hcy, Na2S, Na2S2O3, Na2SO3, Na2SO4, H2O2, NaClO, CaCO3, K2CO3, ZnSO4, MgSO4, CH3COONa, NaNO2, NaHSO3, NaCl, KH2PO4, KHSO5, and S8). As shown in Fig. 3, upon addition of only Na2S2 (50 μM), a remarkable fluorescence enhancement was observed and there were no significant changes in the fluorescence emission spectrum after adding the interference species into the reaction system (black column). In addition, the interfering species with the probe PP-PS (10 μM) upon the addition of Na2S2 was tested and minute interference was found (blue column). The experimental results show that the probe has high selectivity for the detection of H2Sn and may be capable of selectively detecting H2Sn in clinical samples. | ||
| Fig. 3 Fluorescence emission spectra (a) and fluorescence intensity (b, λem = 478 nm) of PP-PS (10 μM) upon addition of various analytes (1–21 (1000 μM)): blank, GSH, Cys, Hcy, Na2S, Na2S2O3, Na2SO3, Na2SO4, H2O2, NaClO, CaCO3, K2CO3, ZnSO4, MgSO4, CH3COONa, NaNO2, NaHSO3, NaCl, KH2PO4, KHSO5, and S8; 22 (50 μM): Na2S2 in PBS buffer (10 mM, pH 7.4, containing 1 mM CTAB). | ||
2.4. Mechanism studies
The response mechanism can be inferred from the spectral results, as shown in Fig. 4a. Furthermore, to verify the response mechanism induced by H2Sn, HPLC analysis of the mixture of the probe and Na2S2 reaction system was performed. As shown in Fig. 4b, PP-PS appeared at 8.96 minutes, and PP-OH appeared at 7.77 minutes. When 1 eq. of Na2S2 was added to the PP-PS solution, the peaks of 8.96 minutes and 7.77 minutes appeared. The same results were also observed in ESI-MS analysis (Fig. 4c). After adding Na2S2 to the PP-PS solution, [M + H]+ = 287.1174 was determined, which corresponds to the production of PP-OH. This further confirmed the proposed reaction mechanism. These studies confirmed that PP-PS could react with Na2S2 and produce PP-OH which fluoresced at 478 nm.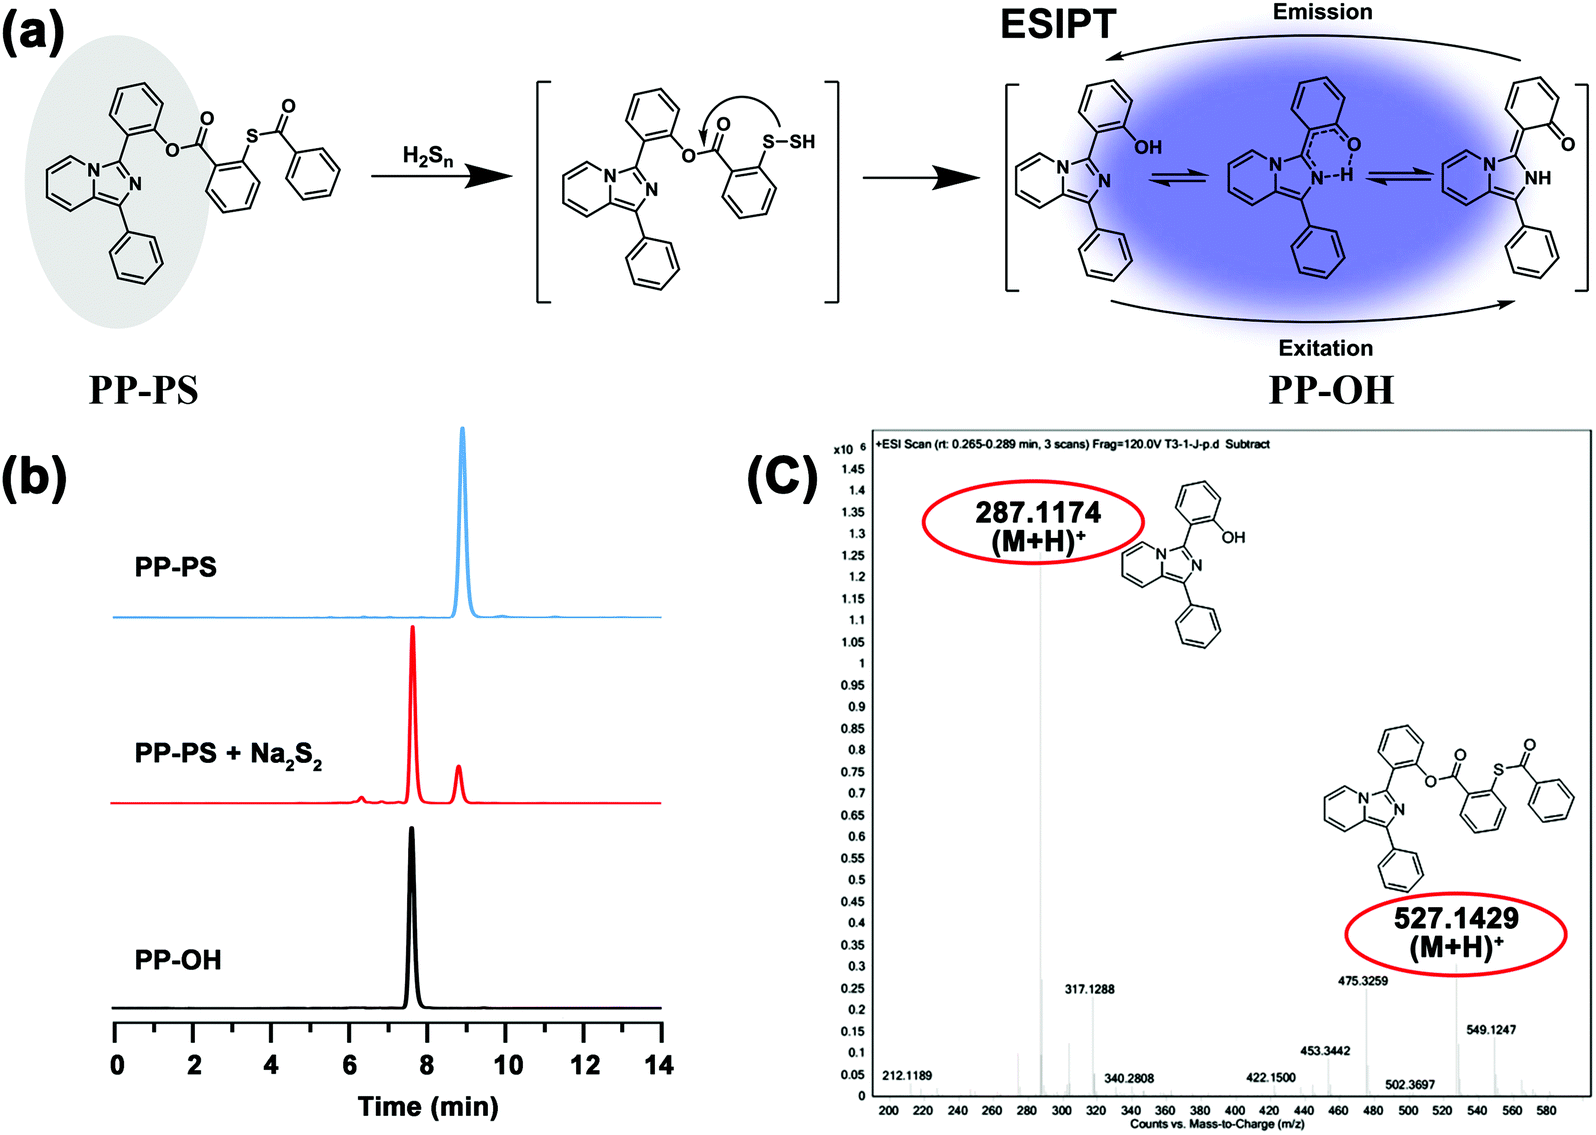 | ||
| Fig. 4 (a) The proposed reaction mechanism of PP-PS towards H2Sn; (b) HPLC chromatograms: eluent, MeOH/H2O (0–14 min, 95.0:5.0); flow rate, 0.5 mL min−1; temperature, 25 °C; detection wavelength, 254 nm; and injection volume, 10.0 μL; (c) The HRMS spectrum of the probe PP-PS reacted with Na2S2. | ||
2.5. Cytotoxicity and cell imaging of PP-PS
Before applying the probe for cell imaging, the cytotoxicity of the probe by MTT assay was evaluated. The results are shown in Fig. 5. After the probe PP-PS (0–1000 μM) was incubated with A549, MCF-7, and U87 cancer cells for 24 hours, the cell viability in all cases was higher than 50%. This indicates that the probe PP-PS has low cytotoxicity and can be further applied in cell imaging and other biological experiments. | ||
| Fig. 5 Cytotoxicity of PP-PS (5 μM, 10 μM, 20 μM, 50 μM, 100 μM, 250 μM, 500 μM, 750 μM and 1000 μM) against A549, MCF-7, and U87 cells. | ||
Since the probe PP-PS showed excellent spectral properties in in vitro tests, we further applied PP-PS in intracellular imaging to detect H2Sn. As shown in Fig. 6a, A549 cells were incubated with the probe PP-PS only for 20 min at 37 °C as a control, and the cells showed weak fluorescence. The control A549 cells treated with N-ethylmaleimide (NEM, RSS Blocker) for 30 minutes and then with PP-PS for 20 minutes showed weak fluorescence (Fig. 6b). Then the cells treated with Na2S2 (15 μM) for 20 minutes were further treated with PP-PS for another 20 minutes, and a strong fluorescence signal was observed (Fig. 6c). These results demonstrated that PP-PS can be used to directly detect H2Sn in living cells. As we know, lipopolysaccharide (LPS) induces cystathionine g-lyase (CSE) mRNA overexpression to promote the initial real-time productivity of H2Sn.35 Therefore, when A549 cells were stimulated with LPS (1 μg mL−1) for 14 hours and then treated with PP-PS for 20 minutes, significantly enhanced fluorescence was observed as expected (Fig. 6d). Fortunately, similar experimental results were observed in MCF-7 and U87 cells (Fig. S11 and S12†). These results indicated that the probe PP-PS can be applied to the visualization of endogenous and exogenous H2Sn in living cancer cells.
 | ||
| Fig. 6 Cell images of H2Sn in living A549 cells. (a1–a3) Cells incubated with PP-PS (10 μM) for 20 min at 37 °C; (b1–b3) cells pretreated with 1 mM NEM for 30 min and then incubated with PP-PS (10 μM) for 20 min at 37 °C; (c1–c3) cells pretreated with 15 μM Na2S2 for 20 min and then incubated with PP-PS (10 μM) for 20 min at 37 °C; and (d1–d3) cells preincubated with 1 μg mL−1 LPS for 14 h and incubated with PP-PS (10 μM) for 20 min at 37 °C. | ||
2.6. Detection of H2Sn in the lysosome
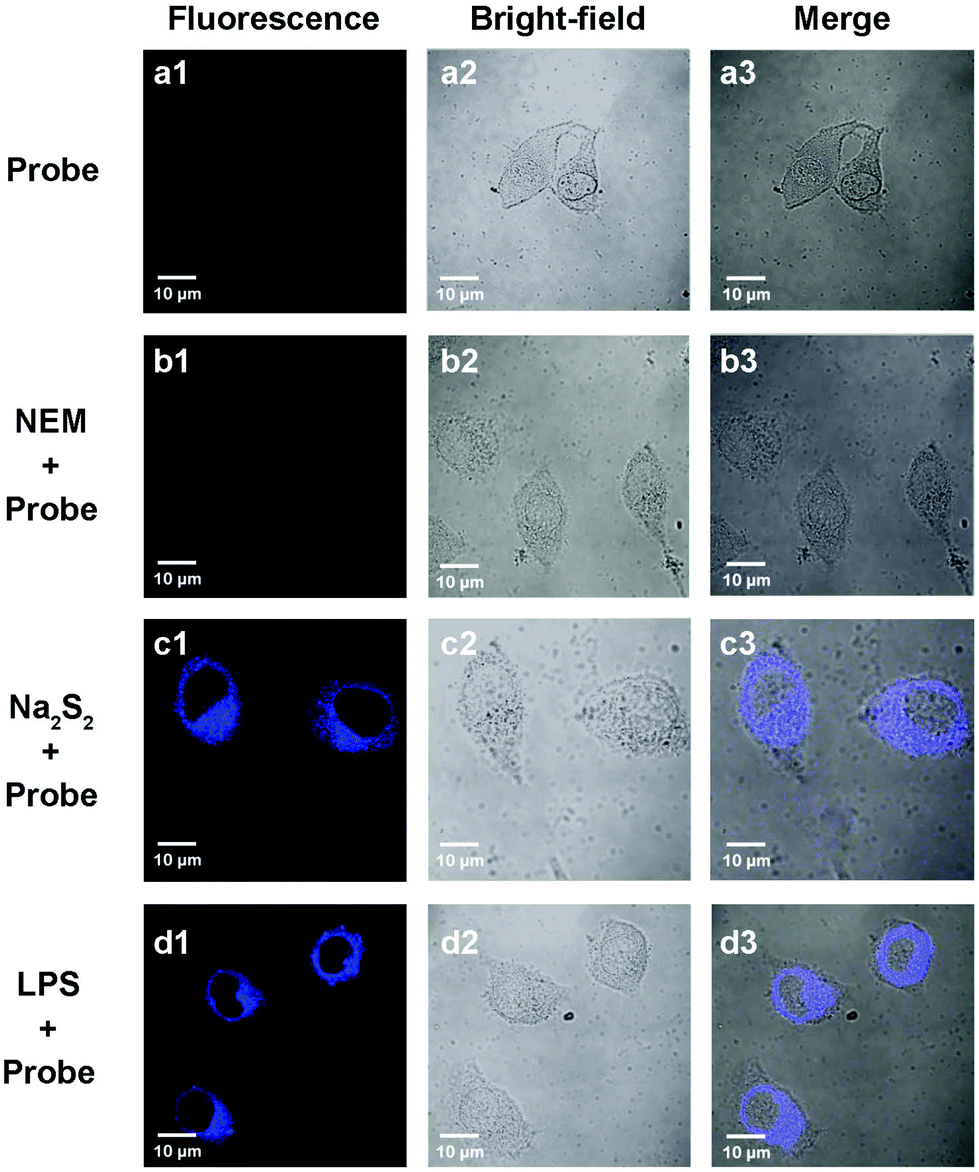
PP-PS was successfully applied to cell imaging for detecting H2Sn. After that we found that our probe seems to be lysosome-targetable and we tried to confirm this. Endogenous H2Sn is induced by LPS and the process is described in part 2.5. After culturing for 24 h and washing with PBS buffer, A549 cells were treated with LPS and LysoRed (commercial lysosomal dye, λex = 575 nm, λem = 600 nm). Intracellular fluorescence signals were observed by laser confocal fluorescence microscopy (LCFM, FV1000, Olympus, Japan). As shown in Fig. 7, the blue fluorescence signal from the probe PP-PS overlaps well with the red fluorescence signal of the commercial lysosomal dye LysoRed. Furthermore, the red channel and blue channel were merged and turned purple, as shown in Fig. 7c. A scattergram of the fluorescence signals of the two fluorescent channels in the fused image was obtained by software processing, and their correlation coefficients were calculated. The fluorescence of the probe PP-PS and the fluorescence of the commercial lysosomal dye LysoRed show a good overlap in distribution and intensity (Fig. 7f, Pearson coefficient = 0.79192). The images of A549 cells treated with LPS (1 μg mL−1), PP-PS (10 μM) and MitoGreen (1 μM) were also observed. In comparison, the fluorescence of the probe PP-PS and the fluorescence of the commercial mitochondria dye MitoGreen show a poor overlap in distribution and intensity (Fig. S13,† Pearson coefficient = 0.52). All these results indicated that the probe PP-PS could selectively aggregate in the lysosomes, and shows a good response to H2Sn in the lysosomes.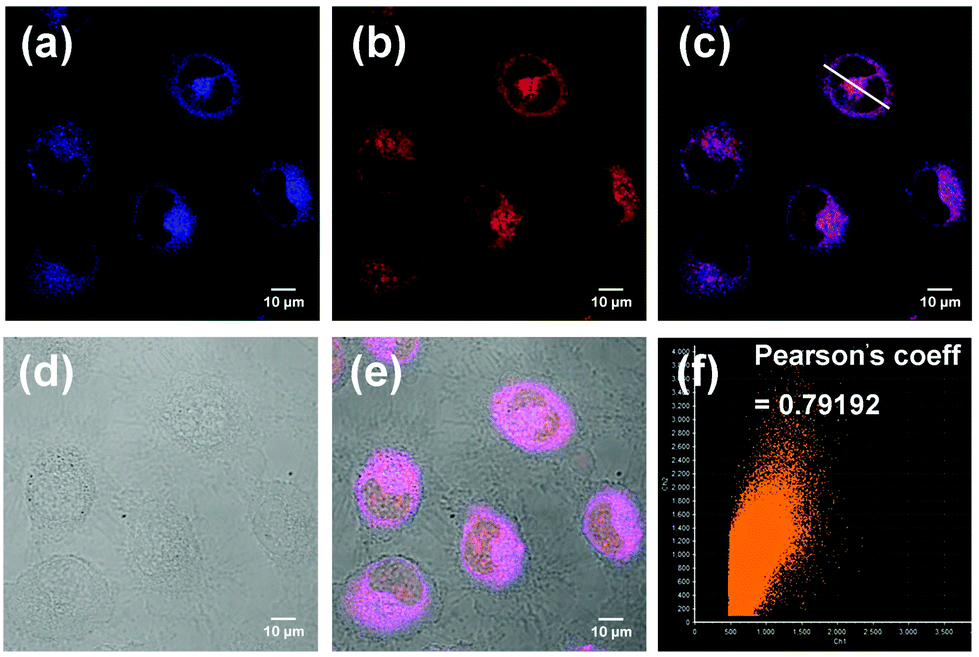 | ||
| Fig. 7 Images of A549 cells treated with LPS (1 μg mL−1), PP-PS (10 μM) and LysoRed (1 μM). The cells were pretreated with 1 μg mL−1 LPS for 14 h, and then incubated with LysoRed (1 μM) for 30 min, and PP-PS (10 μM) for another 20 min. (a) Cell imaging of PP-PS with blue channels; (b) cell imaging of LysoRed with red channels; (c) cell imaging of merged red and blue channels; (d) cell imaging of bright field; (e) cell imaging of merged red and blue channels and bright field; and (f) the colocalization areas of the images of (a) and (b). | ||
2.7. Tumor tissue imaging
The ability of PP-PS to detect H2Sn in living tissues was further examined by laser confocal fluorescence microscopy (Fig. 8). Tumor tissues treated with Na2S2 (50 μM) and PP-PS showed significant fluorescence enhancement compared to those treated with PP-PS only or PP-PS and NEM (Fig. 8b1–b3). Similarly, tumor tissues treated with LPS (1 μg ml−1) and PP-PS showed significant fluorescence enhancement (Fig. 8b4). These results indicate that PP-PS is highly selective for exogenous and endogenous H2Sn in tumor tissues, which is consistent with H2Sn fluorescence imaging in living cancer cells. The probe PP-PS could be useful in various biological and clinical applications in tumor tissues.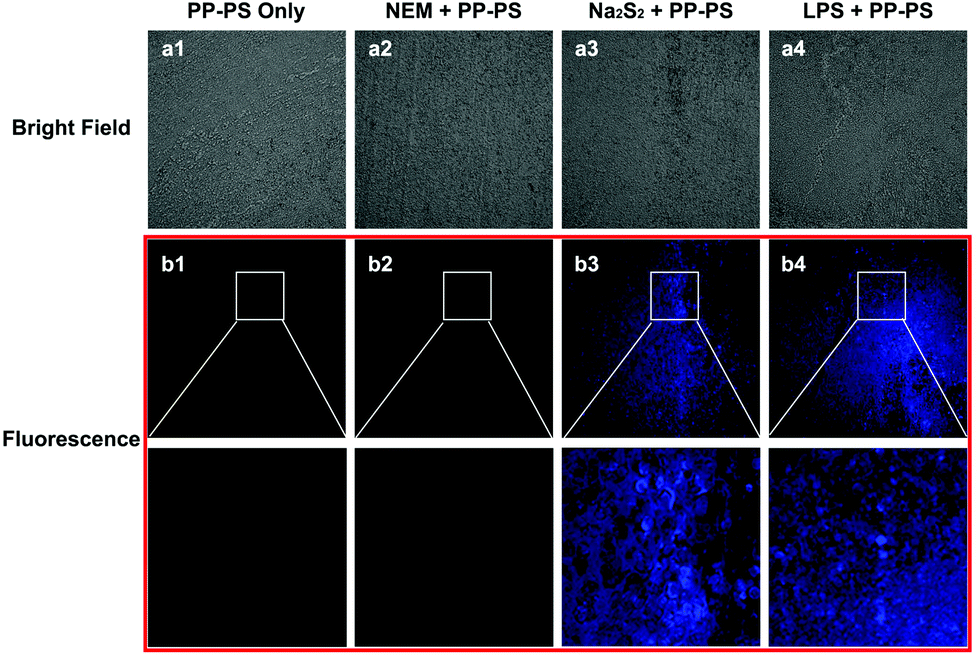 | ||
| Fig. 8 Fluorescence images of mouse tumor tissues. Bright field (a1) and fluorescence (b1) images of tumor tissues treated with PP-PS (30 μM) only for 40 min; bright field (a2) and fluorescence (b2) images of tumor tissues pretreated with 1 mM NEM for 30 min and the probe PP-PS (30 μM) for another 40 min; bright field (a3) and fluorescence (b3) images of tumor tissues pretreated with 50 μM Na2S2 for 30 min and the probe PP-PS (30 μM) for another 40 min; and bright field (a4) and fluorescence (b4) images of tumor tissues pretreated with 1 μg mL−1 LPS for 14 h and the probe PP-PS (30 μM) for another 40 min. (Note: The bottom row in the red box is the corresponding magnification of the image above.) | ||
2.8. Imaging of H2Sn in an inflamed mouse model
The probe PP-PS was further applied to assess H2Sn levels in inflamed mouse models. LPS, an inflammatory mediator, can induce CSE overexpression. H2Sn could be generated enzymatically by CSE. In this experiment, the right leg of the mouse was injected subcutaneously with LPS (1 μg ml−1) to induce leg inflammation.36,37 After 14 hours, PP-PS (30 μM) was subcutaneously injected into the same site and incubated for another 40 min. The right leg of another mouse was injected with PP-PS (30 μM) and incubated for 40 min as a control. Significant fluorescence enhancement was observed in LPS-treated mouse muscle tissue sections compared to the control group (Fig. 9b1 and b2). This indicates that the concentration of H2Sn in the inflamed muscle tissues is higher than that in normal muscle tissues. It should be noted that similar results were observed in the intestinal inflammation model (Fig. 9b3 and b4).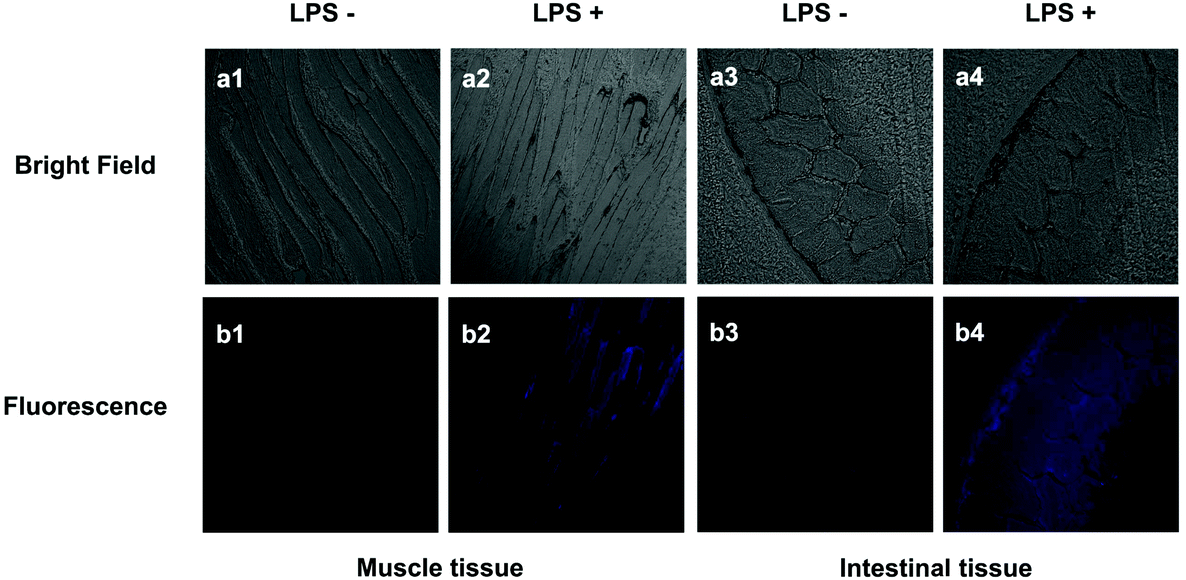 | ||
| Fig. 9 Fluorescence images of mouse muscle and intestinal tissues. Bright field (a1) and fluorescence (b1) images of muscle tissues treated with PP-PS (30 μM) only for 40 min; bright field (a2) and fluorescence (b2) images of muscle tissues pretreated with 1 μg mL−1 LPS for 14 h and the probe PP-PS (30 μM) for another 40 min; bright field (a3) and fluorescence (b3) images of intestinal tissues treated with PP-PS (30 μM) only for 40 min; and bright field (a4) and fluorescence (b4) images of intestinal tissues pretreated with 1 μg mL−1 LPS for 14 h and the probe PP-PS (30 μM) for another 40 min. | ||
It can be concluded that the change in fluorescence is caused by an increase in H2Sn concentration in mice tissues treated with LPS, which can be detected by PP-PS. Similar results were reported in the previous literature that the increase in H2Sn in the mouse model is induced by LPS.38 In summary, the probe PP-PS could be used to visualize endogenous H2Sn in inflamed muscles tissues and inflamed intestinal tissues of mice.
3. Experimental section
3.1. Confocal fluorescence imaging of cells by PP-PS
To verify whether the probe could detect endogenous and exogenous H2Sn in living cells, A549, U87, and MCF-7 cell lines were used for cell imaging experiments. Specifically, the cell suspension was added to a laser confocal culture dish at a density of 5 × 10⁵ cells per well. After being cultured for 24 hours, the cells were treated with PP-PS (10 μM) for another 20 minutes.For lysosomal staining, A549 cells were stained with LysoRed (1 μM) for 30 minutes and then treated with PP-PS (10 μM) for another 20 minutes. For mitochondria staining, A549 cells were stained with MitoGreen (1 μM) for 30 minutes and then treated with PP-PS (10 μM) for another 20 minutes. Fluorescence images of the cells were observed using an FV1000 laser confocal fluorescence microscope (LCFM, Olympus, Japan). The fluorescence signals were collected at the blue fluorescent channel (λex = 405 nm) and the red fluorescent channel (λex = 568 nm).
3.2. Tumor tissue imaging
All animal procedures were performed in accordance with the Guidelines for Care and Use of Laboratory Animals of China Pharmaceutical University and approved by the Animal Ethics Committee of China Pharmaceutical University.The tumor tissues were prepared from the following four groups: (1) intratumoral injection with PP-PS (30 μM) and stimulation for 40 min; (2) intratumoral injection with NEM (1 mM for 30 min) and PP-PS (30 μM, for another 40 min); (3) intratumoral injection with Na2S2 (50 μM for 30 min) and PP-PS (30 μM, for another 40 min); and (4) intratumoral injection with LPS (1 μg ml−1 for 14 h) and PP-PS (30 μM, for another 40 min). These four groups of tumors were excised and treated according to the literature for tumor tissue imaging analysis. The fluorescence images of the tissue slices were acquired using fluorescence excitation and emission windows of the DAPI channel (blue channel).
3.3. LPS-stimulated inflamed tissues
LPS-stimulated inflamed tissue imaging experiments can be divided into four groups, specifically: (1) PP-PS (30 μM) was subcutaneously injected into the right legs of mice and stimulated for 40 min. (2) LPS (1 μg ml−1) was subcutaneously injected into the right legs of mice. After stimulation for 14 h, PP-PS (30 μM) was injected into the same site of the right legs and stimulated for another 40 min. (3) PP-PS (30 μM) was intraperitoneally injected into the abdomen of mice and stimulated for 40 min. (4) LPS (1 μg ml−1) was intraperitoneally injected into the abdomen of mice. After stimulation for 14 h, PP-PS (30 μM) was injected into the same site of the abdomen of mice and stimulated for 40 min. The right leg muscles of the first two groups and the intestines of the latter two groups were excised and treated according to the literature for inflamed tissue imaging analysis. The fluorescence images of the tissue slices were acquired using fluorescence excitation and emission windows of the DAPI channel (blue channel).4. Conclusions
In this work, a new lysosome localization “turn-on” fluorescent probe PP-PS was designed and synthesized for the detection of endogenous H2Sn. The probe can selectively distinguish H2Sn from other biothiols. The probe has a large Stokes shift (178 nm), low detection limit (1 nM), and short response time (1 minute). Due to the low toxicity and high sensitivity of PP-PS, the probe was successfully applied in the imaging of endogenous H2Sn in the lysosomes of living cancer cells, xenograft mouse tumor tissues, and LPS-induced inflammation in mouse tissues. With all these excellent properties, we believe that this probe has broad prospects for future biological and clinical research.Conflicts of interest
There are no conflicts to declare.Acknowledgements
This work was supported by the Natural Science Foundation Committee of China (NSFC 81671803), the National Key Research and Development Program (Grant No. 2017YFC0107700), the Outstanding Youth Foundation of Jiangsu Province (GX20171114003 and BK20170030), the Fok Ying Tung Education Foundation (161033), the “Double First-Class” University project (CPU2018GY06), the Post-doctoral Innovative Talent Support Program (BX20190389) and the Priority Academic Program Development of Jiangsu Higher Education Institutions. We are also grateful to Xinyi Zhang for her grammar help.Notes and references
- N. Lau and M. D. Pluth, Curr. Opin. Chem. Biol., 2019, 49, 1–8 CrossRef CAS.
- T. V. Mishanina, M. Libiad and R. Banerjee, Nat. Chem. Biol., 2015, 11, 457–464 CrossRef CAS.
- V. S. Lin, W. Chen, M. Xian and C. J. Chang, Chem. Soc. Rev., 2015, 44, 4596–4618 RSC.
- Y. Fabiao, H. Xiaoyue and C. Lingxin, Chem. Commun., 2014, 50, 12234–12249 RSC.
- H. Kimura, Folia Pharmacol. Jpn., 2016, 147, 23–29 CrossRef CAS.
- K. Ono, T. Akaike, T. Sawa, Y. Kumagai, D. A. Wink, D. J. Tantillo, A. J. Hobbs, P. Nagy, M. Xian, J. Lin and J. M. Fukuto, Free Radicals Biol. Med., 2014, 77, 82–94 CrossRef CAS.
- X. Han, X. Song, B. Li, F. Yu and L. Chen, Biomater. Sci., 2018, 6, 672–682 RSC.
- W. Chen, C. Liu, B. Peng, Y. Zhao, A. Pacheco and M. Xian, Chem. Sci., 2013, 4, 2892–2896 RSC.
- D. L. Neill, Y.-C. Chang, W. Chen, L. Li and M. Xian, Sens. Actuators, B, 2019, 292, 263–269 CrossRef CAS.
- M. Gao, R. Wang, F. Yu and L. Chen, Biomaterials, 2018, 160, 1–14 CrossRef CAS.
- Y. Zheng, B. Yu, D. L. C. Lk, C. M. Roy, A. Anifowose and B. Wang, Med. Res. Rev., 2018, 38, 57–100 CrossRef CAS.
- M. R. Filipovic, J. Zivanovic, B. Alvarez and R. Banerjee, Chem. Rev., 2018, 118, 1253–1337 CrossRef CAS.
- T. V. Mishanina, M. Libiad and R. Banerjee, Nat. Chem. Biol., 2015, 11, 457–464 CrossRef CAS.
- K. Ono, T. Akaike, T. Sawa, Y. Kumagai, D. A. Wink, D. J. Tantillo, A. J. Hobbs, P. Nagy, M. Xian, J. Lin and J. M. Fukuto, Free Radicals Biol. Med., 2014, 77, 82–94 CrossRef CAS.
- K. R. Olson, Y. Gao, F. Arif, K. Arora, S. Patel, E. R. DeLeon, T. R. Sutton, M. Feelisch, M. M. Cortese-Krott and K. D. Straub, Redox Biol., 2018, 15, 74–85 CrossRef CAS.
- F. Yu, X. Han and L. Chen, Chem. Commun., 2014, 50, 12234–12249 RSC.
- S.-I. Bibli, B. Luck, S. Zukunft, J. Wittig, W. Chen, M. Xian, A. Papapetropoulos, J. Hu and I. Fleming, Redox Biol., 2018, 18, 295–304 CrossRef CAS.
- W. Chen, E. W. Rosser, T. Matsunaga, A. Pacheco, T. Akaike and M. Xian, Angew. Chem., Int. Ed., 2015, 54, 13961–13965 CrossRef CAS.
- W. Chen, E. W. Rosser, D. Zhang, W. Shi, Y. Li, W.-J. Dong, H. Ma, D. Hu and M. Xian, Org. Lett., 2015, 17, 2776–2779 CrossRef CAS.
- W. Chen, A. Pacheco, Y. Takano, J. J. Day, K. Hanaoka and M. Xian, Angew. Chem., Int. Ed., 2016, 55, 9993–9996 CrossRef CAS PubMed.
- Y. Huang, F. Yu, J. Wang and L. Chen, Anal. Chem., 2016, 88, 4122–4129 CrossRef CAS PubMed.
- M. Gao, F. Yu, H. Chen and L. Chen, Anal. Chem., 2015, 87, 3631–3638 CrossRef CAS.
- M. Gao, X. Zhang, Y. Wang, Q. Liu, F. Yu, Y. Huang, C. Ding and L. Chen, Anal. Chem., 2019, 91, 7774–7781 CrossRef CAS.
- C. Liu, W. Chen, W. Shi, B. Peng, Y. Zhao, H. Ma and M. Xian, J. Am. Chem. Soc., 2014, 136, 7257–7260 CrossRef CAS.
- K. Umezawa, M. Kamiya and Y. Urano, Angew. Chem., Int. Ed., 2018, 57, 9346–9350 CrossRef CAS PubMed.
- H. Kimura, Antioxid. Redox Signal., 2017, 27, 619–621 CrossRef CAS.
- K. R. Olson, Biochem. Pharmacol., 2018, 149, 77–90 CrossRef CAS.
- H. Kimura, Neurochem. Int., 2019, 126, 118–125 CrossRef CAS.
- R. Greiner, Z. Pálinkás, K. Bäsell, D. Becher, H. Antelmann, P. Nagy and T. P. Dick, Antioxid. Redox Signal., 2013, 19, 1749–1765 CrossRef CAS.
- L. Salassa, C. Garino, A. Albertino, G. Volpi, C. Nervi, R. Gobetto and K. I. Hardcastle, Organometallics, 2008, 27, 1427–1435 CrossRef CAS.
- G. Volpi, G. Magnano, I. Benesperi, D. Saccone, E. Priola, V. Gianotti, M. Milanesio, E. Conterosito, C. Barolo and G. Viscardi, Dyes Pigm., 2017, 137, 152–164 CrossRef CAS.
- P. Tecilla, V. Jubian and A. D. Hamilton, Tetrahedron, 1995, 51, 435–448 CrossRef CAS.
- T. Takata, D. Saeki, Y. Makita, N. Yamada and N. Kihara, Inorg. Chem., 2003, 42, 3712–3714 CrossRef CAS.
- W. Li, S. Zhou, L. Zhang, Z. Yang, H. Chen, W. Chen, J. Qin, X. Shen and S. Zhao, Sens. Actuators, B, 2019, 284, 30–35 CrossRef CAS.
- Y. Ren, L. Zhang, Z. Zhou, Y. Luo, S. Wang, S. Yuan, Y. Gu, Y. Xu and X. Zha, Anal. Chim. Acta, 2019, 1056, 117–124 CrossRef CAS.
- D. Liu, Y. Lv, M. Chen, D. Cheng, Z. Song, L. Yuan and X. Zhang, J. Mater. Chem. B, 2019, 7, 3970–3975 RSC.
- L. Yuan, L. Wang, B. K. Agrawalla, S.-J. Park, H. Zhu, B. Sivaraman, J. Peng, Q.-H. Xu and Y.-T. Chang, J. Am. Chem. Soc., 2015, 137, 5930–5938 CrossRef CAS.
- J.-B. Li, Q. Wang, H.-W. Liu, L. Yuan and X.-B. Zhang, Chem. Commun., 2019, 55, 4487–4490 RSC.
Footnotes |
| † Electronic supplementary information (ESI) available. See DOI: 10.1039/c9bm01616c |
| ‡ These authors contributed equally. |
| This journal is © The Royal Society of Chemistry 2020 |