Dual light-induced in situ antibacterial activities of biocompatibleTiO2/MoS2/PDA/RGD nanorod arrays on titanium†
Guannan
Zhang
a,
Xingyu
Zhang
a,
Yongqiang
Yang
b,
Ruifang
Chi
c,
Jing
Shi
d,
Ruiqiang
Hang
 a,
Xiaobo
Huang
a,
Xiaohong
Yao
*a,
Paul K.
Chu
a,
Xiaobo
Huang
a,
Xiaohong
Yao
*a,
Paul K.
Chu
 e and
Xiangyu
Zhang
 *a
*a
aCollege of Materials Science and Engineering, Taiyuan University of Technology, Taiyuan 030024, China. E-mail: zhangxiangyu@tyut.edu.cn; xhyao@tyut.edu.cn
bJiangsu Provinces Special Equipment Safety Supervision Inspection Institute, Branch of Wuxi, National Graphene Products Quality Supervision and Inspection Center (Jiangsu), Yanxin Road 330, Wuxi 214174, China
cSecond Hospital of Shanxi Medical University, Taiyuan 030024, China
dAnalytical Instrumentation Center, State Key Laboratory of Coal Conversion, Institute of Coal Chemistry, Chinese Academy of Sciences, Taiyuan 030001, China
eDepartment of Physics and Department of Materials Science and Engineering, City University of Hong Kong, Tat Chee Avenue, Kowloon, Hong Kong, China
First published on 25th October 2019
Abstract
Prevention of bacterial infection and promotion of osseointegration are two important issues for titanium (Ti) implants in medical research. In addition, after a biofilm is formed on the surface of implants, the immune system and antibiotic therapy may fail. In this work, bio-functionalized titanium dioxide (TiO2)/molybdenum disulfide (MoS2)/polydopamine (PDA)/arginine-glycine-aspartic acid (RGD) nanorod arrays (NAs) are prepared on Ti implants to not only kill bacteria noninvasively upon co-irradiation of 660 nm visible light (VL) and 808 nm near infrared (NIR) light, but also promote the osteogenic activity simultaneously. Dual light irradiation triggers the TiO2/MoS2 NA to generate hyperthermia and reactive oxygen species (ROS) in 10 min. The synergistic effects of the generated hyperthermia and ROS increase the bacterial membrane permeability and bacteria are killed rapidly and efficiently in vitro and in vivo. The biofilm is also eradicated and RGD on the nanorods improves cell adhesion, proliferation, and osteogenic differentiation. The strategy described here for the design of bio-functionalized coatings on Ti implants has great clinical potential in orthopedics, dentistry, and other medical fields.
1. Introduction
The increasing number of orthopedic diseases stemming from the aging population has led to high demand for artificial implants.1–3 Nevertheless, implant-related infection induced by bacteria and insufficient bone tissue integration remain the major problems after implantation leading to possible implant failure.4,5 Infection usually occurs when the implant surface provides a hospitable place for bacteria to adhere and proliferate. After a bacterial biofilm is formed, infection of surrounding tissues can occur and the host defense and antibiotic therapy may fail.6–9 There are several strategies to improve the antimicrobial properties of implants such as release of antimicrobial agents like Ag, Cu, and Zn.10–14 However, the associated toxicity, especially in high concentrations, hampers clinical applications15–18 and so it is necessary to develop new methods to resist bacterial infection.Light-assisted antibacterial therapies including photodynamic therapy (PDT) and photothermal therapy (PTT) therapy have received much attention due to the high bactericidal efficiency.19,20 However, if one of the methods is used alone for antibacterial activity, normal tissues can be damaged as a result of the high temperature and triggering of ROS.21,22 A temperature of about 50 °C can increase the bacterial membrane permeability so that the bacteria can be killed more easily by ROS. Consequently, it is desirable to combine PDT and PTT for bacteria killing in the human body.23,24
In addition to having antibacterial properties, ideal bone implants should also have good biocompatibility and osteogenic activity.23–25 Bioactive moieties including osteogenic growth factors, functional peptides, and proteins have been used to improve the osteogenic activity of implant materials and bone tissue.26–28 In this respect, TiO2 nanorod arrays have been widely investigated in biological and photocatalytic fields.29–31 The cell behavior is sensitive to the nanoscale topography of the substrate and the nanopatterned surface has been shown to promote the expression of integrins and formation of focal adhesions consequently promoting assembly of the cytoskeletal structure.32–34 It has been reported that the appropriate size and morphology of TiO2 nanorods are conducive to cell growth.35 At the same time, TiO2 has good photocatalytic characteristics and can produce ROS. However, the bandgap of TiO2 is 3.2 eV thereby requiring activation by ultraviolet light which greatly limits its application as a photosensitizer for light-triggered antibacterial therapy. Moreover, the photocatalytic efficiency of TiO2 nanorod arrays is also limited by factors such as the large effective irradiation area of the nanostructured arrays, multiple scattering of incident light between the nanostructures in the arrays, and increased path length of the incident light in the nanostructure arrays.36,37
MoS2, a member of layered transition metal dichalcogenides, has garnered increasing attention with regard to antibacterial PTT because of its good biocompatibility, large surface area, and high photothermal conversion efficiency in the NIR region.38–43 In particular, different types of TiO2/MoS2 composites with superior photocatalytic activity have been explored. The interfacial charge carriers are transferred between MoS2 and TiO2 to suppress electron–hole pair recombination.44–47 Therefore, TiO2/MoS2 composites are materials for PTT and PDT. PDA can be polymerized and self-assembled onto different surfaces to form a PDA coating with good biocompatibility, biodegradability and hydrophilicity. Hence, it is an excellent platform and stabilizer for the immobilization of a variety of organic and inorganic materials with special functions.48–51 The peptide RGD is believed to promote adhesion and proliferation of osteoblasts on orthopedic implants, and coatings with immobilized RGD on Ti implants have been shown to possess good osseointegration.52–55
In general, photosensitizer-containing coatings are commonly prepared on implant surfaces for light-assisted antibacterial therapies. In this work, we expected to construct a nanostructure on a Ti surface, which could not only eliminate the biofilms noninvasively by PTT and PDT, but also promote the osteogenic activity simultaneously by the nanostructure. Herein, TiO2/MoS2 NAs on Ti are designed to achieve this aim. In order to further improve the osteogenic differentiation capacity, RGD is decorated on the surface of the TiO2/MoS2 NA. The TiO2/MoS2 NA is prepared by a two-step hydrothermal treatment, followed by immobilizing RGD on the TiO2/MoS2 nanorods by the Michael addition reaction with PDA. The fabrication process of the hybrid arrays on Ti is shown in Scheme 1. The TiO2/MoS2 NAs can generate sufficient hyperthermia and ROS upon irradiation with dual light sources (660 nm VL + 808 nm NIR) in a short time. The in vitro and in vivo results reveal that the hybrid NAs have effective antibacterial activity against S. aureus within 10 min as well as outstanding osteogenic properties. The related mechanism is schematically illustrated in Scheme 2.
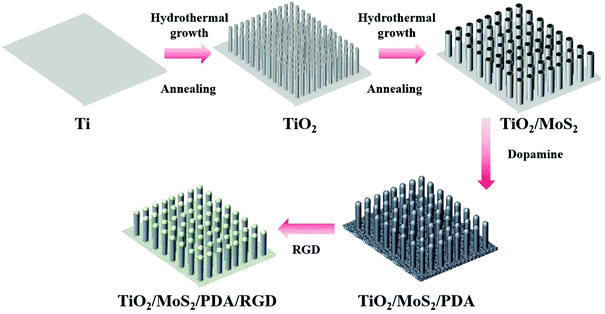 | ||
| Scheme 1 Schematic illustration of the crafting process of the TiO2/MoS2/PDA/RGD NAs on Ti implants. | ||
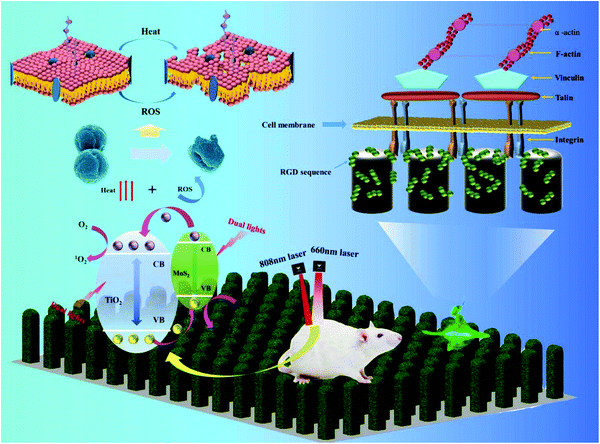 | ||
| Scheme 2 Schematic illustration of sterilization and osteogenic mechanisms of TiO2/MoS2/PDA/RGD NAs. | ||
2. Materials and methods
2.1. Preparation of a TiO2/MoS2/PDA/RGD NA hybrid coating
Biomedical Ti plates with a side length of 1 cm and a height of 2 mm were used as the substrate. They were ultrasonically cleaned in acetone, anhydrous alcohol, and deionized water in sequence. 1 mol L−1 NaOH solution was put into a 50 mL autoclave and the samples were treated in an autoclave for 4 h at 220 °C. Afterwards, the samples were sonicated in deionized water for 30 seconds and immersed in 0.5 mol L−1 HCl for 30 min. They were designated as H2Ti2O5·H2O NAs. After rinsing with deionized water, they were put in a muffle furnace and annealed at 550 °C for 2 h. These samples were designated as TiO2 NAs.50 mg of thioacetamide and 25 mg of sodium molybdate were added to 50 mL of deionized water and put inside an autoclave after dissolving completely. The TiO2 NAs were treated in the autoclave for 24 h at 200 °C to prepare MoS2 on the TiO2 NAs. After rinsing with deionized water, the samples were annealed at 550 °C for 2 h in air and then cooled inside the furnace. The samples were designated as TiO2/MoS2 NAs. The TiO2/MoS2 NAs were immersed in 2 mg mL−1 dopamine hydrochloride in 10 mM Tris-HCl buffer (pH 8.4) for 12 h in darkness at room temperature. The samples were rinsed with deionized water, dried in air, and designated as TiO2/MoS2/PDA NAs. Finally, the TiO2/MoS2/PDA NAs were immersed in 2 mg mL−1 RGD solution in PBS (pH 7.4) for 12 h at room temperature. The samples were then rinsed with deionized water, dried in air, and designated as TiO2/MoS2/PDA/RGD NAs.
2.2. Characterization
The surface morphologies of the samples were observed by field emission scanning electron microscopy (FE-SEM, JSM-7001F, JEOL). The microstructure was analyzed by high-resolution transmission electron microscopy (HR-TEM, JEM-2010, JEOL) and X-ray diffraction (XRD, Rigaku Dmax-3C, Cu Kα radiation). The chemical states of the NAs were determined by X-ray photoelectron spectroscopy (XPS, K-Alpha, Thermo) with monochromatic Al Kα radiation. The surface hydrophilicity was analyzed by the sessile drop method using the Rame’-Hart instrument (USA).2.3. Protein adsorption
The samples were put in 24-well plates and 1 mL of Minimum Essential Medium Alpha Medium (α-MEM, Gibco, America) containing 10% fetal bovine serum (FBS) was added. Afterwards, the samples were incubated at 37 °C for 4 h and rinsed with PBS. 500 μL of the SDS (1%) solution were pipetted onto each sample and agitated for 1 h at 37 °C to collect the protein. The content of the adsorbed protein in the samples was detected by using an assay kit (cat# P0009; Beyotime).2.4. Photodynamic and photothermal properties
Singlet oxygen (1O2) and hydroxyl radicals (˙OH) from the samples upon irradiation with 660 nm VL (0.5 W cm−2) or 808 nm NIR light (0.5 W cm−2) or dual light sources (808 nm, 0.5 W cm−2; 660 nm, 0.5 W cm−2) were detected to evaluate the photodynamic properties. 1,3-Diphenylisobenzofuran (DPBF) was used as an indicator to detect the content of 1O2, which led to a decrease in the absorption intensity at 420 nm. Therefore, the decrease in absorbance reflects the concentration of 1O2 produced by the samples. Methyl violet (MV) was used as an indicator to determine the content of ˙OH and the decrease in the absorption at 580 nm was used to determine the concentration of ˙OH produced by the NAs. The samples were immersed in 3 ml DPBF and MV, respectively, and after irradiation with different light sources for 10 min, the optical density of the solutions was determined by ultraviolet-visible spectrophotometry.To evaluate the photothermal characteristics, the samples were immersed in 1 mL PBS, and then illuminated with various light sources for 10 min. The temperature of the samples was determined by using an infrared thermal imager (FLIRC 7200, FLIR, USA) at an interval of 1 min.
2.5. Glutathione (GSH) oxidation
GSH plays a key role in the antioxidant defense system of bacteria and was used to evaluate the degradation ratio of GSH induced by the samples with dual light irradiation for 15, 30, and 60 min to study the antibacterial properties. The changes in the GSH concentration were evaluated using Elman's experiments. The samples were placed on 24-well plates supplemented with 675 μL of the GSH bicarbonate buffer solution. They were irradiated for 10 minutes by the dual light sources and 45 μl of 0.1 M 5,5′-dithiobis(2-nitrobenzoic acid) (Elman's reagent) and 2.4 mL of 0.05 M tris-Hcl solution (pH = 8) were added to the solution. The loss of GSH was evaluated by measuring the absorbance at 410 nm by spectrophotometry (UV-1800PC) and the 1 × 10⁻³ M of GSH solution was used as the control group.2.6. In vitro antibacterial activity assay
The antibacterial property of NAs against Staphylococcus aureus (S. aureus) was assessed. After sterilization in alcohol for 1 h, the residual alcohol on the samples was rinsed with PBS and transferred to 24-well plates. 1 mL of the diluted bacterial suspension (105 CFU mL−1) was added to the 24-well plates, and then the samples were then irradiated with various light sources for 10 min.2.7. In vitro cytocompatibility
To assess the cell cytotoxicity, proliferation and functions, 1 mL of the cell suspension (2 × 10⁴ cells per cm2) were seeded on the samples and the cell culture medium was changed once a day. Additional 50 μg mL−1 ascorbic acid (Ekear, China), 10 nM dexamethasone (Ekear, China) and 10 mM β-glycerophosphate (Ekear, China) were added to the osteogenic medium for experiments requiring osteoinduction.
Cell proliferation was evaluated quantitatively by MTT (Sigma, USA) assay. The osteoblasts were cultured for 1, 3 and 5 days on 24-well plates, respectively. 900 μL α-MEM culture medium and 100 μL of 5 mg mL−1 MTT solution were added to samples and after 4 hours, the liquid on the 24-well plate was removed. Then, the samples were washed with 1 mL dimethyl sulfoxide (DMSO, Sigma, USA) to dissolve the crystals. Finally, the optical density (OD) of the solution was measured at 492 nm on a microplate reader (Infinite F50, TECAN).
![[thin space (1/6-em)]](https://www.rsc.org/images/entities/char_2009.gif) :
:![[thin space (1/6-em)]](https://www.rsc.org/images/entities/char_2009.gif) 1) for 30 min to elute the stains on the samples, and then the OD was measured at 570 nm.
1) for 30 min to elute the stains on the samples, and then the OD was measured at 570 nm.
The gene expression of RUNX2 and OCN was determined by the StepOne Real-Time PCR Systems (Applied Biosystems) with the TB Green™ Premix Ex Taq™ II (Takara). The results were analyzed by the comparative CT (ΔΔCT) method and the gene expression level of GAPDH was used as normalization. The RNA primers in this study are shown in Table S1.†
2.8. Animal experiments
A rat subcutaneous infection model was adopted using S. aureus to evaluate the antibacterial effects in vivo. 18 male Kunming mice (300–320 g body weight) were divided into three groups, Ti, TiO2/MoS2, and TiO2/MoS2/PDA/RGD. The back of the mice was cut to form a 15 mm wound and soaked in 50 μL of S. aureus (1 × 10⁷ CFU mL−1) for 1 h to build the infected model. An oval shaped sample 10 mm long and 5 mm wide was implanted into the wound and stitched. The wound site of the rat was irradiated with dual light sources (660 nm VL + 808 nm NIR) for 10 min. The tissues of the wounds were harvested and soaked in a 4% paraformaldehyde fix solution to prepare the pathological slides. To evaluate bacterial infection of the soft tissues, the histomorphological change of tissues was assessed by H&E staining and the residual bacteria were evaluated by Giemsa staining. After staining with H&E and Giemsa, the histological pictures were obtained on an optical microscope. Nine rats were killed two days later and the sections of the infected site were subjected to Giemsa staining and H&E staining. After 14 days, the remaining rats were killed and the sections of the remaining rats’ infected site were subjected to H&E staining. The organs including the heart, liver, spleen, lungs, and kidneys were collected and stained with H&E. All animal procedures were performed in accordance with the Guidelines for Care and Use of Laboratory Animals of “Shanxi Medical University” and approved by the Animal Ethics Committee of “International standards of animal welfare”.2.9. Statistical analysis
All the experimental data were analyzed as means ± standard deviations and were in triplicate by the one-way ANOVA. P values <0.05 were considered statistically significant.3. Results and discussion
3.1. Morphology and structure
The TiO2 NAs prepared by the hydrothermal method have a uniform density and spatial distribution (Fig. 1a). The mean diameter of the nanorods and thickness of the NAs (Fig. S1†) are about 30 nm and 1.35 μm, respectively. After the further hydrothermal treatment, TiO2/MoS2 NAs still have a uniform density but the mean diameter of the nanorods increases to 60 nm. As the concentration of the solvent increases, some nanostructured MoS2 muster on the surface of NAs (Fig. S2†). The elemental maps of TiO2/MoS2 (Fig. S3†) show evenly distributed S and Mo confirming the uniform distribution of MoS2 on the NAs. The TiO2/MoS2 nanorods are characterized by TEM. As shown in Fig. 1b, MoS2 nanoflakes stick to the surface of the TiO2 nanorods as confirmed by HR-TEM. The crystal lattices of 0.609 nm and 0.352 nm correspond to the (003) facet of MoS2 and (101) facet of TiO2, respectively. Deposition of PDA makes the nanorods relatively smooth and after covalent immobilization of RGD peptides, the morphology does not change significantly.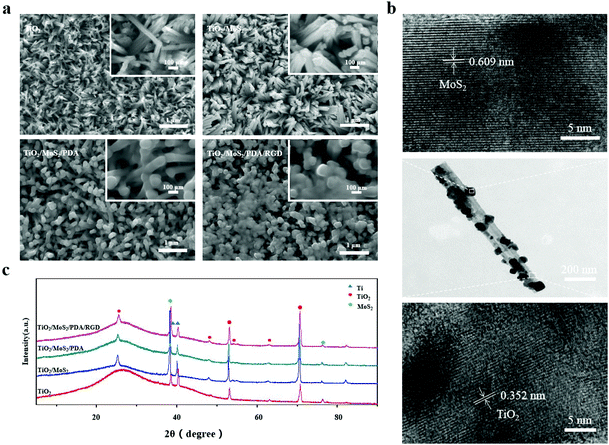 | ||
| Fig. 1 (a) SEM images of TiO2, TiO2/MoS2, TiO2/MoS2/PDA and TiO2/MoS2/PDA/RGD; (b) TEM images of TiO2/MoS2; (c) XRD patterns of NAs. | ||
Fig. 1c shows the XRD patterns of TiO2, TiO2/MoS2, TiO2/MoS2/PDA and TiO2/MoS2/PDA/RGD NAs. The rutile phase of TiO2 can be found from all the samples and the diffraction of peak at 38.37° is indexed to the (104) plane of MoS2. TiO2/MoS2/PDA and TiO2/MoS2/PDA/RGD show similar XRD patterns to TiO2/MoS2, showing that the phase structure of NAs does not change after TiO2/MoS2 grafting of PDA and RGD.
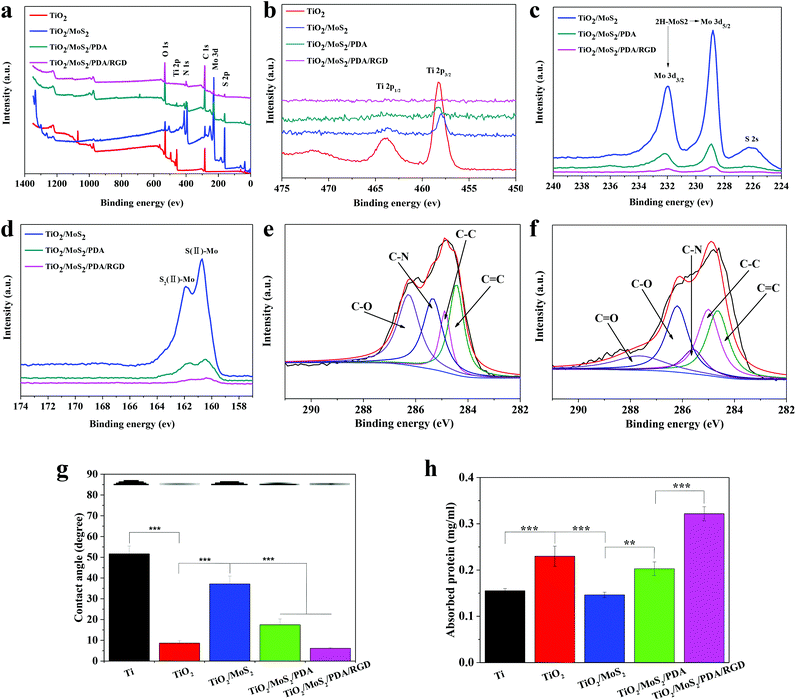
The XPS survey scan (Fig. 2a) shows that apart from Ti and O in NAs, S, Mo, C and N are detected from TiO2/MoS2, TiO2/MoS2/PDA, and TiO2/MoS2/PDA/RGD. The high-resolution Ti 2p spectra in Fig. 2b show that Ti is present in the form of the TiO2 phase. The binding energies of the Mo 3d peak at 231.9 and 228.7 eV and the corresponding peaks of S 2p at 162.8 and 161.6 eV prove that MoS2 consists of TiO2/MoS2, TiO2/MoS2/PDA, and TiO2/MoS2/PDA/RGD. As shown in Fig. 2e and f, the C 1s peaks of TiO2/MoS2/PDA and TiO2/MoS2/PDA/RGD are at 287.7, 286.3, 285.4, 284.6 and 284.1 eV corresponding to C![[double bond, length as m-dash]](https://www.rsc.org/images/entities/char_e001.gif) O, C–O, C–N/C–S, C–C and C
O, C–O, C–N/C–S, C–C and C![[double bond, length as m-dash]](https://www.rsc.org/images/entities/char_e001.gif) C, respectively.23,24 Compared to TiO2/MoS2, TiO2/MoS2/PDA NAs show larger O 1s concentration from 11.3% to 21.82% and N 1s concentration from 1.03% to 5.12% (Fig. 2c and Table S2†). The N/C ratio of 0.09 is close to the theoretical N/C of 0.125 for dopamine,12 indicating that dopamine has been successfully immobilized on the surface of TiO2/MoS2. The N 1s peak is further increased from 5.12% to 10.74% after the RGD immobilization.
C, respectively.23,24 Compared to TiO2/MoS2, TiO2/MoS2/PDA NAs show larger O 1s concentration from 11.3% to 21.82% and N 1s concentration from 1.03% to 5.12% (Fig. 2c and Table S2†). The N/C ratio of 0.09 is close to the theoretical N/C of 0.125 for dopamine,12 indicating that dopamine has been successfully immobilized on the surface of TiO2/MoS2. The N 1s peak is further increased from 5.12% to 10.74% after the RGD immobilization.
Surface hydrophilicity plays a major role in the cell behavior on the biomaterials and excellent hydrophilicity is conducive to the affinity of the cell to the matrix leading to better cell adhesion, osteoblast differentiation and so on.56 As shown in Fig. 2g, the contact angle on Ti is 51.7° and it decreases to 8.7° of TiO2 NAs. This may be due to the change of surface free energy and roughness.57 After introduction of MoS2, the contact angle increases to 37.1° because of the hydrophobic properties of MoS2.58 However, the contact angle decreases to 17.5° again after PDA immobilization and further decreases to 6.2° after coating with RGD because of the hydrophilic nature of PDA and RGD.10,23
It has been certified that the surface of the implant spontaneously absorbs proteins. Protein adsorption is a critical step in the initial stages of cell adhesion, which affects the subsequent interaction of the material with the cell and affects the implantation.59 After incubation for 4 h, the protein amounts on each sample adsorbed from the FBS are shown in Fig. 2h. It is obvious that the amount of protein adsorbed at TiO2/MoS2/PDA/RGD is remarkably higher than those on other samples. Furthermore, the adsorbed protein amounts on TiO2 and TiO2/MoS2/PDA are greater than those on Ti and TiO2/MoS2. These results confirm that the modified surfaces with high hydrophilicity increase protein adsorption by reducing the hydrophobic interactions between the surface and protein.
3.2. Antibacterial properties in vitro
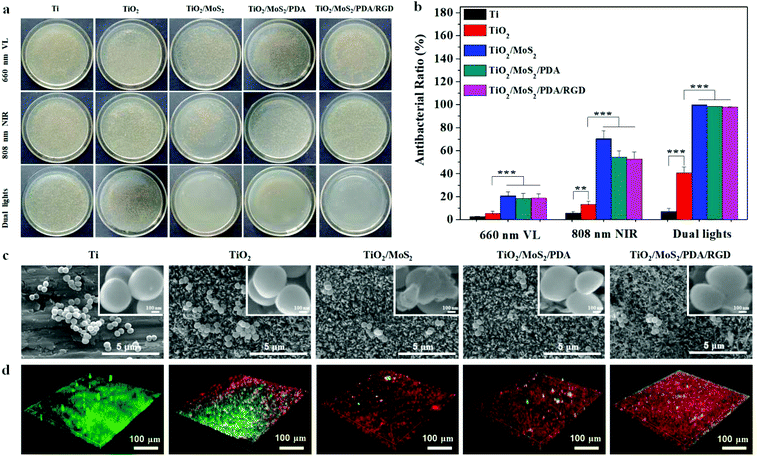
To assess the antibacterial effect of the samples against S. aureus under different light sources, colonies growing on agar plates, live/dead staining, and SEM are performed. Fig. 4a and b show the spread plate results and corresponding antibacterial rates. All the samples exhibit negligible antibacterial activity in darkness within 10 min (Fig. S8†). After individual or dual light irradiation for 10 min, the bacterial colonies cover almost the entire agar plates on Ti indicating that Ti has no obvious antibacterial ability in the presence of light. However, the number of colonies decreases on TiO2 and after MoS2 doping, it is further reduced. The NAs exhibit different antibacterial properties under irradiation with various light sources. As for 660 nm VL, the antibacterial ability is relatively weak and for the MoS2-containing NAs, the antibacterial rate is only about 20%. After changing to the 808 nm NIR light source, the antibacterial ability of NAs improves. After irradiation for 10 min, the antibacterial efficiency of TiO2/MoS2 is over 70%, whereas TiO2/MoS2/PDA and TiO2/MoS2/PDA/RGD show an antibacterial efficiency of about 58%, suggesting that immobilization of PDA and RGD decreases the antibacterial activity of NAs. In comparison, the adverse effect is eliminated basically under dual light irradiation and the antibacterial rates of TiO2/MoS2, TiO2/MoS2/PDA, and TiO2/MoS2/PDA/RGD are 99.9%, 98.5% and 97.8%, respectively.The morphological change of the S. aureus attached to the samples after irradiation with dual light sources for 10 min is shown in Fig. 5c. The number of bacteria on the samples is consistent with the spread plate results. A large amount of bacteria adhering on Ti and TiO2 aggregate into clusters and maintain their smooth sphere with unwounded cell membranes while a few scattered bacteria adhere onto TiO2/MoS2, TiO2/MoS2/PDA, and TiO2/MoS2/PDA/RGD.
To investigate the anti-biofilm property, S. aureus was introduced to the samples, cultured for 48 h, and treated with various samples under irradiation of dual light sources for 10 min. As shown in Fig. 5d, a uniform S. aureus biofilm forms on Ti after 48 h but some red spots indicating dead bacteria can be found on TiO2. Only a few discrete green spots can be observed from MoS2 doped NAs, indicating that TiO2/MoS2, TiO2/MoS2/PDA, and TiO2/MoS2/PDA/RGD have excellent anti-biofilm ability.
3.3. Antibacterial mechanism
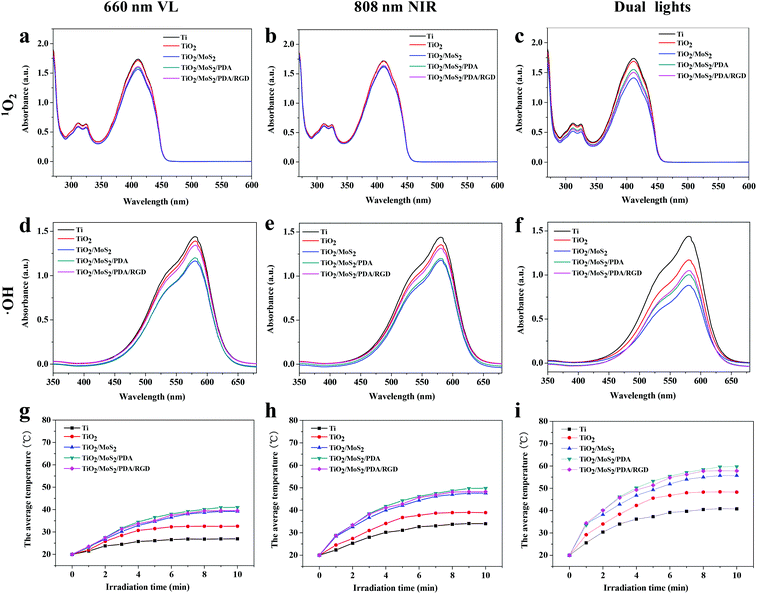
The MoS2 doped TiO2 NAs have excellent antibacterial properties and the antibacterial mechanism may be attributed to three factors: (a) ROS including 1O2 and ˙OH created by 660 nm VL and 808 nm NIR light, (b) hyperthermia produced by photothermal conversion of MoS2 doped TiO2 NAs, and (c) physical puncture of the nanorods. To verify the generation of ROS, DPBF and methyl violet are used. 1O2 and ˙OH can react with DPBF and methyl violet to reduce the absorption intensity at 420 nm and 580 nm, respectively.60,61 Therefore, the yield of 1O2 and ˙OH can be reflected by how much the absorbance is reduced. As shown in Fig. 3a–c, under irradiation of different light sources, the intensity of the absorption peaks of TiO2 is basically the same as Ti, suggesting that TiO2 cannot be triggered to produce 1O2. However, Fig. 3d–f show that both 660 nm and 808 nm light enable TiO2 to generate ˙OH and MoS2 improves the yields of both 1O2 and ˙OH under irradiation of either 660 nm or 808 nm light. The yield under dual light irradiation is almost the sum of individual light irradiation. Surface immobilization of PDA and RGD reduces the amount of ROS because PDA has high antioxidant capacity and can eliminate a part of ROS.12The synergetic interaction between the MoS2 and TiO2 provides a businesslike transmission platform for charge transfer to enhance the photocatalytic activity. Under irradiation of light, the photo-induced electrons are formed on the valence band (VB) of MoS2 and transferred to the conduction band (CB), leaving holes in the VB. The TiO2 nanorod is used as an electron receiver, which makes the photoexcited electrons transfer promptly to the CB of the TiO2 nanorod, due to the higher CB of MoS2. The photogenerated electrons combine with O2 to form 1O2. In the meantime, the holes oxidize water into ˙OH.46,47
Fig. 3g–i show the heating curves of Ti, TiO2, TiO2/MoS2, TiO2/MoS2/PDA, and TiO2/MoS2/PDA/RGD under light irradiation for 10 min in PBS. As expected, 808 nm NIR light is a more conducive illuminant for photothermal conversion than 660 nm VL and under dual light irradiation, the temperature of the various samples goes up further. The temperature of TiO2 is higher than that of Ti due to the larger surface area and refraction of light. MoS2 as a PTT agent improves the photothermal ability of NAs. TiO2/MoS2/PDA and TiO2/MoS2/PDA/RGD have better photothermal properties than TiO2/MoS2 because PDA also possesses excellent photothermal characteristics.62–64 Upon dual light irradiation for 10 min, the temperature of MoS2-doped NAs is about 55 °C.
MoS2 has excellent photodetection ability spanning the UV to NIR region.24 However, the chitosan-assisted MoS2 hybrid coating on Ti can only be triggered by 660 nm light to produce ROS and by 808 nm light to generate enough heat. In this work, both 660 nm and 808 nm light can trigger MoS2-doped NAs to generate ROS and increase the temperature thereby providing more choices to regulate the temperature and yield of ROS since an excessively high temperature and overproduction of ROS can disrupt surrounding cell membranes and tissues.23,24
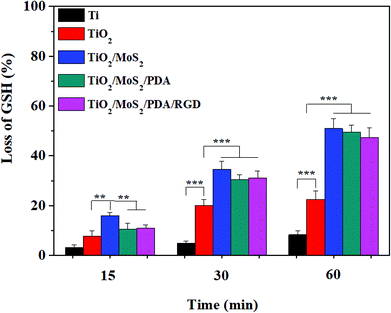
GSH is a tripeptide formed by the condensation of glutamic acid, cysteine and glycine playing a key role in the antioxidant defense system of bacteria and an important indicator of cellular oxidative stress.20 The loss of GSH of the samples under dual light illumination for different times is shown in Fig. 4. All the samples exhibit a time-dependent oxidation behavior and the loss of GSH increases with time. As for Ti, the loss of GSH is very small, suggesting weak oxidation of Ti. The loss of GSH of TiO2, TiO2/MoS2, TiO2/MoS2/PDA, and TiO2/MoS2/PDA/RGD is respectively 22.5%, 51%, 49.5% and 47.4% being consistent with the amount of ROS produced by the samples. MoS2 can promote oxidation of organic mercaptans (R–SH) to yield disulfide (R–S–S–R), which is temperature-dependent.20 The loss of GSH is also in agreement with the rising temperature of TiO2, TiO2/MoS2, TiO2/MoS2/PDA, and TiO2/MoS2/PDA/RGD and the elevated temperature also enhances the catalytic activity of GSH oxidation.
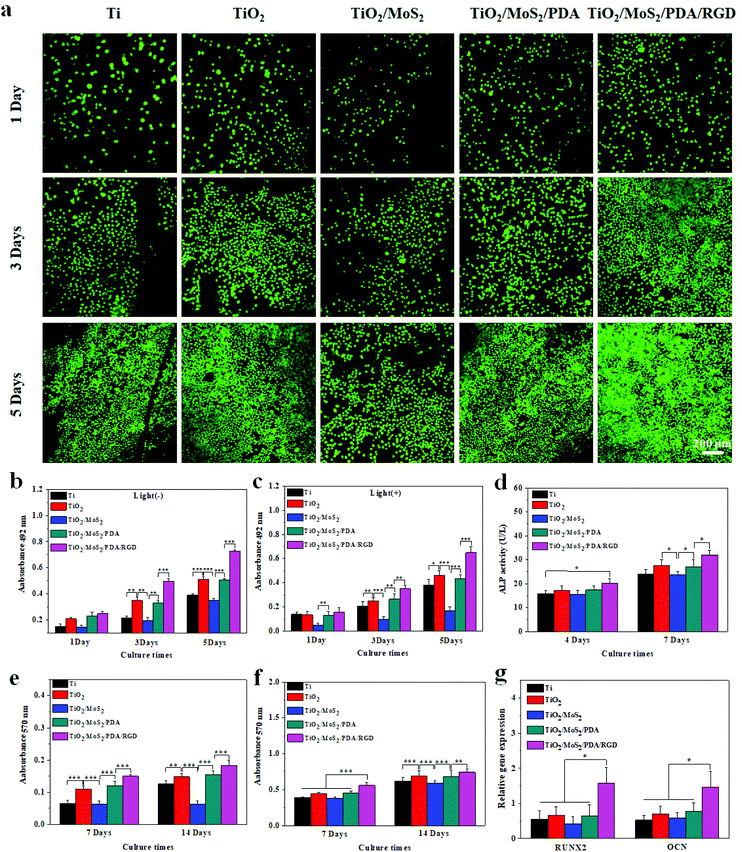
According to the above analysis, the possible antibacterial mechanism is proposed. Firstly hyperthermia induced by dual light irradiation accelerates GSH oxidation, destroys the inherent balance of the bacteria's protective environment, and in combination with ROS increases the cell membrane permeability.20,23,24 ROS more easily permeate into the bacterial cell wall to destroy intracellular proteins and interfere with the bacterial cell membrane leading to swift bacterial death.
3.4. Biological response of osteoblasts
The live/dead staining fluorescence images of the osteoblasts cultured on the samples for 1, 3, and 5 days are shown in Fig. 6a. Only several dead cells are observed from TiO2/MoS2 after incubating for 1 day and no reddish dead cells be found after further culturing for 3 and 5 days, suggesting that all the samples can support osteoblast growth without appreciable cytotoxicity. TiO2/MoS2 exhibits relatively lower cell viability than TiO2, TiO2/MoS2/PDA, and TiO2/MoS2/PDA/RGD throughout the incubation periods. The cytotoxicity is also assessed by the MTT assay and the results are consistent with staining fluorescence. The cell viability of TiO2/MoS2 is relatively low and almost the same as that of Ti. TiO2 improves proliferation of osteoblasts due to the nanorod structure35 and after depositing PDA, the cell viability of TiO2/MoS2/PDA increases obviously and is basically the same as that of TiO2, suggesting that PDA improves the biocompatibility of TiO2/MoS2. In particular, introduction of RGD increases the cell viability of TiO2/MoS2/PDA/RGD as well as proliferation of osteoblasts.51–55 At the same time, to determine the influence of dual light sources on cell proliferation, the MTT assay was performed with light irradiation (Fig. 6c). The cell viability of osteoblasts on Ti is basically the same as that of without light irradiation, indicating the insignificant negative influence on osteoblasts with light. However, as for TiO2, TiO2/MoS2, TiO2/MoS2/PDA, and TiO2/MoS2/PDA/RGD, the cell viability after light irradiation decreased mildly compared to the nonlight groups, indicating that PTT and PDT damaged the cells to a certain degree. Fortunately, after incubation for 3 and 5 days, the cultured cells recovered their ability, suggesting that the adverse effect of light irradiation is temporary, and the cells can become normal over time due to the excellent biocompatibility of the samples.The ALP activity of Ti, TiO2, TiO2/MoS2, TiO2/MoS2/PDA, and TiO2/MoS2/PDA/RGD is measured to investigate osteogenic differentiation after 4 and 7 days (Fig. 6c). The ALP activity of all the samples increases gradually with time. TiO2 has a higher ALP activity than Ti due to the nanorod structure,35 but the ALP activity of TiO2/MoS2 is similar to that of Ti. After coating with PDA and RGD, the ALP activity increases again. This is because RGD promotes cell attachment and integration with surrounding tissues to facilitate cell attachment,51–55 and the maximum specific ALP activity is observed from TiO2/MoS2/PDA/RGD after osteogenic differentiation for 7 days.
Osteoblastic differentiation is further assessed by collagen secretion and ECM mineralization. The quantitative results after collagen deposition for 7 days and 14 days are shown in Fig. 6d. Compared to Ti, TiO2 promotes secretion of collagen due to the nanorod structure. Although TiO2/MoS2 shows collagen synthesis compared to TiO2, the collagen amount on TiO2/MoS2/PDA is higher than that on TiO2 because of the benefits of PDA to osteogenic differentiation. RGD also enhances osteogenic differentiation and the largest amount of collagen deposition is observed from TiO2/MoS2/PDA/RGD. As shown in Fig. 6e, ECM mineralization on TiO2 is also enhanced compared to Ti. After culturing for 7 days, the mineralized nodules produced by the osteoblasts on TiO2/MoS2 are basically the same as those on Ti and there is no difference after culturing for 14 days and 7 days. Similarly, both PDA and RGD enhance ECM mineralization and TiO2/MoS2/PDA/RGD shows the highest degree of mineralization.
The RT-QPCR analysis on the 5th day is shown in Fig. 6f and g. Compared to pure Ti, TiO2 and TiO2/MoS2/PDA have no obvious effect on the expression of runt-related transcription factor 2 (RUNX2) and osteocalcin (OCN) genes, while TiO2/MoS2/PDA/RGD promotes the expression of RUNX2 and OCN genes due to promotion of RGD on the bone differentiation. The results further verify that TiO2/MoS2/PDA/RGD regulates osteogenic differentiation and improves new bone formation by enhancing the gene expressions of RUNX2 and OCN.
The biocompatibility of the samples with endothelial cells is evaluated. All the samples exhibit excellent biocompatibility and moreover, NRs do not promote endothelial cell growth may be due to the different sensitivity of different cells to the surface morphology (Fig. S9†).
3.5. In vivo antibacterial assay
To evaluate the antibacterial properties of TiO2/MoS2/PDA/RGD in vivo, a rat subcutaneous S. aureus infection model is adopted. In addition to Ti, TiO2/MoS2 is also used as a control to investigate the toxicity of MoS2in vivo. After the operation site is irradiated for 10 min by dual light sources, the temperature of TiO2/MoS2 is the highest reaching 50.2 °C and remains within a reasonable temperature range (Fig. S10†).23 To observe bacterial infection of the soft tissue around the wound, the residual bacteria are evaluated by Giemsa staining after culturing for 2 days and the histomaphological change of the tissues is assessed by H&E staining after culturing for 14 days. As shown in Fig. 7, a lot of bacteria (marked by red arrow) are found from the slices of Giemsa staining of Ti. As for TiO2/MoS2 and TiO2/MoS2/PDA/RGD, only a small amount of bacteria can be observed due to the excellent antibacterial activity. Numerous immune cells are found from the slices of H&E staining of Ti, while the inflammatory response is much less for TiO2/MoS2 and TiO2/MoS2/PDA/RGD. The results indicate that MoS2 modified TiO2 NAs possess excellent antibacterial ability in vivo because of the synergetic action of PDT and PTT and exploitation of ROS and hyperthermia. The tissues around Ti, TiO2/MoS2 and TiO2/MoS2/PDA/RGD are not damaged by H&E staining, suggesting that ROS and hyperthermia produced by dual light sources do not destroy the tissues after 10 min.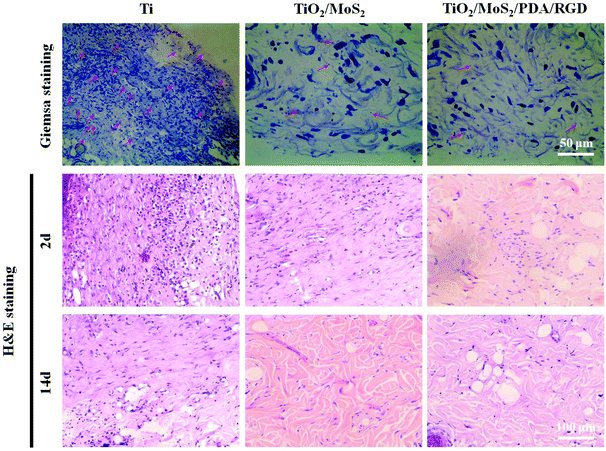 | ||
| Fig. 7 H&E (after 14 days) and Giemsa staining (after 2 days) images showing the tissue infection degree of Ti, TiO2/MoS2, and TiO2/MoS2/PDA/RGD. | ||
To verify the safety of the implant in vivo, H&E staining is carried out on the main organ sections after culturing for 14 days. As shown in Fig. 8, large amounts of red blood cells are found from the kidney and heart of the Ti group due to the sepsis caused by serious S. aureus infection and there is a lot of foam blood in the alveoli. However, no appreciable abnormality or damage of the major organs is observed from the groups of TiO2/MoS2 and TiO2/MoS2/PDA/RGD, indicating that the side effects on rats are negligible during the antibacterial treatment. In addition, treatment with TiO2/MoS2 does not produce adverse reactions proving that the strategy is safe.
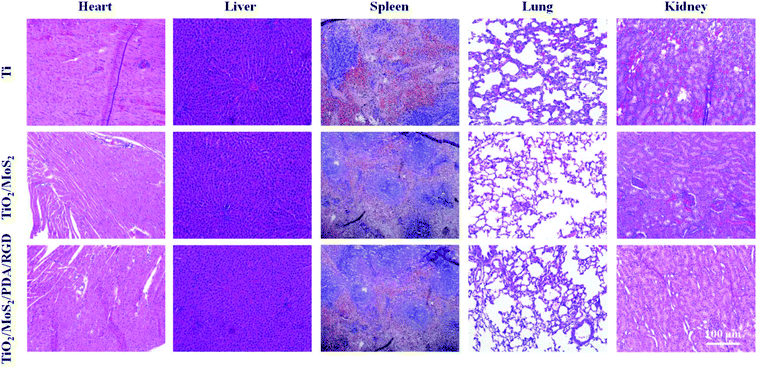 | ||
| Fig. 8 Pathological study of the cytotoxic effect caused by Ti, TiO2/MoS2, and TiO2/MoS2/PDA/RGD on the major organs (heart, liver, spleen, lungs, and kidneys) after treatment for 14 days. | ||
4. Conclusion
Bio-functionalized TiO2/MoS2/PDA/RGD NAs are prepared on Ti to prevent bacterial infection and improve the osteogenic properties. The NAs have excellent antibacterial activity both in vitro and in vivo upon irradiation by 660 nm visible light and 808 nm NIR light. The antibacterial effects stem from the synergistic effects of PDA and PTA. Both 660 nm and 808 nm light sources trigger the MoS2-doped NAs to generate ROS and hyperthermia and upon dual light irradiation, almost all the bacteria are killed and the biofilm is eradicated within 10 min. The nanorod structure contributes to the antibacterial ability as well. The cell experiments indicate that TiO2/MoS2/PDA/RGD promotes proliferation and differentiation of osteoblasts and the strategy and materials have large potential in the noninvasive treatment of post-implantation infection.Conflicts of interest
There are no conflicts to declare.Acknowledgements
This work was supported by the National Natural Science Foundation of China (31700834), Major Projects in Research and Development of Shanxi (Projects of International Cooperation, 201803D421090) and Science Foundation of Jiangsu Province Special Equipment Safety Supervision Inspection Institute (KJ(Y)2017014), Fund for Shanxi “1331 Project” Key Innovative Research Team (PY201809), and Hong Kong Research Grants Council (RGC) General Research Funds (GRF) (CityU 11205617).References
- S. Wu, X. Liu, K. W. Yeung, C. Liu and X. Yang, Mater. Sci. Eng., R, 2014, 80, 1–36 CrossRef
.
- M. Geetha, A. K. Singh, R. Asokamani and A. K. Gogia, Prog. Mater. Sci., 2009, 54, 397–425 CrossRef CAS
.
- X. Wang, S. Xu, S. Zhou, W. Xu, M. Leary, P. Choong, M. Qian, M. Brandt and Y. M. Xie, Biomaterials, 2016, 83, 127–141 CrossRef CAS
.
- K. G. Neoh, X. Hu, D. Zheng and E. T. Kang, Biomaterials, 2012, 33, 2813–2822 CrossRef CAS
.
- Z. Zhao, R. Yan, X. Yi, J. Li, J. Rao, Z. Guo, Y. Yang, W. Li, Y.-Q. Li and C. Chen, ACS Nano, 2017, 11, 4428–4438 CrossRef CAS
.
- J. Min, K. Y. Choi, E. C. Dreaden, R. F. Padera, R. D. Braatz, M. Spector and P. T. Hammond, ACS Nano, 2016, 10, 4441–4450 CrossRef CAS
.
- A. Jaggessar, H. Shahali, A. Mathew and P. K. Yarlagadda, J. Nanobiotechnol., 2017, 15, 64 CrossRef
.
- T. Zhou, Y. Zhu, X. Li, X. Liu, K. W. Yeung, S. Wu, X. Wang, Z. Cui, X. Yang and P. K. Chu, Prog. Mater. Sci., 2016, 83, 191–235 CrossRef CAS
.
- Y. Liu, H. J. Busscher, B. Zhao, Y. Li, Z. Zhang, H. C. van der Mei, Y. Ren and L. Shi, ACS Nano, 2016, 10, 4779–4789 CrossRef CAS
.
- Z. Xu, M. Li, X. Li, X. Liu, F. Ma, S. Wu, K. Yeung, Y. Han and P. K. Chu, ACS Appl. Mater. Interfaces, 2016, 8, 16584–16594 CrossRef CAS
.
- C. Kaweeteerawat, C. H. Chang, K. R. Roy, R. Liu, R. Li, D. Toso, H. Fischer, A. Ivask, Z. Ji and J. I. Zink, ACS Nano, 2015, 9, 7215–7225 CrossRef CAS
.
- J. Li, L. Tan, X. Liu, Z. Cui, X. Yang, K. W. K. Yeung, P. K. Chu and S. Wu, ACS Nano, 2017, 11, 11250–11263 CrossRef CAS
.
- P. Zhu, Z. Weng, X. Li, X. Liu, S. Wu, K. Yeung, X. Wang, Z. Cui, X. Yang and P. K. Chu, Adv. Mater. Interfaces, 2016, 3, 1500494 CrossRef
.
- X. Huang, X. Chen, Q. Chen, Q. Yu, D. Sun and J. Liu, Acta Biomater., 2016, 30, 397–407 CrossRef CAS
.
- P. AshaRani, G. Low Kah Mun, M. P. Hande and S. Valiyaveettil, ACS Nano, 2008, 3, 279–290 CrossRef
.
- S. Kittler, C. Greulich, J. Diendorf, M. Koller and M. Epple, Chem. Mater., 2010, 22, 4548–4554 CrossRef CAS
.
- L. Guo, I. Panderi, D. D. Yan, K. Szulak, Y. Li, Y.-T. Chen, H. Ma, D. B. Niesen, N. Seeram and A. Ahmed, ACS Nano, 2013, 7, 8780–8793 CrossRef CAS
.
- L. Wei, J. Wang, A. Chen, J. Liu, X. Feng and L. Shao, Int. J. Nanomed., 2017, 12, 1891 CrossRef CAS
.
- M. Yin, Z. Li, E. Ju, Z. Wang, K. Dong, J. Ren and X. Qu, Chem. Commun., 2014, 50, 10488–10490 RSC
.
- W. Yin, J. Yu, F. Lv, L. Yan, L. R. Zheng, Z. Gu and Y. Zhao, ACS Nano, 2016, 10, 11000–11011 CrossRef CAS
.
- Z. Zhen, W. Tang, C. Guo, H. Chen, X. Lin, G. Liu, B. Fei, X. Chen, B. Xu and J. Xie, ACS Nano, 2013, 7, 6988–6996 CrossRef CAS
.
- B. Zavan, L. Ferroni, C. Gardin, S. Sivolella, A. Piattelli and E. Mijiritsky, Materials, 2017, 10, 1052 CrossRef
.
- L. Tan, J. Li, X. Liu, Z. Cui, X. Yang, S. Zhu, Z. Li, X. Yuan, Y. Zheng and K. W. Yeung, Adv. Mater., 2018, 30, 1801808 CrossRef
.
- M. Li, L. Li, K. Su, X. Liu, T. Zhang, Y. Liang, D. Jing, X. Yang, D. Zheng and Z. Cui, Adv. Sci., 2019, 1900599 CrossRef
.
- G. Pan, S. Sun, W. Zhang, R. Zhao, W. Cui, F. He, L. Huang, S.-H. Lee, K. J. Shea and Q. Shi, J. Am. Chem. Soc., 2016, 138, 15078–15086 CrossRef CAS
.
- H. Cheng, K. Yue, M. Kazemzadeh-Narbat, Y. Liu, A. Khalilpour, B. Li, Y. S. Zhang, N. Annabi and A. Khademhosseini, ACS Appl. Mater. Interfaces, 2017, 9, 11428–11439 CrossRef CAS
.
- J. Shin, J. H. Cho, Y. Jin, K. Yang, J. S. Lee, H. J. Park, H. S. Han, J. Lee, H. Jeon and H. Shin, Small, 2016, 12, 6266–6278 CrossRef CAS
.
- S. J. Lee, D. Lee, T. R. Yoon, H. K. Kim, H. H. Jo, J. S. Park, J. H. Lee, W. D. Kim, I. K. Kwon and S. A. Park, Acta Biomater., 2016, 40, 182–191 CrossRef CAS
.
- T. A. Kandiel, A. Feldhoff, L. Robben, R. Dillert and D. W. Bahnemann, Chem. Mater., 2010, 22, 2050–2060 CrossRef CAS
.
- T. E. Thingholm, T. J. Jørgensen, O. N. Jensen and M. R. Larsen, Highly selective enrichment of phosphorylated peptides using titanium dioxide, Nat. Protoc., 2006, 1(4), 1929–1935 CrossRef CAS
.
- K. S. Brammer, C. Choi, C. J. Frandsen, S. Oh, G. Johnston and S. Jin, Acta Biomater., 2011, 7, 2697–2703 CrossRef CAS
.
- X. Liu and S. Wang, Three-dimensional nano-biointerface as a new platform for guiding cell fate, Chem. Soc. Rev., 2014, 43(8), 2385–2401 RSC
.
- L. Richert, F. Vetrone, J. H. Yi, S. F. Zalzal, J. D. Wuest, F. Rosei and A. Nanci, Surface nanopatterning to control cell growth, Adv. Mater., 2008, 20(8), 1488–1492 CrossRef CAS
.
- R. A. Gittens, R. Olivares-Navarrete, Z. Schwartz and B. D. Boyan, Acta Biomater., 2014, 10, 3363–3371 CrossRef
.
- K. Cheng, M. Yu, Y. Liu, F. Ge, J. Lin, W. Weng and H. Wang, Colloids Surf., B, 2015, 126, 387–393 CrossRef CAS PubMed
.
- L. Zhang, V. M. Menendez-Flores, N. Murakami and T. Ohno, Appl. Surf. Sci., 2012, 258, 5803–5809 CrossRef CAS
.
- C. Ge, M. Lu, W. Zhang and B. T. Cunningham, Appl. Phys. Lett., 2010, 96, 163702 CrossRef
.
- J. Shi, R. Tong, X. Zhou, Y. Gong, Z. Zhang, Q. Ji, Y. Zhang, Q. Fang, L. Gu and X. Wang, Adv. Mater., 2016, 28, 10664–10672 CrossRef CAS
.
- T. Stephenson, Z. Li, B. Olsen and D. Mitlin, Energy Environ. Sci., 2014, 7, 209–231 RSC
.
- T. Liu, C. Wang, X. Gu, H. Gong, L. Cheng, X. Shi, L. Feng, B. Sun and Z. Liu, Adv. Mater., 2014, 26, 3433–3440 CrossRef CAS
.
- X. Yang, J. Li, T. Liang, C. Ma, Y. Zhang, H. Chen, N. Hanagata, H. Su and M. Xu, Nanoscale, 2014, 6, 10126–10133 RSC
.
- W. Zhang, S. Shi, Y. Wang, S. Yu, W. Zhu, X. Zhang, D. Zhang, B. Yang, X. Wang and J. Wang, Nanoscale, 2016, 8, 11642–11648 RSC
.
- Q. He, Z. Zeng, Z. Yin, H. Li, S. Wu, X. Huang and H. Zhang, Small, 2012, 8, 2994–2999 CrossRef CAS
.
- T. Umebayashi, T. Yamaki, H. Itoh and K. Asai, Appl. Phys. Lett., 2002, 81, 454–456 CrossRef CAS
.
- X. Chen and S. S. Mao, Chem. Rev., 2007, 107, 2891–2959 CrossRef CAS
.
- L. Yang, X. Zheng, M. Liu, S. Luo, Y. Luo and G. Li, J. Hazard. Mater., 2017, 329, 230–240 CrossRef CAS PubMed
.
- L. Guo, Z. Yang, K. Marcus, Z. Li, B. Luo, L. Zhou, X. Wang, Y. Du and Y. Yang, Energy Environ. Sci., 2018, 11, 106–114 RSC
.
- H. Lee, S. M. Dellatore, W. M. Miller and P. B. Messersmith, Science, 2007, 318, 426–430 CrossRef CAS
.
- Y. Liu, K. Ai and L. Lu, Chem. Rev., 2014, 114, 5057–5115 CrossRef CAS
.
- M. Lin, H. Huang, Y. Liu, C. Liang, S. Fei, X. Chen and C. Ni, Nanotechnology, 2013, 24, 065501 CrossRef
.
- W. Lee, J. U. Lee, B. M. Jung, J.-H. Byun, J.-W. Yi, S.-B. Lee and B.-S. Kim, Carbon, 2013, 65, 296–304 CrossRef CAS
.
- D. S. Hwang, S. B. Sim and H. J. Cha, Biomaterials, 2007, 28, 4039–4046 CrossRef CAS
.
- J. A. Burdick and K. S. Anseth, Biomaterials, 2002, 23, 4315–4323 CrossRef CAS
.
- D. Ferris, G. Moodie, P. Dimond, C. Giorani, M. Ehrlich and R. Valentini, Biomaterials, 1999, 20, 2323–2331 CrossRef CAS
.
- A. V. Taubenberger, M. A. Woodruff, H. Bai, D. J. Muller and D. W. Hutmacher, Biomaterials, 2010, 31, 2827–2835 CrossRef CAS
.
- H. Liao, A.-S. Andersson, D. Sutherland, S. Petronis, B. Kasemo and P. Thomsen, Biomaterials, 2003, 24, 649–654 CrossRef CAS
.
- X. Feng, L. Feng, M. Jin, J. Zhai, L. Jiang and D. Zhu, J. Am. Chem. Soc., 2004, 126, 62–63 CrossRef CAS
.
- B. Luan and R. Zhou, Appl. Phys. Lett., 2016, 108, 131601 CrossRef
.
- S. Sousa, M. Lamghari, P. Sampaio, P. Moradas-Ferreira and M. Barbosa, J. Biomed. Mater. Res., Part A, 2008, 84, 281–290 CrossRef CAS
.
- Z. Feng, X. Liu, L. Tan, Z. Cui, X. Yang, Z. Li, Y. Zheng, K. W. K. Yeung and S. Wu, Small, 2018, 14, 1704347 CrossRef
.
- W. Jiang, M. Pelaez, D. D. Dionysiou, M. H. Entezari, D. Tsoutsou and K. O'Shea, Chem. Eng. J., 2013, 222, 527–533 CrossRef CAS
.
- Q. Jiang, H. G. Derami, D. Ghim, S. Cao, Y.-S. Jun and S. Singamaneni, J. Mater. Chem. A, 2017, 5, 18397–18402 RSC
.
- Y. Liu, K. Ai, J. Liu, M. Deng, Y. He and L. Lu, Adv. Mater., 2013, 25, 1353–1359 CrossRef CAS
.
- C. Wang, J. Bai, Y. Liu, X. Jia and X. Jiang, ACS Biomater. Sci. Eng., 2016, 2, 2011–2017 CrossRef CAS
.
Footnote |
| † Electronic supplementary information (ESI) available. See DOI: 10.1039/c9bm01507h |
| This journal is © The Royal Society of Chemistry 2020 |

