
 Open Access Article
 This Open Access Article is licensed under a
 Creative Commons Attribution 3.0 Unported Licence
Correction: The sensitive detection of single-cell secreted lactic acid for glycolytic inhibitor screening with a microdroplet biosensor
Xuyue
Chen
a,
Rui
Shen
a,
Sidi
Liu
a,
Xiang
Xiao
a,
Jun
Yan
a,
Yiqiu
Zhang
a,
Zhongyun
Jiang
a,
Baoqing
Nie
b and
Jian
Liu
*a
aInstitute of Functional Nano and Soft Materials (FUNSOM), Jiangsu Key Laboratory for Carbon-Based Functional Materials and Devices, Soochow University, Suzhou, Jiangsu Province 215123, China. E-mail: jliu@suda.edu.cn
bSchool of Electronic and Information Engineering, Soochow University, Suzhou, Jiangsu Province 215006, China
First published on 11th August 2020
Abstract
Correction for ‘The sensitive detection of single-cell secreted lactic acid for glycolytic inhibitor screening with a microdroplet biosensor’ by Xuyue Chen et al., Anal. Methods, 2020, 12, 3250–3259, DOI: 10.1039/D0AY00633E.
Fig. S5 and S7 in the ESI for this article contained images that were mistakenly duplicated from Fig. 3. The corrected versions of Fig. S5 and S7 are shown below. Fig. 3 is correct in its current form. These changes do not impact on the results or conclusions of the article.
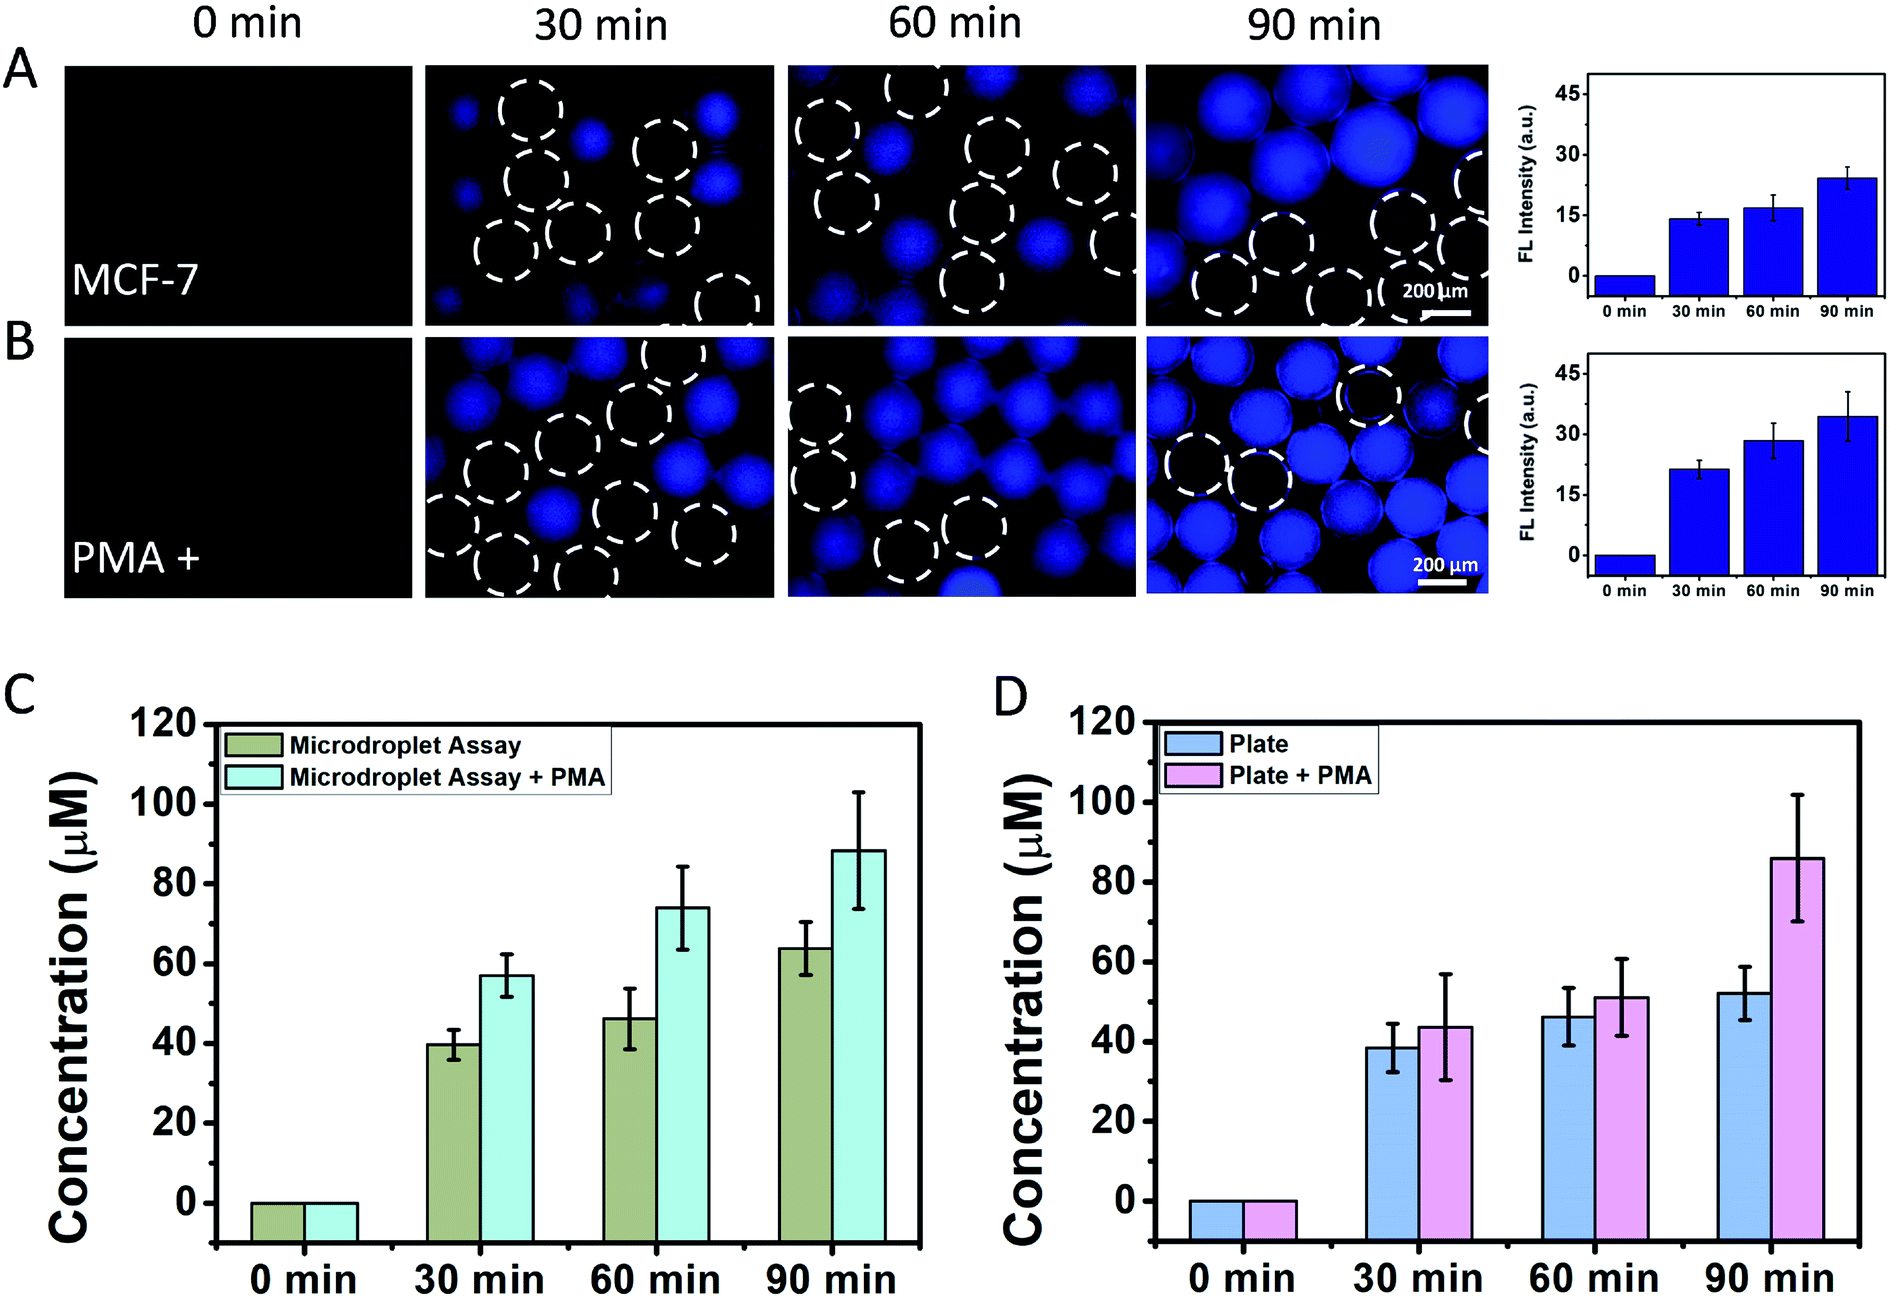
Fig. S5 Fluorescent measurement of droplets encapsulating single MCF-7 cells at the time points of 0, 30, 60 and 90 min. (A and B) Fluorescent images and intensity analysis of MCF-7 cells without or with PMA stimulation. Ex/Em: 360 nm/490 nm. The white circles: the empty microdroplets. Scale bar: 200 μm. Error bar: standard deviation from different cubes (n = 3). (C) Lactic acid secretion of a single MCF-7 cell using the droplet assay. Error bar: standard deviation from different cubes (n = 3). (D) The averaged lactic acid concentrations secreted by MCF-7 divided by the cell numbers in the microplate (2.4 × 10⁵ cells per well) using the commercial kit. Error bar: standard deviation from different experiments (n = 3).
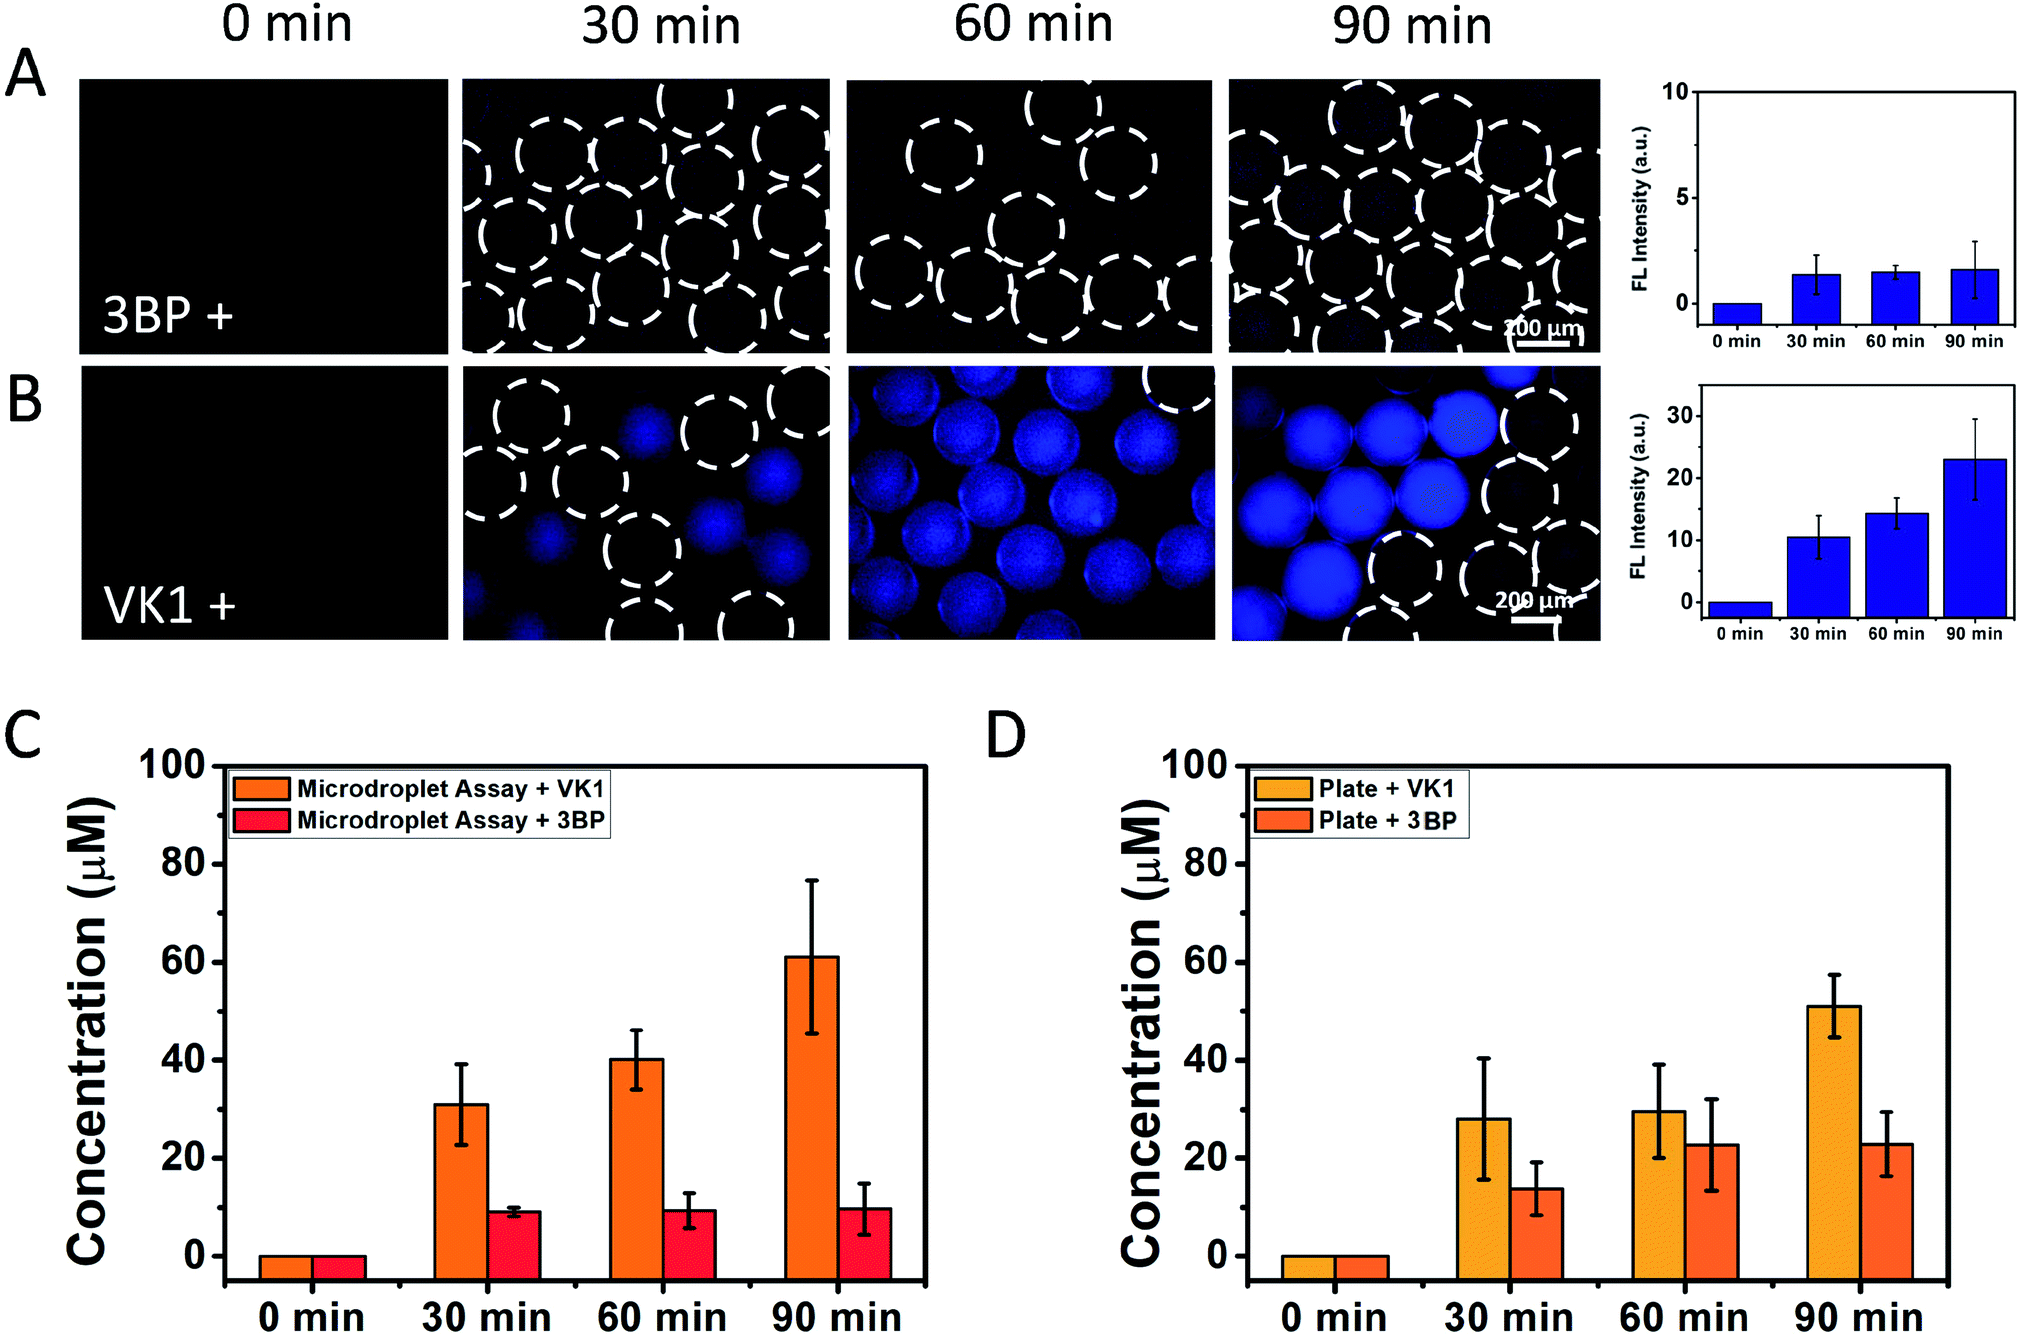
Fig. S7 Fluorescent measurement of droplets encapsulating single MCF-7 cells at the different time points for glycolytic inhibitor screening. (A and B) Fluorescent images and intensity analysis of MCF-7 cells with incubation of 3BP and VK1. Ex/Em: 360 nm/490 nm. The white circles: the microdroplets with fluorescence below the threshold, either cellular LA scretion inhibited or no cell encapsulation. Scale bar: 200 μm. Error bar: standard deviation from different cubes (n = 3). (C) Lactic acid secretion of a single MCF-7 cell inhibited by 3BP and VK1 using the droplet assay. Error bar: standard deviation from different cubes (n = 3). (D) The averaged lactic acid concentrations secreted by MCF-7 divided by the cell numbers in the microplate (2.4 × 10⁵ cells per well) using the commercial kit, under the inhibition of inhibited by 3BP and VK1. Error bar: standard deviation from different experiments (n = 3).
The Royal Society of Chemistry apologises for these errors and any consequent inconvenience to authors and readers.
| This journal is © The Royal Society of Chemistry 2020 |