
Robotic sheath-flow probe electrospray ionization/mass spectrometry (sfPESI/MS): development of a touch sensor for samples in a multiwell plastic plate†
Kenzo
Hiraoka
 *a,
Osamu
Ariyada
b,
Ryo
Sekine
c,
Satoshi
Ninomiya
c,
Dilshadbek T.
Usmanov
ad,
Hiroshi
Wada
e and
Hiroshi
Nonami
f
*a,
Osamu
Ariyada
b,
Ryo
Sekine
c,
Satoshi
Ninomiya
c,
Dilshadbek T.
Usmanov
ad,
Hiroshi
Wada
e and
Hiroshi
Nonami
f
aClean Energy Research Center, University of Yamanashi, 4-3-11, Takeda, Kofu, Yamanashi 400-8511, Japan. E-mail: hiraoka@yamanashi.ac.jp
bARIOS INC., 3-2-20 Musashino, Akishima, Tokyo 196-0021, Japan
cGraduate Faculty of Interdisciplinary Research, University of Yamanashi, 4-3-11, Takeda, Kofu 400-8511, Japan
dInstitute of Ion-Plasma and Laser Technologies, Durmon Yoli Street 33, Tashkent, 100125, Uzbekistan
eKyushu Okinawa Agricultural Research Center, National Agriculture and Food Research Organization, 496 Izumi, Chikugo, Fukuoka 833-0041, Japan
fPlant Biophysics/Biochemistry Research Laboratory, Faculty of Agriculture, Ehime University, Matsuyama 790-8566, Japan
First published on 23rd May 2020
Abstract
In the previous work, sheath-flow probe electrospray ionization (sfPESI) equipped with a touch sensor was developed for conducting samples. In this work, a capacitiance-sensitive touch sensor that can be applicable to samples prepared in a nonconducting plastic multiwell plate was developed. The radiofrequency with 5 kHz and 4.5 Vpp was applied to the metal substrate on which the plastic plate was placed. The probe tip stopped at the position where it touched the surface of the liquid solution prepared in the plastic multiwell plate by detecting the displacement current flowing through the capacitance of the circuit. By coupling a nondisposable sfPESI probe with a table-top 3-axis robot, consecutive analysis of peptides, proteins, drugs, and real samples was performed. The carry-over by the consecutive analyses was suppressed to minimal by cleansing the probe tip using the solvent of water/methanol/acetonitrile (1/1/1).
Introduction
In the last three decades, a number of mass spectrometric techniques for surface analyses based on electrospray have been developed, e.g., liquid extraction surface analysis mass spectrometry (LESA-MS),1–4 desorption electrospray ionization (DESI),5 nanospray desorption electrospray ionization (nano-DESI),6 scanning probe electrospray ionization (SPESI),7 solid probe-assisted nanoelectrospray ionization (SPA-nanoESI),8 single-probe ionization,9 and ballpoint electrospray ionization.10 These methods used the continuous flow of the solvent for sampling and electrospray.In 2007, a discontinuous sampling and electrospray ionization method, probe electrospray ionization (PESI), was developed.11 PESI is free from clogging problems and is suitable for direct analysis of various wet biological samples with high salt concentration.12,13 As modified versions of PESI, dipping PESI (dPESI),14 sheath-flow PESI (sfPESI)15 and adjustable sfPESI (ad-sfPESI)16 were developed. The great advantage of the discontinuous sampling/electrospray for PESI and its related techniques is that the suppression effect is largely moderated because of the occurrence of sequential and exhaustive electrospray.13–17 The difference between the PESI-based techniques and the techniques of direct sampling probe insertion into the solvent-prefilled capillary8,18 is that the suppression effect is difficult to avoid in the latter techniques because the analyte solution flows continuously through the electrospray capillary.17
All the methods described above are based on the rather simple principle, namely, analytes are extracted by making the probe tip close to or just touch directly the sample surface. Thus, if these methods are coupled with robotic system, time-consuming experimental operation would be greatly reduced. In this respect, the introduction of robotic system in analytical laboratory is emerging as a new trend in mass spectrometry society. Urban and coworkers developed the robotics-assisted mass spectrometry assay platform.19–21 The proposed platform incorporated a robotic arm for handling sample vials delivered to the laboratory, and several auxiliary devices which facilitated and secured the analysis process. The sample solution was automatically aspirated by Venturi pump and nebulized samples were analyzed by pneumatic-assisted electrospray ionization.
Fernandez and coworkers22 developed a method for the systematic 3-dimensional (3D) surface analysis of native, irregularly-shaped or curved samples by coupling robotic probe surface sampling with direct analysis in real time (DART23). The position sampled by the robotic probe was selected by means of a joystick control, or by using a 3D camera for accurate sample coordinate determination. The robotic arm manoeuvred an acupuncture needle to stub the targeted position on the sample. Subsequently, the chemical distribution maps were constructed based on the ion signal intensities. Further, they developed robotic surface analysis mass spectrometry (RoSA-MS) for direct surface sampling of 3D objects.24 In RoSA-MS, a sampling probe was attached to a robotic arm that had 360° rotation through 6 individual joints. A 3D laser scanner, also attached to the robotic arm, generated a digital map of the bulky, non-planar sample surface that was used to direct the probe to specific (x, y, z) location. The sampling probe consisted of a spring-loaded needle that briefly contacted the object surface, collecting trace amount of materials. The probe was then directed at an open port liquid sampling interface coupled to the electrospray ion source of a mass spectrometer. Materials on the probe tip were dissolved by the solvent flow in the liquid interface coupled to the electrospray ion source. Materials on the surface of bulky, non-planar objects could thus be probed to produce chemical maps at the molecular level.
If a touch sensor is equipped directly to the sampling probe itself, the procedure for the determination of the target position of the sample would be largely simplified. Based on this idea, we have developed a touch sensor for sfPESI applicable to conducting samples.25 Upon making contact with the sample, the probe stopped by detecting the direct current flowing through the circuit and analytes on the sample surface were extracted in the solvent preloaded in the plastic capillary. By lifting up the probe to the default position in front of the inlet of the mass spectrometer, a high voltage (HV) was applied to the needle and an electrospray ionization mass spectrum of the sample was obtained. Limit of detection for sfPESI was estimated to be of the order of picograms for morphine and rhodamine B.15 Because the touch sensor detected the alternating direct current flowing through the circuit, the samples were limited only to the conducting materials. In this report, a touch sensor for sfPESI applicable to liquid solutions prepared in a nonconducting multiwell plastic plate was developed. By coupling the touch sensor with a table-top 3-axis robot, the consecutive analysis of samples prepared in the multiwell plate using a non-disposable probe was performed.
Experimental
Chemicals and samples
Water was purified by Simplicity UV (Millipore, Bedford, MA, USA). Methanol and acetonitrile were purchased from Kanto Kagaku (HPLC grade, Tokyo, Japan). Cytochrome c, gramicidin S, and ubiquitin were purchased from Sigma-Aldrich (St. Louis, MO. USA). Cocaine (C17H21NO4), morphine (C17H19NO3), amphetamine (C9H13N), and methamphetamine (C10H15N) were purchased from Shionogi Pharmaceuticals (Osaka, Japan). Vegetable juice (Kagome Co., Ltd.), orange juice (Seven Premium, Seven-Eleven Japan, Co., Ltd.), mandarin fruit (Citrus unshiu), and refreshing drink (Kyokyo-Daha, Tokiwa Pharmaceutical, Co. Ltd.) were purchased from a local supermarket.Mass spectrometer
All measurements were made using an Orbitrap mass spectrometer (Exactive Plus, Thermo Fisher Scientific, Bremen, Germany). The settings for the Orbitrap were as follows. The temperature of the ion transfer tube: 150 °C, the S lens radio frequency (RF) level: 50, the maximum ion injection time: 100 ms, and the scanning mode for acquisition of the mass spectra: a resolution of 35![[thin space (1/6-em)]](https://www.rsc.org/images/entities/char_2009.gif) 000–140000.
000–140000.
Robotic mass spectrometry system
Fig. 1(a) shows the schematic diagram of the robotic sampling and ionization system. A homemade sfPESI probe (described later) was fixed to the shaft of a programmable linear actuator (SCN5-010-050-S03, stroke: 50 mm, Dyadic Systems Co., Kanazawa, Japan). A PEEK support arm was connected between the actuator shaft and the sfPESI probe to maintain a proper distance (120 mm). The linear actuator was fixed to an AC servo motor tabletop 3-axis robot (IAI Corp., TTA-C3SH-WA-20-15-15B, stroke: 200 mm in x-axis, 150 mm in y- and z-axes, repetitive position precision: ±5 μm, Shizuoka, Japan) as shown in Fig. 1(b). In the previous study, the number of samples on a 2-axes stage was spatially limited, because one-dimensional linear actuator was used to move the sfPESI probe.25 In this work, it has become possible to handle a large number of samples prepared in a commonly used multiwell plate by manipulating the sfPESI probe three-dimensionally using the table-top 3-axis robot. The liquid sample solutions were filled in the multiwell plate with the meniscus slightly convex to prevent the spillover. By inputting the x–y coordinates of the central positions of the wells in the computer-controlled system, the automated consecutive analysis of samples prepared in the multiwell plate was performed.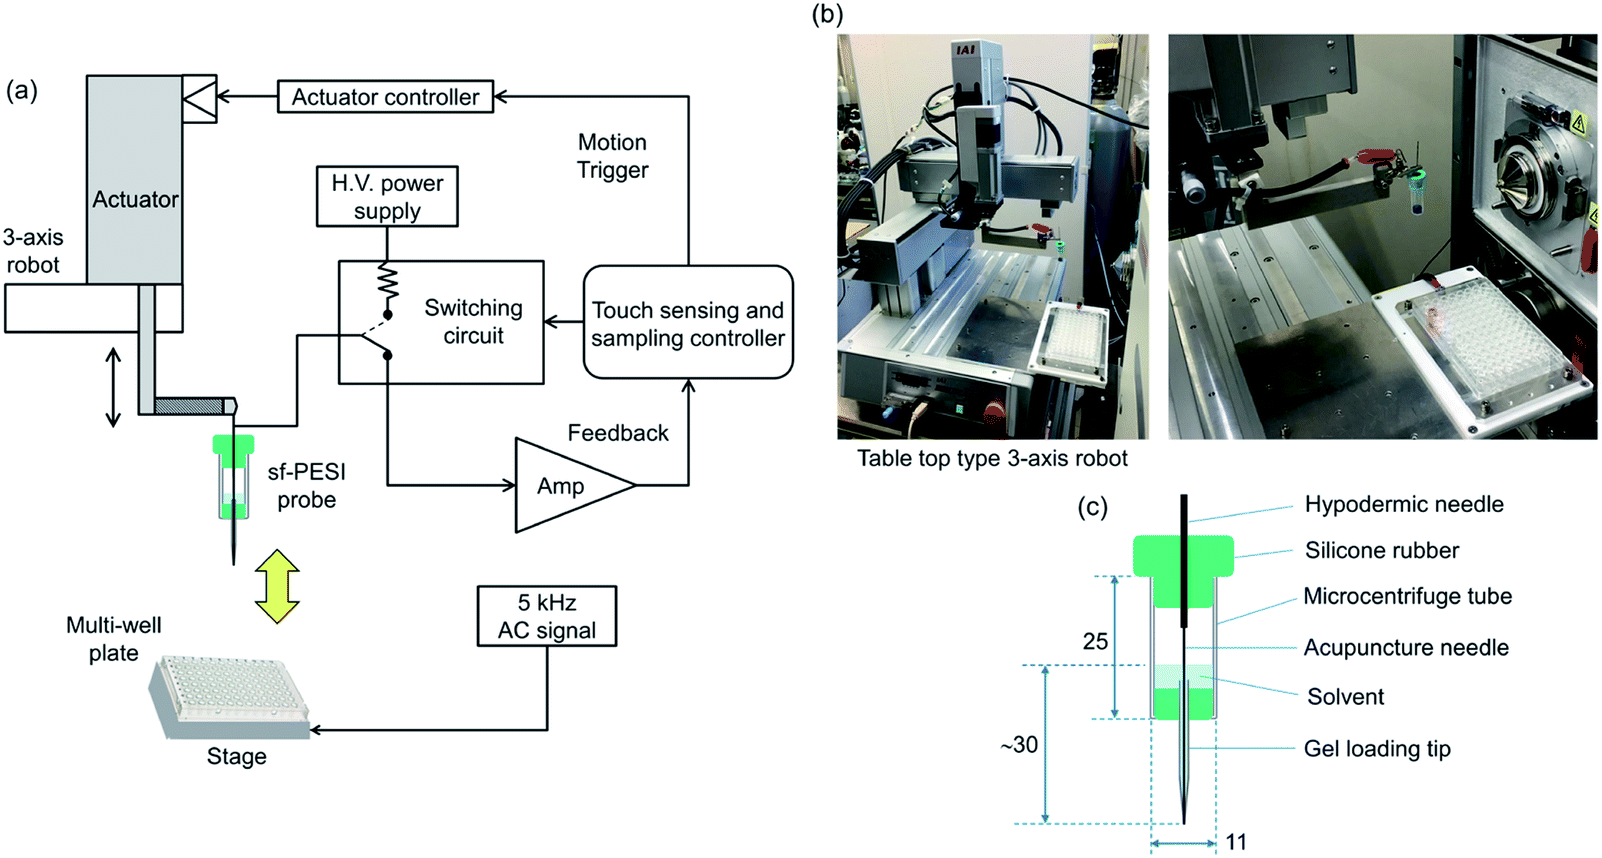 | ||
| Fig. 1 (a) Schematic diagram of the robotic sampling and ionization system equipped with the electric circuit of the touch sensor for liquid samples prepared in the multiwell plastic plate. The radiofrequency of 5 kHz and 4.5 Vpp was applied to the metal stage on which the plastic multiwell plate was placed. (b) Photos of 3-axis robot coupled with the sfPESI probe. (c) Schematic diagram of the homemade sfPESI probe. A centrifuge tube cut in half was used for the liquid reservoir. 1 mL of water/methanol (1/1) solvent was prefilled in the reservoir with the liquid head of ∼30 mm. | ||
A homemade sfPESI probe used for sampling and ionization in this study is shown in Fig. 1(c). A microcentrifuge tube (T330-7LST, Simport, QC, Canada) cut in half was used for the solvent reservoir, and the both ends of the reservoir were sealed by silicone rubber. A stainless steel acupuncture needle (0.12 mm o.d., 700 nm tip diameter, J type No. 02, Seirin, Shizuoka, Japan) connected and extended by a hypodermic needle was inserted to the gel loading tip (GELoader epT.I.P.S. 20 μL, Eppendorf, Hamburg, Germany) with a protrusion length of 0.1 mm from its tip. Water/methanol (1/1) solvent was used for the extraction of samples all through the experiment. About 1 mL solvent was prefilled in the reservoir with the liquid head of ∼30 mm from the tip of the sf-PESI probe. The outer surface of the gel loading tip was coated with a perfluoroalkyl film (FG-50935H-0.5, Fluoro Technology Co., Kasugai, Aichi, Japan) to make the surface hydrophobic. This surface treatment was mandatory to avoid the contamination of the gel loading tip by samples and to generate axial single-cone electrospray.15 The flow rate of the solvent was ∼800 nL min−1 with the continuous application of the HV of 2.4 kV as reported previously.15 With this flow rate, it took about 100 min for the consumption of solvent by 1 mm liquid head change in the reservoir shown in Fig. 1(c). That is, the change of the liquid head was practically negligible during the present experimental operations, i.e., the time of the application of the HV was 5 s in one-sample analysis time of 15−30 s. In our previous sfPESI experiment,15,25 the total volume of the solvent in the gel loading tip was only ∼40 μL and frequent refill of the solvent was necessary. This cumbersome operation was eliminated in the present experiment.
The sampling operation of the sfPESI probe was controlled by the programmable linear actuator. In sampling with minimum contamination, it is very important to precisely control the contact between the probe and samples by the actuator. In this work, a touch sensor for the sfPESI probe that can be applicable to nonconducting samples was developed and it was applied to the liquid samples prepared in a multiwell plastic plate. The outline of the electric circuit of a capacitance-sensitive touch sensor is shown in Fig. 1(a). The capacitance between the probe and the samples prepared in a multiwell plate placed on the metal stage was monitored by the circuit during the sampling motion. The principle of the present method is based on the discontinuous increase in the capacitance between the fine probe tip and the much larger-size sample surface when the probe touches the sample. By detecting the sudden increase in the displacement current flowing through the circuit at the contact point, the programmable linear actuator stops at that position. The radio frequency was applied to the metal stage on which the plastic plate was placed. Optimized frequency and voltage were 5 kHz and 4.5 Vpp, respectively, for the highest sensitivity.
In the sampling operation, the sfPESI probe connected to the actuator moved downward to the position about 1 mm above each liquid surface at a speed of 200 mm s−1. Then the probe moved down at a speed of 0.1 mm s−1 to touch the sample surface. This slow speed of the sfPESI probe minimized the overrun of the probe system by the moment of inertia. When the probe touched the sample surface, the probe stopped there. This position was the starting point for the control of the invasion depth of the probe into the sample surface. The invasion depth of the probe after touching the surface was precisely controlled in steps of 0.1 mm from the contact point at which the invasion depth was recorded as 0.0 mm. In this work, the invasion depth of the probe was set at 0.0 mm to suppress the contamination of the probe tip with the sample. The contact time of the probe tip with the surface was also controlled from 50 ms to several tens of seconds. In all the experiments for liquid samples, the contact time was set at 50 ms, i.e., the needle was lifted up with the speed of 200 mm s−1 just right after the contact of the probe with the sample surface. After sampling, the probe was transported in front of the inlet of the mass spectrometer by the 3-axis robot and a HV was applied to the needle of the probe for the acquisition of mass spectra.
Because the present method needed precise position control of the contact point of the probe tip with the sample surface, small mechanical vibration could affect the reproducibility of the measurements. To avoid vibration arising from the floor, the robot was placed on the vibration isolation table. To examine how sfPESI analysis is reproducible, two consecutive measurements in the same well were made for gramicidin S and rhodamine B. Fig. S1(a) and (b)† show EICs of [(gramicidin S) + 2H]2+ (m/z 571) for 1 × 10⁻⁵ M gramicidin S in water/methanol (1/1) and [(rhodamine B) − Cl]+ (m/z 443) for 2 × 10⁻⁶ M rhodamine B in water/methanol (1/1), respectively. As shown in the figure, satisfactory reproducibility was observed.
Results and discussion
In this work, the non-disposable sfPESI probe was used for the consecutive analysis of liquid samples prepared in a multiwell plate. In such a case, the carry-over effect must be suppressed to minimal. It was found that the surface treatment of the gel loading tip by perfluoroalkyl film was very effective to suppress the carry-over effect.15 Without coating, the rim of the tip was wetted by the sample solution and multiple-cone electrospray jets were generated from the outer edge of the tip. In some cases, liquid climbed up the outer wall of the tip and several tiny electrospray jets were generated from the side wall of the tip. Fig. 2(a) shows the TIC for the sample of 10−5 M cytochrome c in water/methanol (1/1) using an untreated gel loading tip. In this measurement, the probe tip was cleansed twice (shown as blue circles) by the solvent of water/methanol (1/1) prepared in the neighboring well of the 96-well plate. Fig. 2(b) shows the EIC of [cytochrome c + 17H]17+ (m/z 720). Carry-over was observed at the 1st cleansing at 0.73 min. At the second cleansing at 1.29 min, the carry-over was not observed. The appearance of the carry-over at 0.73 min suggested that the rim and outer surface of the tip were contaminated by the sample solution. Fig. 2(c) shows the TIC for the same sample using a probe tip coated by a perfluoroalkyl film. As shown in Fig. 2(d), the carry-over was negligible. It should be noted that the ion intensity of [cytochrome c + 17H]17+ at 0.28 min in Fig. 2(d) (1.07 × 10⁷) is more than one order of magnitude stronger than that at 0.29 min in Fig. 2(b) (6.30 × 10⁵). That is, the probe tip coated by the perfluoroalkyl film gave much stronger analyte ion signals than the uncoated tip. Apparently, the coated probe generated more stable electrospray than the uncoated one as reported previously.15 | ||
| Fig. 2 Total ion chromatogram (TIC) and extracted ion chromatogram (EIC) for [(cytochrome c) + 17H]17+ (m/z 720) for a water/methanol (1/1) solution of 10−5 M cytochrome c and 1% acetic acid. After sampling of the solution by sfPESI, the sfPESI probe tip was cleansed twice by the water/methanol (1/1) solvent. (a) TIC obtained by using an untreated probe tip. (b) EIC for [(cytochrome c) + 17H]17+ obtained by using an untreated probe tip. The carry-over was observed at 0.73 min for the 1st cleansing but not at 1.29 min for the 2nd one. (c) TIC obtained by using a probe tip coated by perfluoroalkyl film. (d) EIC for [(cytochrome c) + 17H]17+ using a probe tip coated by perfluoroalkyl film. The carry-over was not observed at 0.63 min for the 1st cleansing and at 1.14 min for the 2nd cleansing. Protrusion length of the acupuncture needle from the capillary tip: 0.1 mm. The contact time of the probe with the sample and the solvent for cleansing: ∼50 ms, invasion depth of the probe to the sample solution and to the solvent for cleansing: 0 mm. HV applied to the needle for the acquisition of mass spectra: 2.5 kV, HV duration time: 5 s. | ||
The appearance of initial sharp peaks in TIC in Fig. 2(a) at 0.29, 0.73, and 1.29 min indicates that residual analytes at the probe tip were electrosprayed preferentially at the initial stage of electrospray. In contrast, in Fig. 2(c), the TICs at 0.63 and 1.14 have the flat-top shape. This suggested that analytes were almost totally depleted at the 1st electrospray event at 0.28 min. The EIC of [(cytochrome c) + 17H]17+ at 0.28 min decayed in a few seconds. This rather slow decay was likely to be due to the toroidal vortex formed in the Taylor cone, namely, analyte ions were temporarily preserved in the stagnation region of the vortex formed in the Taylor cone.15 Thus, the application of a HV in the present experiment should be longer than a few seconds to electrospray all analytes preserved in the Taylor cone. The application of a HV for 5 s was long enough to avoid analytes to be left behind in the probe tip. In all the measurements in this work, the gel loading tip coated by the perfluoroalkyl film was used.
Fig. 3(a)–(d) show the TIC and mass spectra for water/methanol (1/1) solutions of 10−5 M gramicidin S, cytochrome c, and ubiquitin prepared in the 96-well plate. Water/methanol (1/1) was used for cleansing of the probe. As shown in the insets for EICs of three samples, the carry-over was negligible. Similar results were obtained for consecutive analysis of water/methanol (1/1) solutions of 10−5 M cocaine, morphine, amphetamine, and methamphetamine giving protonated analytes [M + H]+ as major ions (not shown).
 | ||
| Fig. 3 (a) TIC for water/methanol (1/1) solutions of 1% acetic acid, 10−5 M gramicidin S (①), cytochrome c (②), and ubiquitin (③). The probe was cleansed at 1.07, 2.15, and 3.19 min using water/methanol (1/1) solvent as marked by blue circles. (b) Mass spectrum for gramicidin S measured at 0.47 min. (c) Mass spectrum for cytochrome c measured at 1.52 min. (d) Mass spectrum for ubiquitin measured at 2.59 min. In EICs shown in the insets, little carry-over was observed for these three samples. The contact time of the probe with the sample and with the solvent for cleansing: ∼50 ms, invasion depth of the probe to the sample solution and to the solvent for cleansing: 0 mm. HV applied to the needle: 2.5 kV, HV duration time for the acquisition of the mass spectra: 5 s. | ||
Next, it was examined whether the technique could be applicable to the trace analysis of compounds deposited on the surface of the nonconducting substrate. When analytes were deposited/dried directly on the nonconducting substrates such as plastic plates, the touch sensor did not detect the contact point and the probe continued to move forward after the contact with the surface. Apparently, the change of capacitances before and after contact was lower than the threshold for the detection of the contact point. However, when the analytes were deposited on the metal substrates such as aluminum foil placed on the multiwell plate, the probe worked properly. It is worth noting that the solution deposited/dried on the frosted side of the aluminum foil gave the deposited analyte more even over the surface than that on the shiny side even though the formation of the coffee ring could not be avoided. Fig. 4 shows the TIC and mass spectra for 5 μL water/methanol solution of 2 ppm cocaine, morphine, amphetamine, and methamphetamine dropped/dried on the surface of the aluminum foil placed on the plastic plate (net weights of analytes: ∼10 ng). The diameter of the droplet deposited on the aluminum foil was about 3 mm. In the sfPESI analysis, the central position of the deposited analytes was sampled by the probe. From the surface area of the probe tip (0.07 mm2 for r = 0.15 mm) and the dried sample (7 mm2 for r = 1.5 mm), the analyte in contact with the probe to be extracted may be roughly estimated to be ∼100 pg assuming that the deposited analyte was distributed uniformly on the substrate. Fig. 4(a)–(e) show the TIC and mass spectra for the four drugs. In this measurement, the probe was in contact with the solid sample for 1 s to extract the dried analytes by a solvent in the probe.26 The protonated analytes [M + H]+ were detected as major ions for all samples. As shown in the insets in Fig. 4(b), (d), and (e) the carry-over was negligible for these drug samples deposited on the aluminum foil. The relatively weak ion intensity of [morphine + H]+ in Fig. 4(c) is likely to be due to the uneven deposit of analyte on the dried sample spot. Background ion signals were originated from water/methanol solvent prefilled in the liquid reservoir of the probe (see Fig. S3(c)).†
 | ||
| Fig. 4 Experimental results for 5 μL water/methanol (1/1) solutions of 2 ppm drug samples deposited/dried on the aluminum foil placed on the plastic multiwell plate. (a) TIC for the samples of cocaine (①), morphine (②), amphetamine (③), and methamphetamine (④). Mass spectra for (b) cocaine, (c) morphine, (d) amphetamine and (e) methamphetamine. The contact time of the probe with the sample and with the solvent for cleansing: 1 s, invasion depth of the probe to the sample and to the solvent for cleansing: 0 mm. HV applied to the needle: 2.5 kV, HV duration time for the acquisition of the mass spectra: 5 s. Solvent for cleansing: water/methanol (1/1). | ||
Finally, for the practical application of the present method to real samples, vegetable juice, orange juice, squeezed juice of mandarin fruit, and refreshing drink filled in the multiwell plate were examined. It was found that the marked carry-over was observed for these samples when the solvent of water/methanol (1/1) was used for cleansing. The observed persistent carry-over may be due to the high concentration of components contained in the samples. For example, the concentration of saccharides (Hex and Hex2) contained in vegetable juice is roughly estimated to be 0.7 M. As the demonstration of the carry-over, Fig. S2(a)† shows the EIC of [Hex + K]+ (m/z 219) that gave the largest memory effect among other components. In each cleansing, a few % of intensity of the main peak was observed. This is serious for the consecutive analysis for the identification of components of the samples. However, it was found that the carry-over became almost negligible when the solvent for cleansing was changed from water/methanol (1/1) to water/methanol/acetonitrile (1/1/1). Fig. S2(b)† shows the EIC of [Hex + K]+ for the four samples. The signal intensities of [Hex + K]+ in cleansing decreased to the order of ∼10−4 relative to those of the samples, i.e., the noise level (the dynamic range of the Orbitrap mass spectrometer is about three orders of magnitude). This indicated that the addition of acetonitrile to water/methanol solvent was very effective to get rid of the carry-over. While water and methanol are the representative protic solvents, acetonitrile is that for aprotic solvents. The combination of these protic and aprotic solvents showed the very high capability of cleansing the carry-over.
Fig. 5(a)–(d) show the mass spectra for vegetable juice, orange juice, squeezed mandarin fruit juice, and refreshing drink, respectively, obtained by using water/methanol/acetonitrile (1/1/1) as the cleansing solvent. The peak at m/z 104.0714 in Fig. 5(a) for vegetable juice and (b) for orange juice was identified as γ-aminobutyric acid (GABA) (exact mass: 104.0706) but not choline (exact mass: 104.10699). Proline betaine detected in orange juice and squeezed mandarin fruit juice is known as a biomarker of citrus. While [(citric acid) + K]+ was detected as the base peak for squeezed mandarin fruit juice in Fig. 5(c), it was detected only at a trace level for orange juice in Fig. 5(b). The commercial orange juice may be manufactured from fully matured oranges.16 In Fig. 5(d), major components of arginine and caffeine contained in refreshing drink were detected as major ions. For all four samples in Fig. 5, sequential electrospray of analyte ions was observed. As an example, Fig. S3† shows TIC and mass spectra for mandarin fruit juice. Mass spectrum obtained at T1 shown in TIC of Fig. S3(a)† is shown in Fig. 5(c). While [PB + H]+ and potassiated saccharides and citric acid were detected as major ions at T1, [Hex + Na]+ was detected as the major ion later at T2 in Fig. S3(b).† At T3, background ion signals originating from the water/methanol (1/1) solvent prevailed.
 | ||
| Fig. 5 Mass spectra for (a) vegetable juice, (b) orange juice, (c) squeezed mandarin fruit juice (PB stands for proline betaine), and (d) refreshing drink. The contact time of the probe with the sample and with the solvent for cleansing: ∼50 ms, invasion depth of the probe to the sample solution and to the solvent for cleansing: 0 mm. HV applied to the needle: 2.5 kV, HV duration time for the acquisition of the mass spectra: 5 s. | ||
Conclusion
A touch sensor for sfPESI that is applicable to liquid samples prepared in the nonconducting plastic multiwell plate was developed and it was coupled with a 3-axis robot for consecutive analysis. The carry-over was found to be negligible for 10−5 M water/methanol solutions of analytes such as gramicidin S, cytochrome c, and ubiquitin when water/methanol (1/1) was used for cleansing the probe tip. However, real samples such as commercial vegetable and orange juice gave the marked carry-over due to the high concentrations of components. This problem was almost completely solved by cleansing the sfPESI probe with the solvent of water/methanol/acetonitrile (1/1/1). The alleviation of the suppression effect in sfPESI is due to the self-cleaning of the analytes captured at the probe tip by the flow of pure solvent prefilled in the sfPESI probe accompanied with the spontaneous electrospray. In conclusion, the present methods would be useful for quick ambient surface analysis of multiple samples prepared in a multiwell plate. This technique would eliminate the time-consuming sampling operation because the non-disposable sfPESI probe was used for the repetitive and consecutive analysis. The extensive work on analysis of solid materials on nonconducting substrates using a lock-in amplifier system is now in progress in our laboratory.Conflicts of interest
There are no conflicts to declare.Acknowledgements
The financial support from the Japanese Government Grant-in-Aid for Scientific Research (S) and (A) (S: 24228004, A: 16H02533) are gratefully acknowledged.Notes and references
- T. Wachs and J. Henion, Electrospray device for coupling microscale separations and other miniaturized devices with electrospray mass spectrometry, Anal. Chem., 2001, 73, 632–638 CrossRef CAS PubMed.
- G. L. Van Berkel, V. Kertesz, K. Koeplinger, M. Vavrek and A.-N. T. Kong, Liquid microjunction surface sampling probe electrospray mass spectrometry for detection of drugs and metabolites in thin tissue sections, J. Mass Spectrom., 2008, 43, 500–508 CrossRef CAS PubMed.
- V. Kertesz and G. Van Berkel, Fully automated liquid-extraction-based surface sampling and ionization using a chip-based robotic nanoelectrospray platform, J. Mass Spectrom., 2010, 45, 252–260 CrossRef CAS PubMed.
- D. Eikel, M. Vavrek, S. Smith, C. Bason, S. Yeh, W. A. Korfmacher and J. D. Henion, Liquid extraction surface analysis mass spectrometry (LESA-MS) as a novel profiling tool for drug distribution and metabolism analysis: the terfenadine sample, Rapid Commun. Mass Spectrom., 2011, 25, 3587–3596 CrossRef CAS PubMed.
- Z. Takats, J. M. Wisedman, B. Gologan and R. G. Cooks, Mass spectrometry sampling under ambient conditions with desorption electrospray ionization, Science, 2004, 306, 471–473 CrossRef CAS PubMed.
- I. Lanekoff, B. S. Heath, A. Liyu, M. Thomas, J. P. Carson and J. Laskin, Automated platform for high-resolution tissue imaging using nanospray desorption electrospray ionization mass spectrometry, Anal. Chem., 2012, 84, 8351–8356 CrossRef CAS PubMed.
- Y. Ohtsuka, S. Shide, J. Naito, M. Kyogaku, H. Hashimoto and R. Arakawa, Scanning probe electrospray ionization mass spectrometry, Rapid Commun. Mass Spectrom., 2012, 26, 2725–2732 CrossRef PubMed.
- M. K. Mandal, K. Yoshimura, S. Saha, S. Ninomiya, M. O. Rahman, Z. Yu, L. C. Chen, Y. Shida, S. Takeda, H. Nonami and K. Hiraoka, Solid probe assisted nanoelectrospray ionization mass spectrometry for biological tissue diagnostics, Analyst, 2012, 137, 4658–4661 RSC.
- W. Rao, N. Pan and Z. Yang, High resolution tissue imaging using the single-probe mass spectrometry under ambient conditions, J. Am. Soc. Mass Spectrom., 2015, 26, 986–993 CrossRef CAS PubMed.
- B. Ji, B. Xia, Y. Gao, F. Ma, L. Ding and Y. Zhou, Generating electrospray ionization on ballpoint tips, Anal. Chem., 2016, 88, 5072–5079 CrossRef CAS PubMed.
- K. Hiraoka, K. Nishidate, K. Mori, D. Asakawa and S. Suzuki, Development of probe electrospray using a solid needle, Rapid Commun. Mass Spectrom., 2007, 21, 3139–3144 CrossRef CAS PubMed.
- M. K. Mandal, L. C. Chen, Y. Hashimoto, Z. Yu and K. Hiraoka, Detection of biomolecules from solutions with high concentration of salts using probe electrospray and nano-electrospray ionization mass spectrometry, Anal. Methods, 2010, 2, 1905–1912 RSC.
- M. K. Mandal, L. C. Chen and K. Hiraoka, Sequential and exhaustive ionization of analytes with different surface activity by probe electrospray ionization, J. Am. Soc. Mass Spectrom., 2011, 22, 1493–1500 CrossRef CAS PubMed.
- D. T. Usmanov, M. K. Mandal, K. Hiraoka, S. Ninomiya, H. Wada, M. Matsumura, S. Sanada-Morimura and H. Nonami, Dipping probe electrospray ionization/mass spectrometry for direct on-site and low-invasive food analysis, Food Chem., 2018, 260, 53–60 CrossRef CAS PubMed.
- D. T. Usmanov, K. B. Ashurov, S. Ninomiya, K. Hiraoka, H. Wada, H. Nakano, M. Matsumura, S. Sanada-Morimura and H. Nonami, Remote-sampling mass spectrometry for dry samples: sheath-flow probe electrospray ionization (PESI) using a gel-loading tip inserted with an acupuncture needle, Rapid Commun. Mass Spectrom., 2018, 32, 407–413 CrossRef CAS PubMed.
- K. Hiraoka, S. Rankin-Turner, S. Ninomiya, H. Wada, H. Nakano, M. Matsumura, S. Sanada-Morimura, F. Tanaka and H. Nonami, Component profiling in agricultural applications using an adjustable acupuncture needle for sheath-flow probe electrospray ionization/mass spectrometry, J. Agric. Food Chem., 2019, 67, 3275–3283 CrossRef CAS PubMed.
- D. T. Usmanov, S. Saha, L. C. Chen, S. Ninomiya, M. K. Mandal and K. Hiraoka, Probe electrospray ionization mass spectrometry with discontinuous atmospheric pressure interface, Eur. J. Mass Spectrom., 2015, 21, 327–334 CrossRef CAS PubMed.
- T. Satarpai, A. Siripinyanond, H. Su and J. Shiea, Rapid characterization of trace aflatoxin B1 in groundnuts, wheat and maize by dispersive liquid–liquid microextraction followed by direct electrospray probe tandem mass spectrometry, Rapid Commun. Mass Spectrom., 2017, 31, 728–736 CrossRef CAS PubMed.
- S.-H. Chiu and P. W. Urban, Robotics-assisted mass spectrometry assay platform enabled by open-source electronics, Biosens. Bioelectron., 2015, 64, 260–268 CrossRef CAS PubMed.
- G. R. D. Prabhu and P. L. Urban, The dawn of unmanned analytical laboratory, Trends Anal. Chem., 2017, 88, 41–52 CrossRef CAS.
- C.-L. Chen, T.-R. Chen, S.-H. Chiu and P. L. Urban, Dual robotic arm “production line” mass spectrometry assay guided by multiple Arduino-type microcontrollers, Sens. Actuators, B, 2017, 239, 608–616 CrossRef CAS.
- R. V. Bennett, E. M. Morzan, J. O. Huckaby, M. E. Monge, H. I. Christensen and F. M. Fernandez, Robotic plasma probe ionization mass spectrometry (RoPPI-MS) of non-planar surfaces, Analyst, 2014, 139, 2658–2662 RSC.
- R. B. Cody, J. A. Laramee and H. D. Durst, Versatile new ion source for the analysis of materials in open air under ambient conditions, Anal. Chem., 2005, 77, 2297–2302 CrossRef CAS PubMed.
- A. Li, M. R. L. Paine, S. Zambrzycki, R. B. Stryffeler, J. Wu, M. Bouza, J. Huckaby, C.-Y. Chang, M. Kumar, P. Mukhija and F. M. Fernández, Robotic Surface Analysis Mass Spectrometry (RoSA-MS) of Three-Dimensional Objects, Anal. Chem., 2018, 90, 3981–3986 CrossRef CAS PubMed.
- K. Hiraoka, S. Rankin-Turner, S. Ninomiya, R. Sekine, H. Wada, M. Matsumura, S. Sanada-Morimura, F. Tanaka and H. Nonami, Point analysis of foods by sheath-flow probe electrospray ionization/mass spectrometry (sfPESI/MS) coupled with a touch sensor, J. Agric. Food Chem., 2020, 68, 418–425 CrossRef CAS PubMed.
- S. Rankin-Turner, S. Ninomiya, J. C. Reynolds and K. Hiraoka, Sheath-flow probe electrospray ionization (sfPESI) mass spectrometry for the rapid forensic analysis of human body fluids, Anal. Methods, 2019, 11, 3633–3640 RSC.
Footnote |
| † Electronic supplementary information (ESI) available: Fig. S1 two consecutive measurements of EICs of (a) [(gramicidin S) + 2H]2+ (m/z 571) for 1 × 10⁻⁵ M gramicidin S in water/methanol (1/1), and (b) [(rhodamine B) − Cl]+ (m/z 443) for 2 × 10⁻⁶ M rhodamine B in water/methanol (1/1). The probe tip coated by perfluoroalkyl film was used. The contact time of the probe with the sample: ∼50 ms, invasion depth of the probe to the sample solution: 0 mm. HV applied to the needle: 2.5 kV, HV duration time for the acquisition of the mass spectra: 5 s. Fig. S2 EIC of [Hex + K]+ (m/z 219) for the four real samples: ① vegetable juice, ② orange juice, ③ squeezed mandarin fruit juice, and ④ refreshing drink. (a) Water/methanol (1/1) solvent used for cleansing. (b) Water/methanol/acetonitrile (1/1/1) used for cleansing. The contact time of the probe with the sample and with the solvent for cleansing: ∼50 ms, invasion depth of the probe to the sample solution and to the solvent for cleansing: 0 mm. HV applied to the needle: 2.5 kV, HV duration time for the acquisition of the mass spectra: 5 s. Fig. S3 (a) TIC for squeezed juice of mandarin fruit. (b) Mass spectrum obtained at T2. (c) Mass spectrum obtained at T3. The contact time of the probe with the sample and with the solvent for cleansing: ∼50 ms, invasion depth of the probe to the sample: 0 mm. HV applied to the needle: 2.5 kV, HV duration time for the acquisition of the mass spectra: 5 s. See DOI: 10.1039/d0ay00778a |
| This journal is © The Royal Society of Chemistry 2020 |