Vacuum-assisted electrokinetic supercharging in flow-gated capillary electrophoresis for rapid analysis of high-salt cerebrospinal fluid samples
Naveen
Maddukuri
and
Maojun
Gong
 *
*
Department of Chemistry, Wichita State University, Wichita, Kansas 67260, USA. E-mail: maojun.gong@wichita.edu; Tel: +1-316-978-7381
First published on 21st November 2019
Abstract
On-line sample preconcentration is often required to achieve sensitive detection of specific analytes in capillary electrophoresis. However, available on-line techniques for concentrating high-salt samples such as cerebrospinal fluid (CSF) are mainly limited to sweeping and dynamic pH-junctions, etc. Electrokinetic supercharging (EKS) for sample preconcentration combines the techniques of field-amplified sample injection and transient isotachophoresis that may generate tremendous signal enhancement while maintaining high separation efficiency. This paper reports a novel EKS method for the on-line preconcentration of high-salt CSF samples in flow-gated capillary electrophoresis. The basic procedures include three major steps. First, a sample plug was hydrodynamically injected under vacuum; second, a voltage with the reversed polarity was applied to perform EKS with the assistance of a vacuum during the sample plug push-out; and finally a normal-polarity voltage was applied for separation. Specifically, amino acids were fluorogenically derivatized with naphthalene-2,3-dicarboxaldehyde (NDA) in the presence of cyanide. The optimal final sample medium included 20% CSF (or aCSF in volume), 50% acetonitrile, 12.0 mM borate, 5.0 mM KCN, 5.0 mM NDA, and 2.0 mM EDTA; and the separation buffer was composed of 40.0 tetraborate pH 9.2, 50.0 mM SDS, and 3.5 mM hydroxypropyl-β-cyclodextrin. The enhancement factors for a series of amines were in the range of 30–100 fold, and the detection limits were estimated to be below 0.10 nM. The developed method was coupled with alternate injections for the one-point standard addition method to determine γ-aminobutyric acid (GABA) in CSF from rat brain striatum. The results demonstrated detection sensitivity and accuracy for the rapid analysis of high-salt CSF samples.
1. Introduction
Flow-gated capillary electrophoresis (CE) takes the configuration of a single-cross microchip that is widely used for rapid and efficient electrophoretic separations.1–3 Differently, flow-gated CE utilizes a silica capillary as the separation microfluidic channel that can be replaced with a new one if the channel gets clogged or damaged.1 The silica capillary used in conventional CE has tremendous stability in electrophoretic separations. However, like conventional and microchip CE, flow-gated CE also suffers from low detection sensitivity even when a sensitive detection method such as laser-induced fluorescence (LIF) is used.4,5 To expand its applicability, sample preconcentration using online or offline strategies may be performed to enhance the detection sensitivity; and the online method is often preferred due to its simplicity and convenience in coupling with electrophoretic separations.4,6Numerous online sample preconcentration strategies have been developed for conventional and microchip CE.5,7 Such methodologies are mainly based on differing electrophoretic velocities of analytes in the sample plug and at the background electrolyte (BGE) boundary by creating uneven distribution of electric field strength, via varying the charges carried by analytes, or through the combination of the two parameters.7 Discontinuity of the electric field can be simply created by using sample and running buffers with different electrical conductivities;7 alternatively, low conductivity of the sample medium may be electrophoretically generated by dissolving high concentrations of salts such as NaCl in the sample solution.8,9 To vary effective charges on analytes, complexing surfactants and dynamic pH junctions have been adopted to achieve sweeping and selective preconcentration of pH sensitive analytes, respectively.10–14 Among these technologies, several techniques are capable of enriching high-salt samples via micellar sweeping,15 dynamic pH junctions,16 or transient isotachophoresis.17,18 However, the signal enhancement for biological samples is often limited due to the complexity of the sample matrix when directly being analyzed by CE.
To improve the on-line preconcentration efficiency, the combination of two or more strategies has been utilized to obtain significant signal enhancement.19–22 Quirino and Terabe developed a process to conduct cation-selective exhaustive injection and sweeping, which achieved million-fold signal enhancement.23 The same research group later reported a procedure to perform anion-selective exhaustive injection and sweeping, achieving up to 6000-fold sensitivity enhancement.24 Both methods took advantage of field-amplified stacking injection (FASI) to inject diluted samples to form a long, concentrated sample plug followed by sweeping with anionic or cationic surfactants. Electrokinetic supercharging (EKS)22 combining electrokinetic injection and transient isotachophoresis has been reported to easily produce thousands of folds in detection enhancement.25,26 Further efforts have been made to improve injection techniques for EKS, and up to 10![[thin space (1/6-em)]](https://www.rsc.org/images/entities/char_2009.gif) 000–100
000–100![[thin space (1/6-em)]](https://www.rsc.org/images/entities/char_2009.gif) 000 fold detection enhancement has been reported.27–29
000 fold detection enhancement has been reported.27–29
This paper reports a vacuum-assisted EKS strategy in flow-gated CE to perform online preconcentration of biological samples containing primary amines fluorogenically derivatized with NDA in the presence of cyanide. A short sample plug was hydrodynamically introduced into the capillary, and then a reversed-polarity voltage was applied to perform EKS with the vacuum maintained to elongate the injection duration. Finally, a normal-polarity voltage was applied to conduct separation when the concentrated plug arrived at the inlet tip of the capillary. A signal enhancement of up to 100 folds for aspartate in artificial cerebrospinal fluid (aCSF) was achieved, and the technique lowered the limits of detection to below 0.1 nM for most of the involved analytes. This technique was finally applied to the quantitation of γ-aminobutyric acid (GABA) by using the one-point standard addition method based on the integrated flow-gated CE system with alternate injections.30 The method was simple to use and could be applied to the direct analyses of biological samples on a flow-gated CE system.
2. Materials and methods
2.1. Chemicals and solutions
Amino acids and sodium dodecyl sulfate (SDS) were ordered from Sigma (St. Louis, MO, USA). Potassium cyanide (KCN), sodium hydroxide, sodium chloride, boric acid, and sodium tetraborate were purchased from Fisher Scientific (Chicago, IL, USA). 2,3-Naphthalenedicarboxaldehyde (NDA) was ordered from AnaSpec, INC. (Fremont, CA, USA). Hydroxypropyl-beta-cyclodextrin (HP-β-CD), dimethylformamide (DMF), and ethylenediaminetetraacetate (EDTA) were purchased from ACROS (New Jersey, USA). Cerebrospinal fluid (CSF) collected from the striatum of Sprague Dawley rats was purchased from BioreclamationIVT (Long Island, NY, USA). Fused silica capillaries were purchased from Polymicro Technologies (Phoenix, AZ, USA).The NDA stock solution at 50.0 mM was prepared in anhydrous DMF and stored at 4 °C, and 12.5 mM NDA solution was prepared by diluting the stock solution with acetonitrile (ACN) on a daily basis. The stock solutions of amino acids (10.0 mM) were prepared in deionized (DI) water and were diluted to appropriate concentrations with aCSF. The stock solution of KCN at 50.0 mM was prepared in DI water. The stock tetraborate buffer (pH 9.2) at 100.0 mM was prepared in DI water without further pH adjustment. The stock solutions of 200 mM sodium dodecyl sulfate (SDS) and 50.0 mM HP-β-CD were prepared in DI water. Unless otherwise stated, the separation BGE consisted of 40.0 mM tetraborate, 50.0 mM SDS, and 3.5 mM HP-β-CD, which were prepared by mixing appropriate volumes of their stock solutions to achieve final concentrations. The aCSF consisted of 145.0 mM NaCl, 2.7 mM KCl, 1.0 mM MgSO4, 1.2 mM CaCl2, and 2.0 mM Na2HPO4, and its pH was adjusted to 7.4 with HCl solution.31,32
2.2. Instrumentation
The flow-gated CE system has been described before.33–35 Briefly, a 442 nm laser beam was spectroscopically filtered through an interference bandpass filter at 442 ± 5 nM, and then focused on the separation capillary through a 40× oil-immersion objective with a numerical aperture of 1.3. Fluorescence was collected by using the same objective and then detected by a photomultiplier tube (PMT) after spectral filtration with a bandpass filter (485 ± 10 nm). The current signal from the PMT was pre-amplified and then converted to voltages by an SR570 current preamplifier (Stanford Research Systems, Sunnyvale, CA, USA). Voltage signals were finally recorded by a LabVIEW program. For two-branch sample injection, a 4-syringe pump (Chemyx Inc., Stafford, TX, USA) was used to supply the sample and spiked sample through two gastight Hamilton syringes (Reno, Nevada, USA). The flow gate, micro switch, and other interfaces were fabricated with poly(dimethyl siloxane) (PDMS) as described earlier.33,36 For hydrodynamic injection, a vacuum pump was connected to a gastight reservoir (Model C360 purchased from LabSmith Inc.).37 A high voltage was applied to the reservoir while grounding the inlet side of the separation capillary. A high-voltage power supply (Model CZE1000R) was modified to enable automatic polarity reversal by re-wiring the toggle switch. The whole process including alternate sample flow switching, gating flow switching, and voltage polarity reversal was controlled via a LabVIEW program.2.3. Experimental conditions
The separation capillary was 10 μm in ID and 360 μm in OD. It was 12.0 cm in effective length and 20.0 cm in total (12/20). Fresh separation buffer was supplied via a 50 mL plastic syringe powered by a syringe pump. The gating flow of the separation buffer was controlled with a 3-way solenoid pinch valve purchased from Cole-Parmer (Vernon Hills, IL, USA). Sample derivatization was performed offline by pipetting three solutions to be mixed in a 0.6 mL centrifuge tube: 40 μL of 12.5 mM NDA, 20 μL of sample in aCSF or CSF, and 40 μL of 12.5 mM KCN in 30.0 mM boric acid and 5.0 mM EDTA (pH 9.2). The derivatization mixture was allowed to react at room temperature in the dark for 5–15 min.3. Results and discussion
3.1. Process of vacuum-assisted EKS
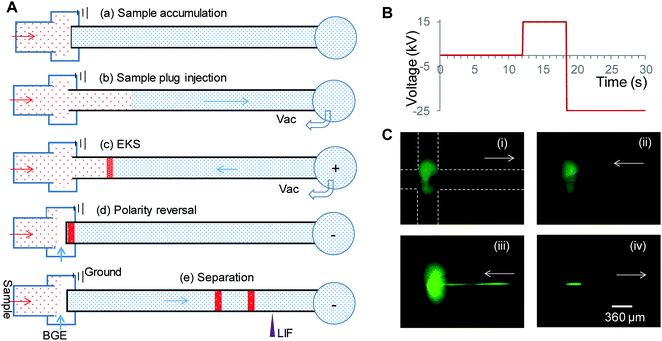
EKS in flow-gated CE included the following four steps as shown in Fig. 1A: (a) sample accumulation at the cross section. The gating flow was switched off while keeping the sample flowing. The sample solution displaced the BGE in the inlet region of the separation capillary (Fig. 1C(i)); (b) sample plug injection. A vacuum (−0.80 atm) was applied to the outlet reservoir, and a sample plug was pulled into the capillary (Fig. 1C(i)); (c) vacuum-assisted EKS. A positive voltage was applied to the outlet reservoir while maintaining the vacuum at −0.80 atm; and simultaneously, negatively charged analytes were injected and concentrated at the conductivity boundary. The sample buffer plug was pushed out of the capillary until the concentrated sample reached the capillary tip (Fig. 1C(ii) and (iii)). During the whole process, the sample solution was continuously supplied to the cross region of the flow gate via a syringe pump, which ensured that the inlet of the capillary was immersed in the sample solution; (d) polarity reversal for separation. The gating flow was switched on to flush the sample solution in the cross region followed by applying a negative voltage at the outlet reservoir (Fig. 1C(iv)). The concentrated sample plug was separated and detected by LIF.3.2. Condition optimization
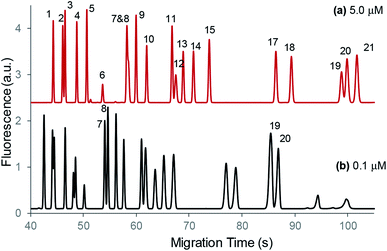
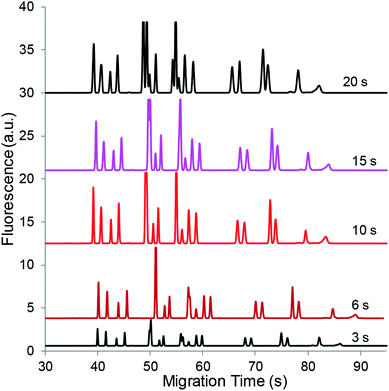
To successfully achieve the on-line sample preconcentration and separation of high-salt CSF samples, multiple parameters need to be optimized for the vacuum-assisted EKS process described above. These parameters include (1) separation conditions for resolving multiple analytes; (2) sample plug length injected by the vacuum; (3) EKS pushing back time and voltage applied; and (4) conductivity (relative to the BGE) of the sample medium. These optimizations are described below.It was noticed that the migration of species was faster after the EKS process than those obtained with the normal injection although both plugs started from the capillary tip. The elevated electroosmotic flow (EOF) after the EKS process was presumably attributed to the slight decrease in the ionic strength of the BGE in the capillary. During the EKS step, anions in the injected plug and from the flow gate cross region would be rapidly injected and concentrated at the BGE boundary, while cations in the BGE would also be induced to the boundary thus maintaining neutrality in charge. This procedure is expected to lower the ionic strength which favors a faster EOF. Due to the variation of EOF, the separation of Peaks 7 and 8 is observed in Fig. 2b, while Peaks 2 and 3 overlapped as shown in Fig. 2b.
3.2.2.1 Buffer. It has been reported that pH between 9 and 10 favors the derivatization of primary amines with NDA in the presence of cyanide.39 Sample stacking or FASI for CE requires a low conductivity of the sample medium thus increasing the electric field strength relative to that of the BGE. To minimize the salt content, buffer components and their concentrations should be appropriately selected. For the fluorogenic derivatization of amino acids with NDA, KCN is often required at a millimolar concentration,3 which unavoidably increases the conductivity of the sample medium. In addition, EDTA was needed to complex magnesium and calcium ions present in CSF to prevent cationic interaction with the capillary surface. It was found that 5.0 mM KCN and 2.0 mM EDTA tetrasodium dissolved in deionized water generated pH 10.5, which was further adjusted to pH 9.5 by using boric acid to have a final concentration of 12.0 mM in the derivatization mixture.
3.2.2.2 NaCl salt. The derivatization medium also serves as the sample medium for the vacuum-assisted EKS process. To study the salt effect on the EKS results, various concentrations of NaCl were added to the sample medium, and the optimal concentration and separation results were obtained for each NaCl concentration as shown in Fig. 3. As can be seen, NaCl above a specific concentration was required to facilitate both the separation efficiency and the vacuum-assisted EKS results. On the other hand, wide peaks and poor separation were observed without or with low NaCl concentrations. These results were presumably attributed to the electrokinetic supercharging (EKS) effect for which Cl− served as the leading electrolyte. During the EKS process, Cl− rapidly migrated to the plug boundary and accumulated there, followed by accumulation of NDA-amino acid derivatives. Simultaneously on the other hand, Na+ might be depleted in the sample plug. Cl− had high electrophoretic mobility thus migrating quickly in a relatively high electric field. However, low concentrations of Cl− in the sample medium might not effectively build a leading electrolyte plug that was critical to profile the concentrated analytes. A high level of Cl− was able to establish a stable plug for sample concentration based on EKS. Fig. 3 also shows that signals decreased with the further increase of NaCl concentrations in the sample derivatization mixture, which was attributed to reduced FASI efficiency due to the increase in the conductivity of the sample medium.
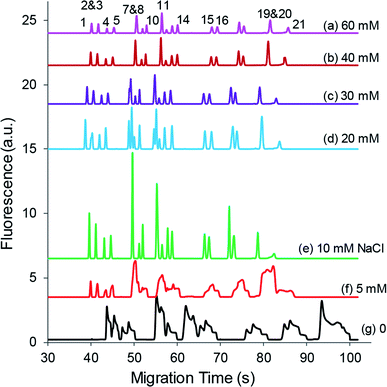 | ||
| Fig. 3 NaCl effect on EKS concentration results. Each electropherogram was obtained at the optimized sample plug injection length and EKS duration. Other conditions and peak identities are the same as in Fig. 2b. | ||
Biological fluids such as CSF contain high concentrations of salt mainly in the form of NaCl. For example, CSF may have NaCl concentrations around 150 mM. This high level of NaCl might adversely affect the EKS results if directly analyzed as discussed above. To reduce the salt effect, dilution of CSF may be performed, and the sample preconcentration based on such dilution could compensate for the dilution effect on detection sensitivity. After mixing with derivatization reagents (NDA and KCN), there would be 20–50% CSF that results in more than 30 mM of NaCl and other salts in the derivatization mixture.32 To study the salt effect on the EKS effectiveness, the mixing ratio of NDA, KCN, and the aCSF sample (three solutions) was adjusted to compare the optimal EKS results. Fig. 4 shows typical electropherograms of three mixing ratios by varying the sample volumes. The results indicate that the peak heights of individual components were comparable although (a), (b) and (c) contained 1/3, 1/5, and 1/6 fractions (volume) of the aCSF sample containing the same concentrations of analytes, respectively. The improved EKS results at lower salt levels in the sample medium actually compensated for the lower levels of analytes in derivatized mixtures. Based on these results, the 2![[thin space (1/6-em)]](https://www.rsc.org/images/entities/char_2009.gif) :
:![[thin space (1/6-em)]](https://www.rsc.org/images/entities/char_2009.gif) 2
2![[thin space (1/6-em)]](https://www.rsc.org/images/entities/char_2009.gif) :
:![[thin space (1/6-em)]](https://www.rsc.org/images/entities/char_2009.gif) 1 mixing ratio in volume was adopted for NDA, KCN, and the aCSF sample, respectively. The resulting mixture contained 5.0 mM NDA, 5.0 mM KCN, 12.0 mM boric acid, 2.0 mM EDTA, 50% (volume) acetonitrile, and 20% aCSF. The mixture had a conductivity of 2.5 mS at room temperature versus 6.6 mS of conductivity of the separation buffer, which results in a conductivity ratio of 2.6.
1 mixing ratio in volume was adopted for NDA, KCN, and the aCSF sample, respectively. The resulting mixture contained 5.0 mM NDA, 5.0 mM KCN, 12.0 mM boric acid, 2.0 mM EDTA, 50% (volume) acetonitrile, and 20% aCSF. The mixture had a conductivity of 2.5 mS at room temperature versus 6.6 mS of conductivity of the separation buffer, which results in a conductivity ratio of 2.6.
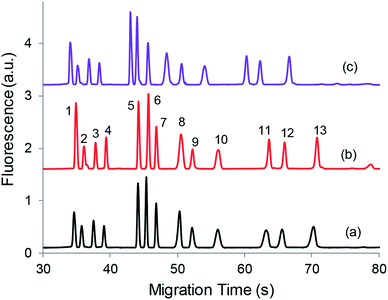 | ||
Fig. 4 Effect of mixing ratio on signal enhancement. Mixing ratios of 3 different solutions: NDA, KCN/EDTA, and the aCSF sample. (a) 2![[thin space (1/6-em)]](https://www.rsc.org/images/entities/char_2009.gif) : :![[thin space (1/6-em)]](https://www.rsc.org/images/entities/char_2009.gif) 2 2![[thin space (1/6-em)]](https://www.rsc.org/images/entities/char_2009.gif) : :![[thin space (1/6-em)]](https://www.rsc.org/images/entities/char_2009.gif) 2 (v/v/v), (c) 2 2 (v/v/v), (c) 2![[thin space (1/6-em)]](https://www.rsc.org/images/entities/char_2009.gif) : :![[thin space (1/6-em)]](https://www.rsc.org/images/entities/char_2009.gif) 2 2![[thin space (1/6-em)]](https://www.rsc.org/images/entities/char_2009.gif) : :![[thin space (1/6-em)]](https://www.rsc.org/images/entities/char_2009.gif) 1, (b) 2 1, (b) 2![[thin space (1/6-em)]](https://www.rsc.org/images/entities/char_2009.gif) : :![[thin space (1/6-em)]](https://www.rsc.org/images/entities/char_2009.gif) 2 2![[thin space (1/6-em)]](https://www.rsc.org/images/entities/char_2009.gif) : :![[thin space (1/6-em)]](https://www.rsc.org/images/entities/char_2009.gif) [1 + 1] and [1 + 1] indicates one volume of aCSF sample was diluted with one volume of DI water. (1) Ser, (2) Asn, (3) Gln, (4) His, (5) Glu, (6) Gly, (7) Ala, (8) Asp, (9) GABA, (10) Val, (11) Met, (12) Ile, and (13) Leu. Other conditions are the same as in Fig. 2b. [1 + 1] and [1 + 1] indicates one volume of aCSF sample was diluted with one volume of DI water. (1) Ser, (2) Asn, (3) Gln, (4) His, (5) Glu, (6) Gly, (7) Ala, (8) Asp, (9) GABA, (10) Val, (11) Met, (12) Ile, and (13) Leu. Other conditions are the same as in Fig. 2b. | ||
A high conductivity difference (e.g. usually 10-fold) between the sample and the BGE favors the conventional sample stacking, and the 2.6-fold ratio of the BGE conductivity relative to the sample medium might not efficiently promote FASI. However, the sample mixture contained NaCl at 29 mM, and KCN at 5.0 mM. In the electric field, the anions of Cl− and CN− as well as the cations of Na+ and K+ could rapidly migrate towards the anode and the cathode, respectively. Chloride anions would accumulate at the boundary of the sample and BGE, and would serve as the leading electrolyte during the EKS step (Fig. 1A(c)). This process simultaneously generated a low-conductivity plug in the capillary, which might enhance the FASI efficiency. Negatively charged analytes and chloride in the flow gate region would be continuously driven into the capillary and pile up at the boundary. The piled-up region expanded with time as shown in Fig. 1C(iii) because the concentrated region would have conductivity no greater than that of the BGE. This phenomenon managed the maximum concentrations of the salts as well as the concentrated analytes. Therefore, there was an optimal condition for the best EKS results that depends on the sample plug length and the EKS duration (see Section 3.2.2.4).
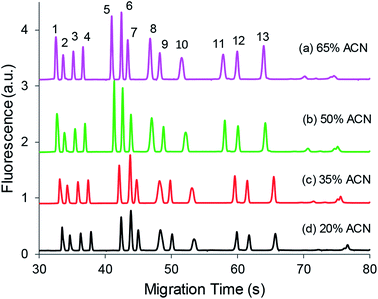
3.2.2.3 Organic solvent. To increase the difference in conductivity between the two buffer plugs, various volumes of organic solvent (acetonitrile) were added to the derivatization mixture to study the optimal EKS results. As shown in Fig. 5, a larger volume fraction of up to 65% (v/v) of acetonitrile could improve peak sizes, which was presumably attributed to the lower conductivity and/or lower viscosity of the sample plug injected into the capillary. However, an excess amount of acetonitrile may not tolerate the solubility of salts introduced from aCSF, buffer components, and derivatization KCN; therefore, a 50% acetonitrile volume fraction was used for the derivatization mixture. The presence of 50% organic solvent was also used to ensure the solubility of NDA in the derivatization mixture.
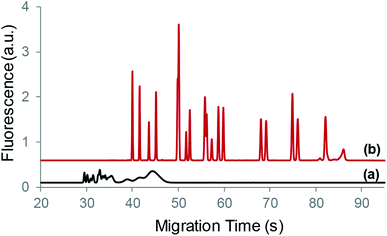
3.2.2.4 Effect of sample plug length on EKS results. The analytes in the sample medium were injected into the separation capillary by applying a vacuum via the waste reservoir. The injected plug length was manipulated by using the combination of the vacuum magnitude and the time duration. This plug served as the low-conductivity buffer that carried a higher electric field strength when a voltage was applied across the whole capillary. To conduct simple sample stacking in CE, a sample plug was injected and a voltage was applied across the capillary, but both stacking and separation failed as shown in Fig. 6a. This failure was presumably attributed to the small difference in the conductivities of the sample medium and the BGE; and the small amount of chloride in the sample plug was insufficient to act as the leading electrolyte for EKS. As comparison, the vacuum-assisted EKS process not only enhanced the signal but also ensured the separation of multiple components in the sample as shown in Fig. 6b. High separation efficiency was achieved at more than 300
![[thin space (1/6-em)]](https://www.rsc.org/images/entities/char_2009.gif) 000 theoretical plates for most of the analytes.
000 theoretical plates for most of the analytes.
During the vacuum-assisted EKS process, negatively charged analytes were injected and concentrated at the buffer boundary when a voltage with reversed polarity was applied across the capillary. The selective injection of anions depends on the greater electrophoretic velocities in the sample plug than the bulk electroosmotic flow (EOF). The FASI amounts of analytes in many respects are determined by the electric field strength and the time duration. To experimentally optimize the sample plug length, various hydrodynamic injection times were used to drag different sample plug lengths into the separation capillary while maintaining −0.80 atm in the waste reservoir. Fig. 7 shows the comparison of the electropherograms obtained with different sample plug lengths under their optimal EKS conditions. As can be seen, peak heights increased until reaching a maximum with the increase of the sample plug length. The peak height plateau was presumably due to the maximum achievable concentration of the concentrated salts at the plug boundary. Afterwards, the salt region extended together with the concentrated analyte zone as observed in Fig. 1C(iii). However, a large sample plug length might impair the concentration results due to the diffusion of the sample plug at the boundary. Therefore, a sample plug length of approximately 1.2 mm (−0.80 atm for 10 s) was used as the optimal sample plug.
Note that the vacuum at −0.80 atm was maintained during the EKS process, which allowed a high voltage of 15 kV to be applied to pump out the sample medium plug and to rapidly inject anions. The timing of the EKS could be observed by monitoring the current change, and the actual timing should be optimized by using various EKS periods.
3.3. Enhancement factors
Table 1 summarizes the enhancement factors estimated by comparing the peak heights obtained under EKS conditions to those at the normal injection. To perform EKS, a diluted sample containing 21 amino acids at 100 nM each was used, and the results were obtained under the optimal conditions: sample plug injection at −0.80 atm for 10 s followed by the EKS step at −15 kV for 6.5 s while maintaining −0.80 atm at the outlet of the separation capillary. For the normal injection, analytes at 5.0 μM each were derivatized, with 50 mM tetraborate added to match the conductivity of the separation buffer. Sample injection was performed by using −0.80 atm for 0.3 s. Typical electropherograms are shown in Fig. 2. As can be seen in Table 1, glutamate (92 folds) and aspartate (101 folds) were preconcentrated more than the others (38–63 folds) because both carry −2 charges while the others only have −1 charge; and the arginine peak was not observed in the EKS electropherogram because it might be pushed out of the capillary during the EKS step due to its neutrality after derivatization.| Peak # | Amino acids | Enhancement factor |
|---|---|---|
| 1 | Ser | 47 |
| 2 & 3 | Thr & Asn | — |
| 4 | Gln | 45 |
| 5 | His | 50 |
| 6 | PEA | 50 |
| 7 | Glu | 92 |
| 8 | Gly | 38 |
| 9 | Cit | 51 |
| 10 | Ala | 60 |
| 11 | Asp | 101 |
| 12 | Tyr | 40 |
| 13 | GABA | 51 |
| 14 | Tau | 53 |
| 15 | Val | 52 |
| 16 | Met | 51 |
| 17 | Ile | 53 |
| 18 & 19 | Trp & Leu | — |
| 20 | Phe | 63 |
3.4. Determination of GABA in CSF using one-point standard addition
To demonstrate the application of the on-line preconcentration technique, GABA in CSF from rat striatum was determined by using the one-point standard addition method reported before.36 Briefly, a micro switch was coupled with the flow-gated CE system to enable alternate injections of the sample and its standard addition. Based on the peak height or peak area ratios, the levels of the analytes were determined. To reduce the interference from the complex composition of CSF,40 the CSF sample was diluted by 5 folds with aCSF, and the derivatization mixture contained NDA, KCN, and the sample in a 2![[thin space (1/6-em)]](https://www.rsc.org/images/entities/char_2009.gif) :
:![[thin space (1/6-em)]](https://www.rsc.org/images/entities/char_2009.gif) 2
2![[thin space (1/6-em)]](https://www.rsc.org/images/entities/char_2009.gif) :
:![[thin space (1/6-em)]](https://www.rsc.org/images/entities/char_2009.gif) 1 (volume) ratio, respectively. Fig. 8 shows typical electropherograms of the CSF sample at 5-fold dilution and its standard addition of GABA at 200 nM. The determined concentration of GABA in the diluted CSF was 55.5 ± 3.7 nM by the one-point standard addition method (6–10 alternate injections), and the corresponding concentration in CSF was obtained as 277 ± 18 nM, which agrees with the reported basal GABA concentrations of 270 ± 40 nM in the extracellular space of the rat striatum.41,42
1 (volume) ratio, respectively. Fig. 8 shows typical electropherograms of the CSF sample at 5-fold dilution and its standard addition of GABA at 200 nM. The determined concentration of GABA in the diluted CSF was 55.5 ± 3.7 nM by the one-point standard addition method (6–10 alternate injections), and the corresponding concentration in CSF was obtained as 277 ± 18 nM, which agrees with the reported basal GABA concentrations of 270 ± 40 nM in the extracellular space of the rat striatum.41,42
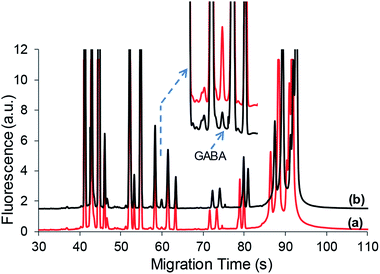 | ||
| Fig. 8 Typical electropherograms of CSF (5-fold dilution) and its standard addition of GABA (200 nM). See the text for conditions. | ||
It should be mentioned that the dilution of the CSF sample was performed to reduce the background signal due to the complexity of CSF. Otherwise, the separation of GABA from other species became unresolved from or interfered by neighboring peaks. Fortunately, the sample preconcentration technique enabled detection sensitivity and generated well-resolved peaks as shown in the Fig. 8 inset. Although GABA could be detected without sample preconcentration needed, it often had difficulty due to the lower levels of GABA than other amino species in CSF samples.42 To determine low levels of GABA in CSF or other biological fluids, the present technique would demonstrate improved capability in CE analysis considering the detection limit to be below 0.1 nM.
4. Conclusions
The sequential procedures in the operation of flow-gated CE allow fresh sample accumulation in the cross region, rapid hydrodynamic sample injections, and rapid separations with polarity switching. These properties associated with flow-gated CE facilitate online sample preconcentration by decreasing the diffusional expansion of plugs or boundaries. As such, better signal enhancement could be achieved in flow-gated CE compared with conventional CE.The presence of high-salt contents in the sample solution increases the conductivity of the sample plug thus adversely affecting the FASI efficiency. Fortunately, Na+ and Cl− have greater mobilities that enable the rapid migration of these ions thus generating a low-conductivity region for FASI and serve as the leading electrolyte in transient isotachophoresis. However, the concentrated Cl− region expands, thus preventing further concentration of anionic analytes. Therefore, the present technique only generated limited enhancement factors in the range of 38–100 fold, with higher enhancement for more charged species (e.g. Glu and Asp). Advantageously, the technique was able to simultaneously concentrate numerous analytes while maintaining the separation efficiency.
To demonstrate the application of the developed sample preconcentration method, GABA in CSF was determined by using the one-point standard addition method. Alternate injections of the sample and its standard addition were enabled by integrating the micro-fabricated PDMS switch with the flow-gated CE system. The alternate injection technique avoids the usage of an internal standard as well as the high dependence of long-term experimental reproducibility, while the measurement accuracy was secured. The instrumental setup and technologies are expected to be useful in the quantitative analysis of high-salt samples such as urine and blood plasma.
Abbreviations
| NDA | Naphthalene-2,3-dicarboxaldehyde |
| HP-β-CD | Hydroxypropyl-β-cyclodextrin |
| SDS | Sodium dodecyl sulfate |
| GABA | γ-Aminobutyric acid |
| BGE | Background electrolyte |
| EOF | Electroosmotic flow |
| EKS | Electrokinetic supercharging |
| FASI | Field-amplified stacking injection |
| aCSF | Artificial cerebrospinal fluid |
| CSF | Cerebrospinal fluid |
Conflicts of interest
The authors declare no conflicts of interest.Acknowledgements
We thank Ning Zhang (Wichita State) for the help with the preparation of the micro PDMS switch. This research was funded by the National Institute of General Medical Sciences with the grant number of P20 GM103418.References
- M. Gong, N. Zhang and N. Maddukuri, Anal. Methods, 2018, 10, 3131–3143 RSC.
- X. Wang, L. Yi and M. G. Roper, Anal. Chem., 2016, 88, 3369–3375 CrossRef CAS PubMed.
- M. Shou, A. D. Smith, J. G. Shackman, J. Peris and R. T. Kennedy, J. Neurosci. Methods, 2004, 138, 189–197 CrossRef CAS.
- C.-X. Zhang and M. M. Meagher, Anal. Chem., 2017, 89, 3285–3292 CrossRef CAS.
- M. C. Breadmore, R. M. Tubaon, A. I. Shallan, S. C. Phung, A. S. Abdul Keyon, D. Gstoettenmayr, P. Prapatpong, A. A. Alhusban, L. Ranjbar, H. H. See, M. Dawod and J. P. Quirino, Electrophoresis, 2015, 36, 36–61 CrossRef CAS PubMed.
- T. Kawai, M. Ueda, Y. Fukushima, K. Sueyoshi, F. Kitagawa and K. Otsuka, Electrophoresis, 2013, 34, 2303–2310 CrossRef CAS PubMed.
- S. L. Simpson, J. P. Quirino and S. Terabe, J. Chromatogr. A, 2008, 1184, 504–541 CrossRef CAS PubMed.
- Z. K. Shihabi, J. Capillary Electrophor., 1995, 2, 267–271 CAS.
- Z. K. Shihabi, J. Chromatogr. A, 1996, 744, 231–240 CrossRef CAS.
- Q. Zhang and M. Gong, J. Chromatogr. A, 2016, 1450, 112–120 CrossRef CAS.
- M. Gong, K. R. Wehmeyer, P. A. Limbach and W. R. Heineman, Anal. Chem., 2006, 78, 6035–6042 CrossRef CAS.
- C.-X. Cao, Y.-Z. He, M. Li, Y.-T. Qian, M.-F. Gao, L.-H. Ge, S.-L. Zhou, L. Yang and Q.-S. Qu, Anal. Chem., 2002, 74, 4167–4174 CrossRef CAS.
- P. Britz-McKibbin and D. D. Y. Chen, Anal. Chem., 2000, 72, 1242–1252 CrossRef CAS.
- J.-B. Kim, P. Britz-McKibbin, T. Hirokawa and S. Terabe, Anal. Chem., 2003, 75, 3986–3993 CrossRef CAS.
- J. P. Quirino and S. Terabe, Science, 1998, 282, 465–468 CrossRef CAS.
- X. Y. Xu, Z. M. Jia, Y. Shu and L. H. Liu, J. Chromatogr. B: Anal. Technol. Biomed. Life Sci., 2015, 980, 20–27 CrossRef CAS.
- V. Datinská, I. Voráčová, U. Schlecht, J. Berka and F. Foret, J. Sep. Sci., 2018, 41, 236–247 CrossRef.
- A. G. Crevillen, M. de Frutos and J. C. Diez-Masa, Microchem. J., 2017, 133, 600–606 CrossRef CAS.
- M. L. Wu, W. J. Chen, G. Wang, P. G. He and Q. J. Wang, Food Chem., 2016, 209, 57–161 CrossRef.
- Y. Zhang, Y. Zhang, G. Wang, W. Chen, Y. Li, Y. Zhang, P. He and Q. Wang, J. Chromatogr. B: Anal. Technol. Biomed. Life Sci., 2016, 1025, 33–39 CrossRef CAS.
- P. Britz-McKibbin, T. Ichihashi, K. Tsubota, D. D. Y. Chen and S. Terabe, J. Chromatogr. A, 2003, 1013, 65–76 CrossRef CAS.
- T. Hirokawa, H. Okamoto and B. Gaš, Electrophoresis, 2003, 24, 498–504 CrossRef CAS.
- J. P. Quirino and S. Terabe, Anal. Chem., 2000, 72, 1023–1030 CrossRef CAS.
- J. B. Kim, K. Otsuka and S. Terabe, J. Chromatogr. A, 2001, 932, 129–137 CrossRef CAS.
- J. M. Busnel, N. Lion and H. H. Girault, Electrophoresis, 2008, 29, 1565–1572 CrossRef CAS.
- M. Dawod, M. C. Breadmore, R. M. Guijt and P. R. Haddad, J. Chromatogr. A, 2008, 1189, 278–284 CrossRef CAS PubMed.
- M. Dawod, M. C. Breadmore, R. M. Gujit and P. R. Haddad, J. Chromatogr. A, 2009, 1216, 3380–3386 CrossRef CAS.
- M. M. Meighan, M. Dawod, R. M. Guijt, M. A. Hayes and M. C. Breadmore, J. Chromatogr. A, 2011, 1218, 6750–6755 CrossRef CAS.
- Z. Xu, K. Nakamura, A. R. Timerbaev and T. Hirokawa, Anal. Chem., 2011, 83, 398–401 CrossRef CAS PubMed.
- Q. Zhu, Q. Zhang, N. Zhang and M. Gong, Anal. Chim. Acta, 2017, 978, 55–60 CrossRef CAS.
- M. Wang, G. T. Roman, K. Schultz, C. Jennings and R. T. Kennedy, Anal. Chem., 2008, 80, 5607–5615 CrossRef CAS.
- M. Wang, G. T. Roman, M. L. Perry and R. T. Kennedy, Anal. Chem., 2009, 81, 9072–9078 CrossRef CAS.
- Q. Zhang and M. Gong, J. Chromatogr. A, 2014, 1324, 231–237 CrossRef CAS.
- Q. Zhang, N. Maddukuri and M. Gong, J. Chromatogr. A, 2015, 1414, 158–162 CrossRef CAS.
- N. Maddukuri, Q. Zhang, N. Zhang and M. Gong, Electrophoresis, 2017, 38, 507–512 CrossRef CAS.
- Q. F. Zhu, Q. Y. Zhang, N. Zhang and M. J. Gong, Anal. Chim. Acta, 2017, 978, 55–60 CrossRef CAS PubMed.
- F. Opekar and P. Tuma, J. Chromatogr. A, 2017, 1480, 93–98 CrossRef CAS.
- Q. Zhu, N. Zhang and M. Gong, Anal. Methods, 2017, 9, 4520–4526 RSC.
- P. De Montigny, J. F. Stobaugh, R. S. Givens, R. G. Carlson, K. Srinivasachar, L. A. Sternson and T. Higuchi, Anal. Chem., 1987, 59, 1096–1101 CrossRef CAS.
- P. Tuma, M. Sustkova-Fiserova, F. Opekar, V. Pavlicek and K. Malkova, J. Chromatogr. A, 2013, 1303, 94–99 CrossRef CAS PubMed.
- R. T. Kennedy, J. E. Thompson and T. W. Vickroy, J. Neurosci. Methods, 2002, 114, 39–49 CrossRef CAS.
- M. T. Bowser and R. T. Kennedy, Electrophoresis, 2001, 22, 3668–3676 CrossRef CAS.
| This journal is © The Royal Society of Chemistry 2020 |

