
 Open Access Article
 This Open Access Article is licensed under a Creative Commons Attribution-Non Commercial 3.0 Unported Licence
Microbioreactor for lower cost and faster optimisation of protein production†
Mayur
Parekh
 a,
AbdulAziz
Ali
a,
Zulfiqur
Ali
*a,
Simon
Bateson
a,
Fathi
Abugchem
a,
Leon
Pybus
b and
Christopher
Lennon
b
a,
AbdulAziz
Ali
a,
Zulfiqur
Ali
*a,
Simon
Bateson
a,
Fathi
Abugchem
a,
Leon
Pybus
b and
Christopher
Lennon
b
aHealthcare Innovation Centre, School of Health and Life Sciences, Teesside University, Middlesbrough, Tees Valley TS1 3BX, UK. E-mail: z.ali@tees.ac.uk
bFUJIFILM Diosynth Biotechnologies, Belasis Avenue, Billingham, TS23 1LH, UK
First published on 21st August 2020
Abstract
Optimisation of bioprocesses relies on approaches that are either labour intensive or require expensive robotic systems. There is a need for fluidic processing at low volume that can be integrated with existing bioprocess analytics to provide analytical information for the development and optimisation of bioprocesses. We demonstrate a 1 mL polymer inkjet 3D printed (i3DP) microbioreactor with integrated sensing (pH, oxygen and cell density) for optimisation of recombinant protein production with different feeds. A pressurised fluid driving system was used to control flow rates down to 0.7 μL min−1 with fluid switching from four reservoirs using a manifold controlled by solenoid valves. Oxygen transferred from a headspace via a gas-permeable membrane achieved a kLa of up to 90 h−1 at 1500 rpm. Cultivation of E. coli within the microbioreactor was comparable with a 2 L bench scale bioreactor, with optical densities of respectively 7.1 ± 0.4 and 6.5 ± 0.35. Triplicate batch cultivations within the microbioreactor of Pichia pastoris, with diauxic growth on glycerol (0.20 ± 0.02 h−1) and methanol (0.02 ± 0.04 h−1), showed good control of pH and DO and achieved a maximum dry cell weight of 10 ± 1 g L−1. For continuous cultivations, recombinant protein production was higher in pure methanol (314 ± 23) than methanol-sorbitol (202 ± 17) but reduces over time with lower cellular viability for methanol-glucose mixed feed, with less total protein produced and increases in DNA and proteases released. The developed system could be used in different applications including within synthetic biology, cell and gene therapy and organ-on-chips.
Introduction
Cell culture derived biotherapeutics are important for the development of new medicines. A frequent requirement in the development of a bioprocess is initial screening of production strains, growth medium and production strategy (e.g. feeding strategy for recombinant protein production). Variations in bioprocess parameters can change the molecular and cellular response of cells to the media that can affect product yield, quality and production costs. It is, therefore, important to understand the main factors that produce high concentrations of recombinant proteins, and to be able to control the culture conditions during the bioprocess.1 This can involve large numbers of initial batch experiments in a combinatorial experimental design, followed by iterative strain and process development. Current approaches, which typically use shake flask or micro-titre plates, are often limited to single point measurements as well as being labour intensive, time consuming and expensive. There is a limited ability to learn optimised process parameters for process development and production scale up. The choices made in these experiments either remain fixed in the final process and/or entail expensive changes in process parameters at a larger scale. There is therefore a need for the development of new tools that can dramatically speed up the bioprocess.There is increasing effort on the development of miniaturised bioreactors, typically at the milliliter (mL) scale, as part of a broader drive to increase the chemical and biological information about bioprocesses.2,3 Previously, we have used an ultra-low-cost approach with a simple PTFE tube and a syringe pump for inoculum and nutrient feed.4,5 The large surface area to volume ratio can offer rapid heat and mass transfer, but the approach is limited in the complexity of bioprocessing and had no integrated sensing. Buchenauer et al.6 developed an array of microbioreactors based on microtiter plates, the reactor comprising four reaction wells and two reservoirs to provide the feed and pH control. Pressure connections on the reservoirs and pneumatically actuated valves underneath the reservoirs and reaction wells move fluid from the reservoirs to the reaction wells. A drawback to this approach is that mixing requires the microbioreactor to be placed on a shaker; more sophisticated fluid handling would require an external liquid handling system. Microtiter plate-based systems are limited to batch and fed-batch cultivation.
Continuous culture, providing precise control with a uniform environment, has the potential to reduce manufacturing cost and facility size whilst improving product quality.7 Chemostats enable the cultivation of microbes in growth controlled steady state conditions and can be used for different applications such as metabolic flux analysis, physiological studies – different growth rate of microorganism with different nutrient limiting condition8 – and functional genomics. Continuous cultivation provide precise control of substrate limitation as selective pressure that can be used to study evolution of molecular networks.9,10 The main feature of the continuous culture is that it can control the cell growth rate by changing the dilution rate (D) i.e. the ratio of the flow rate divided by the cultivation volume.
Parallel cultivations at the 10 mL scale have been carried out using a single-use stirred tank bioreactor with gas-inducing impellers and a headspace of sterile air saturated with water.11 The approach offers high oxygen transfer but there is a requirement for a separate liquid handling system with associated size and cost. An alternative approach of pneumatic bubble aeration has been demonstrated within a multiphase microbioreactor for batch cultivation of Saccharomyces cerevisiae.12 A microfluidic device has been demonstrated for perfusion culture of yeast cells for continuous production of invertase.13 The device was operated over a 32 h period, with limitations on the operation time from microbiological contamination and the viability of cells within a stationary phase culture. Moreover, it should be noted that the cell microenvironment is different to the macroscale environment; this may lead to differences in the cell behaviour. Other interesting approaches have been taken including a digital microfluidic system for culturing of mammalian cells over four days using impedance measurements to determine proliferation.14 More generally, there is considerable potential for use of electrochemical detection within microfluidic microbioreactor systems.15
Polydimethylsiloxane (PDMS) has a number of favourable properties for the development of microfluidic devices for cell culture including biocompatibility and transparency.16 We have previously used PDMS for the integration of normally closed pneumatically actuated valves within a microfluidic device to allow sophisticated processing for culturing of cells for cytotoxicity assay.17 PDMS is widely used for prototyping of microfluidic devices but has thus far been less amenable for high volume manufacturing. We have shown the potential for the development of low-cost polymer microfluidic devices using high volume roll-to-roll manufacture, or other sheet processes, along with other high replication approaches such as hot embossing.18 Recently, additive manufacturing, or 3D printing, has gained significant interest for prototyping products.19,20 One particularly interesting approach is that of inkjet 3D printing (i3DP) which uses an array of inkjet print heads to deposit small drops of both build and support materials in a layer-by-layer fashion to form the object. Although there is increasing interest in using 3D printing, examples of use for microbioreactor systems are sparse.
Microbial continuous culture has been demonstrated in a polymer-based microfluidic microbioreactor, which is aerated through a polydimethylsiloxane (PDMS) membrane and having integrated optical density (OD), pH and dissolved oxygen (DO) measurements for prolonged cultivation of E. coli.21 Lee et al.22 have used microfabrication processes with PDMS valves on rigid plastics to develop an elegant microbioreactor, with a 1 mL working volume, that integrates multiple fluid inputs and outputs, on-chip peristaltic pumping and an oxygenating peristaltic mixer. This offers control of fluids, oxygen and mixing for flexible applications within synthetic biology and programmable production of biologics.23 The approach does, however, inherently require a complicated microfluidic chip design as well as considerable additional external peripherals. Despite these significant earlier contributions in the development of microbioreactors and their potential advantages they remain little used for bioprocessing. There are a number of challenges that remain including: flexibility for different applications; ease of use; cost; comparability with larger scale bioreactors; and incorporation as part of existing bioprocessing operations such as downstream analytics.
Continuous cultivations provide constant and defined culture conditions. Within these, the effect of a single parameter such as nutrient concentration, media composition, pH or temperature on cell growth and protein production can be studied in relation to the growth rate.24 Here we report a 1 mL microfluidic microbioreactor fabricated using i3DP but amenable to high volume manufacturing processes such as micro-injection moulding, to increase the volume of devices produced and reduce the overall cost. The microbioreactor system has been designed to be relatively simple so that the cost of manufacturing can be reduced. This has been achieved by using a modular system where the different elements are connected and perform different functions. The microfluidic manifold element is used to carry out fluidic manipulation, with non-disposable hardware elements, using a pressure driven system. The cultivation is carried out within a microbioreactor element where the different layers perform different functions e.g. of sensing, fluid storage or gas exchange. The developed microfluidic microbioreactor system has been demonstrated for batch and continuous cultivation of Escherichia coli and Pichia Pastoris (P. pastoris). The latter has requirement for high oxygen transfer and grows to high cell density. Our microfluidic microbioreactor system is comparable with larger scale bench scale bioreactors and can be used with existing downstream analytics to investigate feeding strategies and gain valuable bioprocess information.
Experimental
Microbioreactor element
The microbioreactor (1 mL) element (Fig. 1A/B, inset) comprises three functional layers including a bottom sensor layer for optical sensor dye attachment and a middle fluidic layer with a microbioreactor cultivation chamber. The design of the cultivation chamber was kept as simple as possible to avoid complex manufacturing steps. The top layer, which sits on a gas permeable membrane and provides a lid for the fluidic layer cultivation chamber, has a headspace chamber for the supply of oxygen to the cultivation chamber and an optical port for biomass measurement. The optical sensing layer incorporates sensor spots for DO and pH (EOM-tO2-mini and EOM-pH, Presens, Precision sensing, Germany), that are joined to a poly(methyl methacrylate) (PMMA) substrate using adhesive. The fluidic layer has a diamond shaped cultivation chamber which incorporates a stainless-steel stirrer bar, with a centre O-ring, as well as a microchannel at the inlet (500 × 600 μm) and outlet (500 × 750 μm) for injecting the desired working solution and collection of supernatants. To maintain a constant culture volume, the top headspace layer has a mesh structure which supports the gas permeable membrane and prevents bulging. The fluidic and headspace layers were fabricated by i3DP (Objet24, Stratasys) and the different layers were joined by using a pressure sensitive adhesive tape (AR8932EE, Adhesive Research Inc.).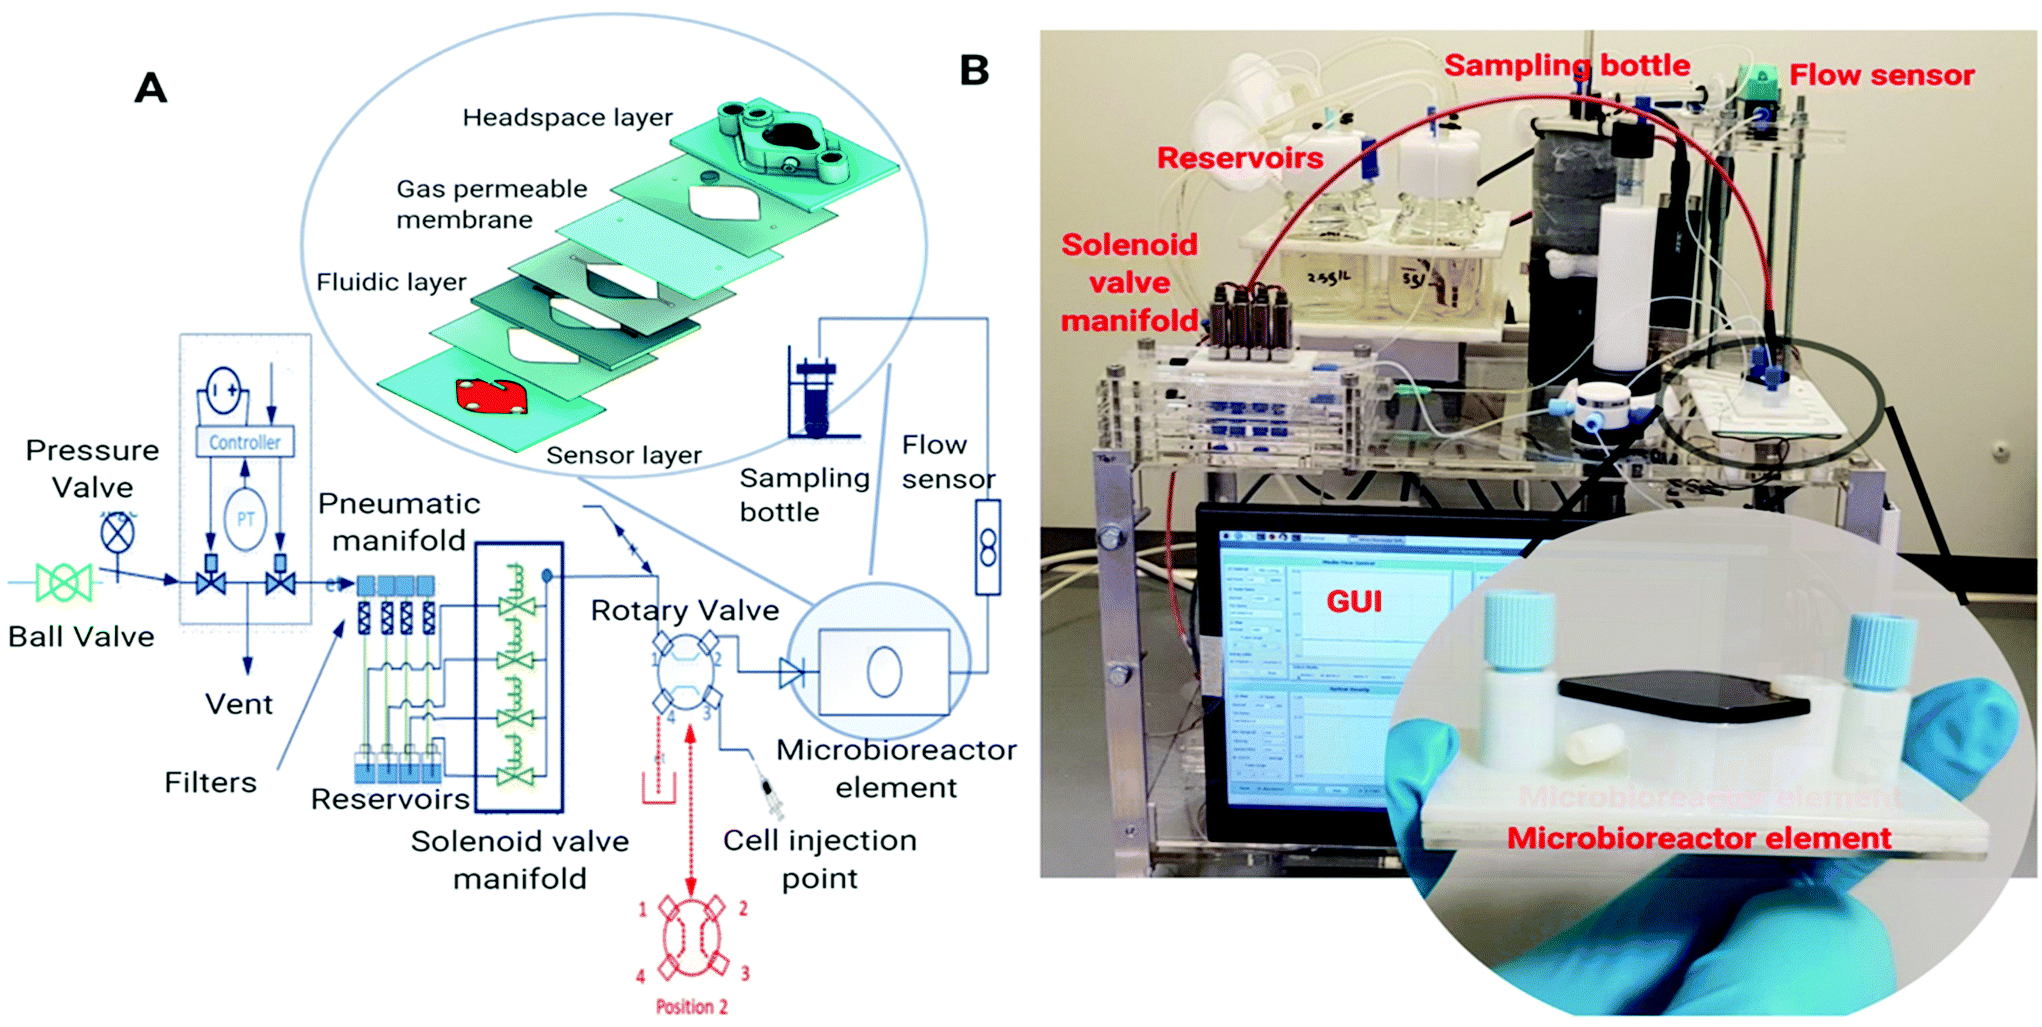 | ||
| Fig. 1 (a) Schematic for microbioreactor system. Inset, the microbioreactor element with different layers joined by pressure sensitive adhesive and the bottom sensor layer comprising sensor spots (pH and DO) and OD measurement window. The fluidic and headspace layers fabricated using i3DP (b) photograph of the microbioreactor system showing pressurised fluid driving system with media reservoir bottle, solenoid valve for media selection, cell injection port, flow sensor, sample collector and inset the microbioreactor element. | ||
Microbioreactor control platform
The microbioreactor control platform (Fig. 1B) provides fluidic control using a pressurised system with flow measurement and PID control for the delivery of cell culture media and reagents. A Raspberry Pi with a GUI is used for control and monitoring of the key parameters including the fluid flow rate, pH, oxygen, optical density and temperature. The OD, pH and DO are recorded through the GUI and the DO is fed back through a PID control algorithm in the GUI to control oxygen flow to the headspace layer above the microbioreactor.The fluid driving system uses a compressed air source (0.1 MPa) which is connected to an electronic pressure regulator. This controls the pressure in each of the media reservoir elements and provides the dynamic control that is necessary as the reservoir level varies with the cultivation time. An ADAM module generates the electrical signal from 0 to 5 V for the pressure regulator and the resulting flow rate is monitored using a flow sensor (SLI 0430). An i3DP printed fluidic manifold with normally closed solenoid valves and a four-way rotary valve controlled by the GUI was used for fluidic selection and continuous feeding of media for cultivation.
Optical Density was monitored using a 600 nm LED source (HLMP-C423, Broadcom, San Jose) and photodiode (VTB8441BH, Excelitas Technologies, Massachusetts) connected to a previously described lock-in photometer25 connected via PMMA optical fibres (Thorlabs, UK, cat. no. M29L01) this allowed linear correlation between OD and dry cell weight (g L−1) change all up to 15 g L−1 (see ESI†). Further optical fibres (Presens) were used for excitation and emission collection from the DO and pH sensor spots. The temperature was controlled using an ITO glass heater plate (Cell Microcontrols, Norfolk, US, cat. no. HI 711Dp) with digital mTCII 2 channel micro-temperature controller (Cell microcontrols, Norfolk, US). Microbioreactor supernatant samples were collected in 2 mL Eppendorf tube that was held in a Peltier cooler.
Mixing within the microbioreactor was studied using a fluorescent dye visualisation technique26 where the growth chamber was first filled with distilled water followed by injection of green fluorescein dye solution (10 μL, 1 mg mL−1 fluorescein) using a syringe pump. A digital camera (Xacti VPC-GC10, SANYO, Japan) was used to assess the mixing time and the captured videos were analysed frame by frame by converting into image by software (Free Video to JPG Converter v.2.1.2). The time required for the filled dye to be completely mixed was recorded as the mixing time.
Strains and media
P. pastoris CLD804 Mut+ Aprotinin and E. coli BL21 pAVE265 hel4 was gift from Fujifilm Diosynth Biotechnologies (Billingham, UK). E. coli BL21 pAVE265 hel4 contains TetR (Tetracycline resistance) gene and is maintained in defined medium with 10 μg mL−1 tetracycline to avoid the loss of the plasmid, whereas P. pastoris strain maintenance was carried out in buffered minimal glycerol complex media with Zeocin (100 μg mL−1) as selection marker for sterility during cultivation. Cultivation with E. coli in microbioreactor was achieved in LB media. LB medium was composed of 5 g L−1 yeast extract (Fisher scientific, UK), 0.5 g L−1 NaCl and 10 g L−1 tryptone (Fisher scientific, UK). The solution was sterilised by autoclaving at 121 °C and 150 psi for 15 min. The LB medium was supplemented with 10 μg mL−1of tetracycline (Sigma Aldrich, UK). For Pichia pastoris, the media used included, 0.02% biotin (Merck, cat. no. B4501), 10XGY glycerol (Merck, UK, cat. no. G5516) and 10X Yeast Nitrogen Base (YNB) (Millipore, UK, cat. no. 51483) and buffered minimal glycerol media (BMGY) (see ESI†).Biocompatibility studies of i3DP material
The biocompatibility of verowhiteplus (RGD835) i3DP material was evaluated by direct and indirect cultivation of different cells and microorganisms. Parts were printed using Objet24 (Stratasys) i3DP, prepared for biocompatibility studies (see ESI†) and evaluated using both direct and indirect cultivation. For direct cultivation, E. coli and S. cerevisiae were cultured in i3DP shake flask and compared with a control glass shake flask. For indirect cultivation, mammalian strains, J774 and CHO (Chinese hamster ovary) cells, were cultured with extracted medium of i3DP verowhiteplus part and cell viability was measured by MTT assay and the growth curve determined (detailed description in ESI†).Cultivation with E. coli
All relevant parts of the microbioreactor platform, including the microbioreactor element, were sterilised (ESI†). The medium was pumped through the microbioreactor to remove air and filled with media for OD measurement before starting experiment. A frozen vial of E. coli BL21 pAVE265 hel4 was thawed in 25 mL LB medium containing 10 mg L−1 of tetracycline (Sigma Aldrich, UK, cat. no. T7660) in shake flask and incubated overnight at 37 °C. Samples were removed occasionally and measured for OD at 600 nm. The cell culture was removed from the shake flask when the OD of the cultures reached between 1–2. This was then transferred to a 250 mL shake flask (50 mL) containing fresh medium with initial OD of 0.05 and incubated on shakers (200 rpm) at 37 °C. Samples were removed occasionally until the OD within the flasks reached 2–3 and at this point the microbioreactor was inoculated with the culture. The batch mode was started after setting all the required process parameters for cultivation. The initial cultivation conditions are pH, 6.9–7.1; aeration, 0–25 mL min−1 oxygen; stirring, 1200 rpm; temperature, 37 °C; and glucose as a carbon source. Batch cultivation of E. coli within the microbioreactor was compared with cultivation within a 2 L working volume bioreactor (ez2 control, Applikon Biotechnology Ltd) using modified LB media. During cultivation the pH was controlled at 6.9, temperature at 37 °C, and DO maintained above 50%.Batch and continuous cultivation of Pichia pastoris
A frozen vial of P. pastoris CLD804 Aprotinin was thawed in 5 mL BMGY or defined medium containing 100 mg L−1 of Zeocin (Thermo Fisher Scientific, UK, cat. no. R25001) in a test tube and incubated overnight at 30 °C. The OD at 600 nm was monitored until the culture reached 1–2. It was then transferred to 50 mL of fresh medium (250 mL shake flask) with a starting OD of 0.2. The inoculated shake flasks were incubated on shakers (225 rpm) at 30 °C. OD was monitored until the OD within the flasks reached 6–10. At this point, the culture was used to inoculate the microbioreactor. Batch cultivation is started with initial conditions of pH: 6.9–7.1, aeration: 0–25 mL min−1 oxygen, stirring: 0–1800 rpm, 0.652 C mol L−1 glycerol and methanol (50% C mol C mol−1 glycerol-methanol) as a carbon source, temperature: 30 °C. Stirring rate and aeration were automatically controlled according to the amount of dissolved oxygen available during the cultivation. Completion of the batch phase was followed by continuous cultivation of P. pastoris at a 0.07 h−1 dilution rate using three different media with different carbon source, specifically: 100% methanol C mol (0.652 C mol L−1); 50% methanol sorbitol C mol C mol−1 (0.652 C mol L−1) and 50% methanol glucose C mol C mol−1 (0.652 C mol L−1).Analytics
Sodium dodecyl sulphate-polyacrylamide gel electrophoresis (SDS-PAGE) electrophoresis was used for determination of release of aprotinin protein from P. pastoris CLD804 cultivation (see ESI†). The Bradford assay (Bio-Rad protein assay) was used to quantify total secreted protein in supernatant using a Nanodrop One (Thermo Fisher Scientific, UK) by measuring absorbance at 595 nm. The total DNA released during the cultivation of P. pastoris CLD804 aprotinin was measured using a Quant-iTTM PicoGreen® dsDNA reagent assay kit from Invitrogen (Paisley, UK, cat. no. P7589). Fluorescence was measured using a Qubit 4 fluorometer (Invitrogen, UK) with excitation and emission at respectively 480 nm and 520 nm and the DNA concentration in the samples determined from a standard calibration curve. The protease released into the cell culture supernatant was quantified using a Pierce® fluorescent protease assay kit (Thermo Fisher Scientific, UK, cat. no. 23266) and determination of fluorescence in a similar manner as for the DNA quantification. Analysis of the substrate and metabolites was carried out by first collecting the culture sample in an Eppendorf kept at 0–4 °C in sample holder and stored at −20 °C. Methanol was determined by YSI (Yellow Spring Instruments, UK). Cedex Bio HT analyser (Roche Diagnostics, Germany) was used to determine the glucose, acetate and ammonia concentrations. Sorbitol in supernatant was determined by colorimetric assay kit (Abcam, UK, cat. no. ab118968) and the absorbance was measured in microwell plate at 560 nm.Results and discussion
Microfluidic microbioreactor system
The microbioreactor system, with use of a lower working volume, offers inherent advantages of reduced cost of reagents compared with a bench scale bioreactor. As an example, the cost of media for batch cultivation of E. coli within a 2 L bench scale bioreactor is around £5 whilst this is around 0.25p for the microbioreactor system, so a 2000 fold reduction in cost. For more specialist and expensive media this saving can be more significant particularly when a large number of experiments need to be performed. Moreover, there are some advantages of speed, a bench scale bioreactor can take 12–14 h for sterilisation and assembly whilst our system can be assembled and ready to use within three hours. To reduce the cost and increase reliability of the microbioreactor system itself we have designed this to minimise complexity. The microbioreactor cultivation element was developed using a layered approach with each layer having a particular function and joined using a biocompatible pressure sensitive adhesive. Fabrication of the fluidic microbioreactor chamber and top headspace layers was carried out using i3DP which allows development of a part directly from a digital design without the need for expensive masks or moulds. Use of i3DP has further advantages of high-resolution features, since the build layers can be 16 μm, and also allows use of multiple materials with different physical properties. A drawback, however, is that i3DP uses new materials where the biocompatibility with biological materials are less well understood. Although we have used i3DP for development of the microbioreactor element, the design is amenable for volume manufacturing, with e.g. micro-injection moulding or roll-to-roll manufacturing, to reduce cost.The fluid driving system was able to control flow rates to 0.7 μL min−1 for continuous operation with a flow operating range of 0 to 80 μL min−1 (Fig. 2A). Oxygenation could be achieved without bubbling oxygen into the microbioreactor chamber which would have made optical measurements and microfluidic operations more difficult. The DO levels were generally maintained at the desired range around 30–50% saturation even though the concentration range of oxygen that is demanded through the growth phase is wide and makes control difficult. Incorporation of a micro stirrer bar within the microbioreactor chamber provided a simple means of achieving mixing to prevent attachment of cells to the sensor elements. This simplifies the microbioreactor design and reduces the overall microbioreactor cost. Increasing the stirrer speed created chaotic and effective mixing, without generating any dead zones, which keeps microbial cells in suspension for several days. Mixing was assessed at different stirring speeds, with higher stirring speeds leading to an increase in turbulence and a decrease in the mixing times; for 300 rpm and 1500 rpm the mixing time was respectively 11–12 and 0.42 seconds (see ESI†).
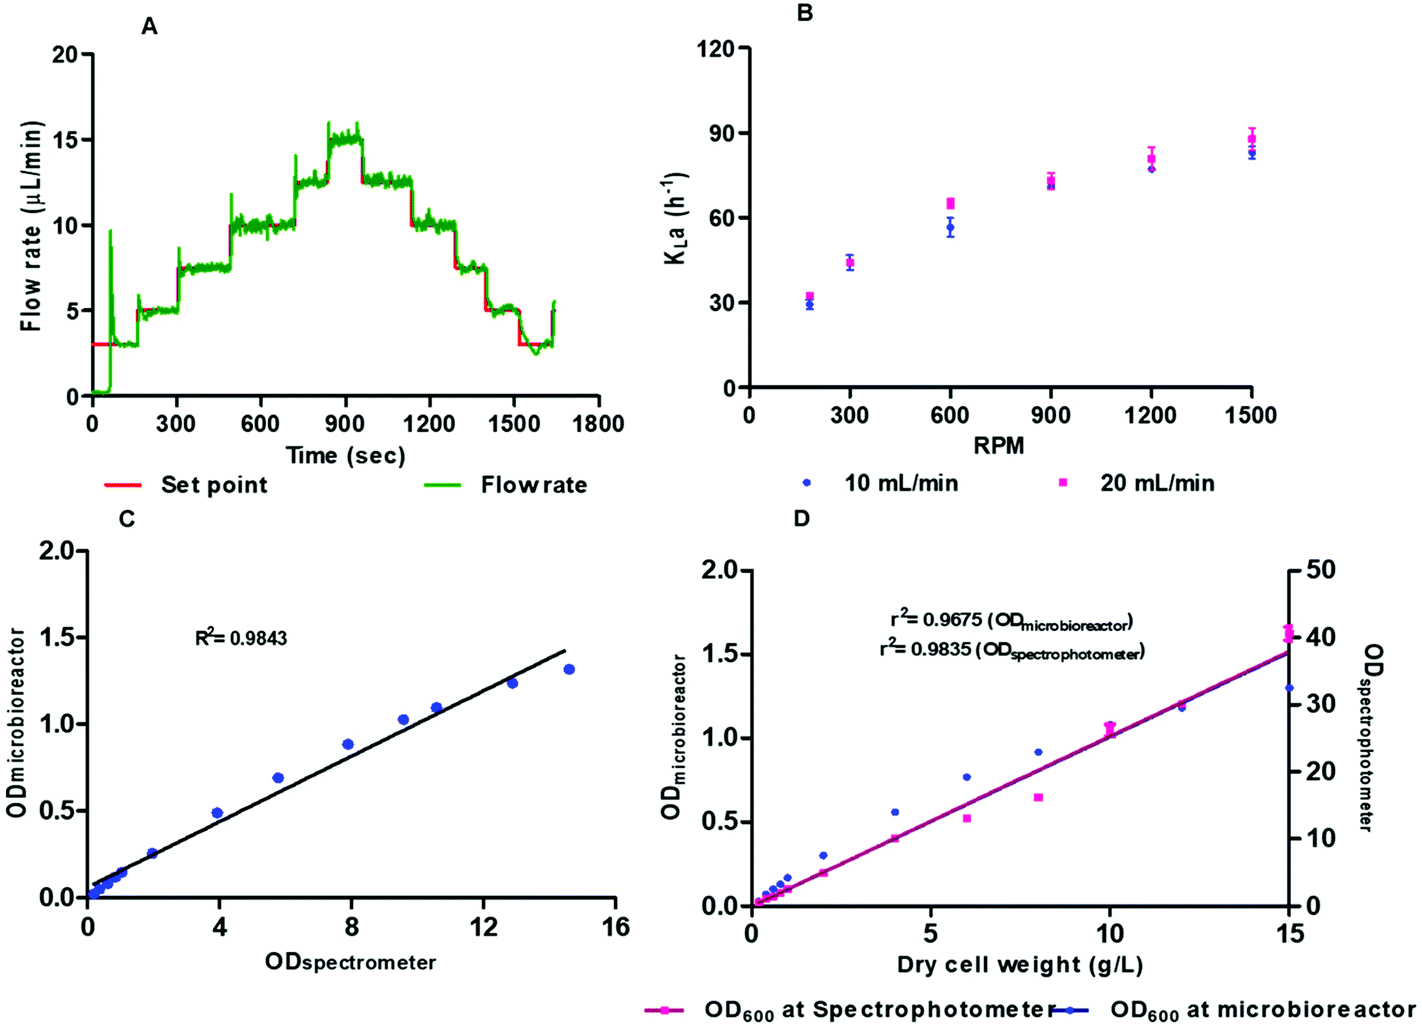 | ||
| Fig. 2 (a) Time response of the flow controller, requires less than 10 s for stabilisation (b) volumetric oxygen transfer coefficient-kLa measured with 100 μm thick gas permeable membrane at different rpm in microbioreactor at two different air flow rate 10 and 20 mL min−1; oxygen transfer can be increase with increasing mixing speed, (c) calibration curve of optical density for E. coli at different concentrations measured at 600 nm using standard spectrophotometer and microbioreactor, (d) calibration curve of DCW of P. pastoris cell culture at 600 nm wavelength measured at microbioreactor with in-built sensor. Measurements were performed for different sample concentration ranging between 0 and 15 g L−1 DCW using microbioreactor and standard spectrophotometer. | ||
Biomass concentration, determined from the OD measurements at 600 nm, is a critical bioprocess parameter for monitoring of cell growth and evaluation of the effect of different bioprocess environments. The OD measurements rely on scattering of light by the cells to change the transmission properties of the medium. There is a need to correlate higher cell density biomass with scattered light intensities. Fig. 2C and D shows a comparison of the OD measurements within the microbioreactor system and a spectrometer for E. coli and Pichia pastoris. Fig. 2C shows the calibration curve for E. coli cell density at 600 nm wavelength for 0–15 OD with R2 0.9843. Fig. 2D shows the calibration curve of optical density determined in microbioreactor and dry cell weight (g L−1) with correlation of OD with a spectrophotometer. The OD measured in the microbioreactor shows linear correlation up to 12 g L−1 with R2 0.9675 but measurement resolution and linearity declines with increased cell biomass. The P. pastoris calibration curve with known concentrations show that the measurements are within the linear region before OD readings are saturated. We conclude that real time on-line monitoring of cell growth is appropriate and allows continuous bioprocess monitoring without the need for sampling and associated labour costs. It should, however, be noted that OD represents total cells, both dead and live, and there needs to be an individual calibration for each strain and cell type since light scattering relies on the shape and size of the cells.
Oxygen transfer efficiency
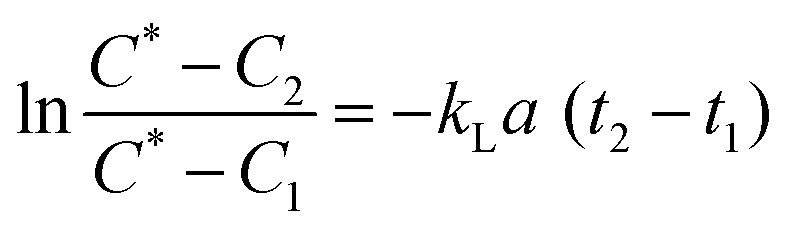
Oxygen is a critical requirement for all bioprocesses which are mostly carried out in aqueous media and where the solubility of O2 is lower due to the presence of ions and nutrients. The oxygen transfer rate (OTR) is used to study growth behaviour of microbial and mammalian cell culture during a bioprocess.27,28 The OTR can be defined as proportional concentration gradient known as volumetric mass transfer coefficient, kLa. It is difficult to measure kL (liquid side mass transfer coefficient) and a (interfacial area) separately, hence the product volumetric mass transfer coefficient (kLa) is measured.29 OTR is affected by a number of parameters including: temperature; pressure; aeration; mixing; viscosity of medium; geometry of bioreactor; concentration of ions; and the metabolic activity of the culture. The measurement of kLa for bioreactors or microbioreactors is essential for characterising aeration efficiency and DO level.The gassing out technique,30,31 was used to determine the maximum oxygen transfer. The microbioreactor was first filled with deionised water without the microorganism with nitrogen being passed into the headspace chamber over the gas permeable membrane until the DO level in the water was at zero for 2 to 3 min. At this point air was then introduced into the headspace chamber and the increase in the DO level was recorded by the optical sensor every 15–20 s until the DO reached 100% and stabilised. The kLa values were calculated from eqn (1)
 | (1) |
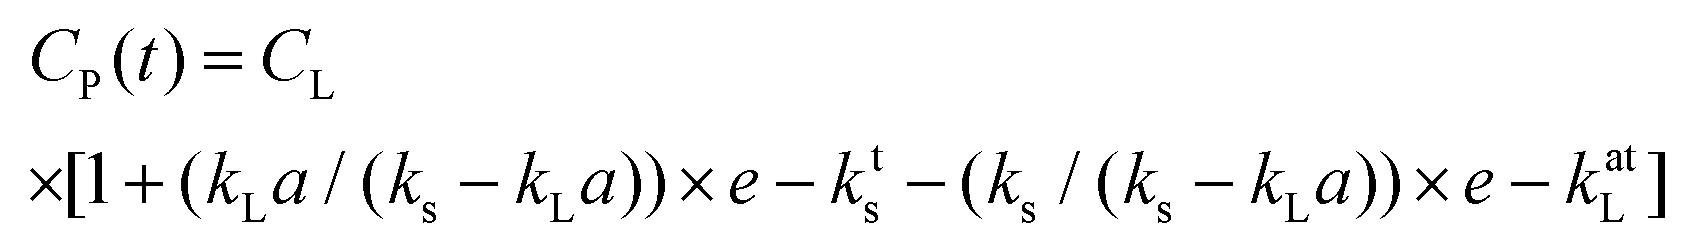
The response time of sensor, Ts, is important for accurate DO measurements. eqn (1) is assumed to follow first order and is applicable when the response time of the DO sensor (18 s) is ≪1/kLa, as is the case here, this allows accurate values to be obtained without the need to take into account the sensor response time.32 If, however, the time characteristic for the oxygen transport, 1/kLa, is of the same order as the response time of the sensor then this can affect the real value of kLa and requires compensation by addition of the sensor dynamics which can be characterised by the full expression within eqn (2)33:
 | (2) |
The kLa was measured for 100 μm thick gas permeable membrane at different stirring speeds, from 180 to 1500 rpm, and with aeration rates of 10 mL min−1and 20 mL min−1 (Fig. 2B). The DO sensor spots have response time of 18 s. The kLa was found to be in the range from 29 to 82 h−1 and 32 to 89 h−1 for mixing speeds between 180 to 1500 rpm for respectively 10 and 20 mL min−1. The small increase in the kLa values arises from the higher flow rate (20 mL min−1) helping to overcome some limitation of diffusion through the membrane. To ensure that there is sufficient oxygen to support the cells and avoid oxygen depletion then the maximum oxygen transfer capacity, calculated from kLa × cL, should be bigger than oxygen uptake rate (OUR). The oxygen saturation concentration at 37 °C was assumed to be at the standard value of 0.21 mmol L−1 which is likely to be overestimated due to presence of dissolved salts in the medium.34 The OTRmax was found to be 17.22 mmol L−1 h−1 to 18.69 mmol L−1 h−1 at 1500 rpm for respectively 10 and 20 mL min−1. These values were comparable to the kLa values of other microfluidic microbioreactor systems described in literature.22,26,35 We also found a 4.8-fold increase in kLa when pure oxygen was used for aeration instead of air. The influence of thinner membrane (50 μM) was found to have a negligible effect on the kLa values when compared with the thicker 100 μM membrane. The thicker membrane also has the advantage of being more robust and therefore all cultivation experiments were performed with the 100 μM gas permeable membrane.
Biocompatibility
The biocompatibility of verowhiteplus i3DP materials was evaluated by direct and indirect cultivation of different cells and microorganisms. Verowhiteplus was tested using wild strains of E. coli and S. cerevisiae since these are the cells most commonly used for microbial research, because of their robust growth under different various conditions, and if it is not suitable for these organisms then it is also unlikely to be suitable for other organisms. Fig. 3A and B shows that the growth behaviour of E. coli and S. cerevisiae in the i3DP shake flask is comparable to that of a control (glass) shake flask and there are no significant measurable negative effects of verowhiteplus for microbial culture.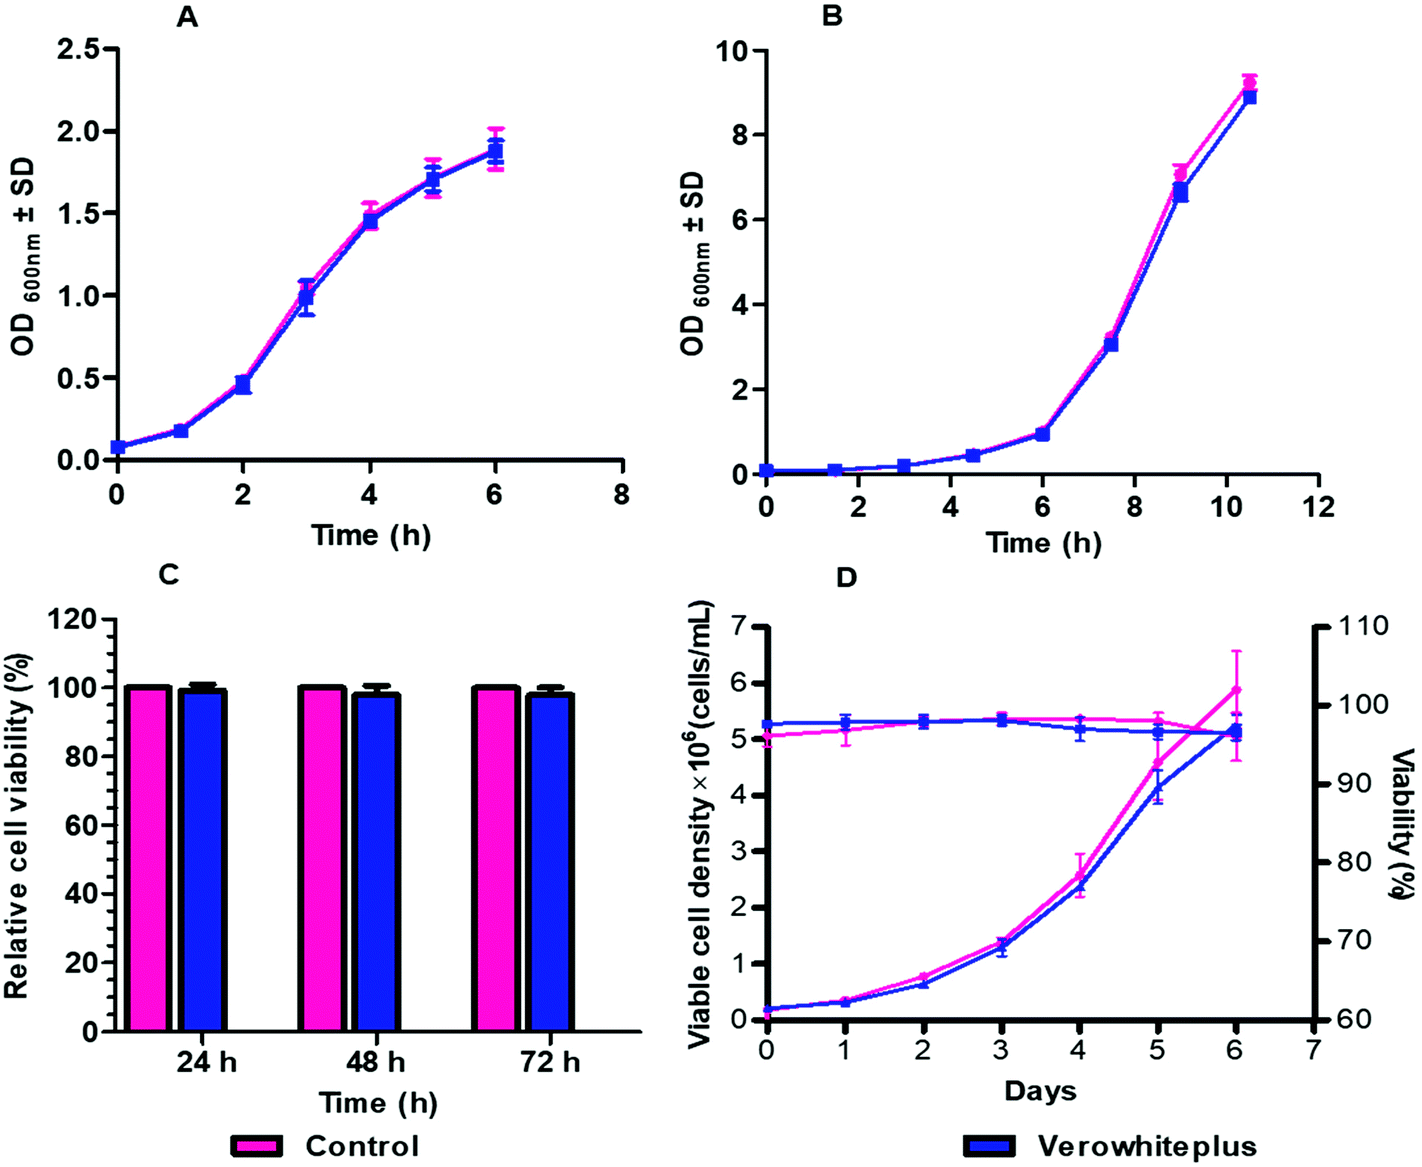 | ||
| Fig. 3 Results of (a) E. coli and (b) S. cerevisiae cultivation in 3d printed shake flask and control (glass shake flask) at 37 °C and 180 rpm, (c) relative cell viability (%) of j 774 macrophage cells grown in verowhiteplus extracted dmem media compared to the control (normal media) (d) comparison of viable cell density and % viability of cho cells cultured in extracted medium of verowhiteplus material with control (n = 3, error bars indicate the sd of the experiments). | ||
The viability of mammalian cells was assessed by indirect cultivation over extended period of culture using extracted medium from the verowhiteplus i3DP part. The (3-[4,5-dimethylthiazole-2-yl]-2,5-diphenyltetrazolium bromide (MTT) assay was performed to determine the toxic effect of any leachable materials from the i3DP parts when cells were grown in presence of extracted DMEM media (Fig. 3C). The MTT reagent is reduced by viable cells into insoluble formazan salt which provides a measure of the metabolic activity and the associated cell viability. The J774 macrophage show the same behaviour in cell viability (%) after being in contact with extraction media from the verowhiteplus i3DP printed part even after 72 h as compared with a control. The biocompatibility of verowhiteplus i3DP printed part was also tested against CHO cells, using verowhiteplus extracted CD OptiCHO medium and normal media as positive control, since these are widely used for recombinant protein production. It can be seen from Fig. 3D that the growth curve profile of CHO cells in the extracted medium is very similar to the growth profile of the control which indicates that the toxic effects of verowhiteplus material and adhesive tape on the cultivation of CHO cells may be small. The average specific growth rate and viability for verowhiteplus was 0.025 h−1 and above 96% compared with 0.027 h−1 and above 96% for the control. Moreover, the doubling time for verowhiteplus and control were found to be respectively 29.16 h and 25.19 h (ESI, Table 2†). These results indicated that verowhiteplus i3DP parts would have the necessary biocompatibility within our microbioreactor design for cultivation of mammalian and microbial cells. It should be noted that in our microbioreactor design, the sensor layer, which has the largest contact area with the media solution, uses native PMMA material and the media solution contacts a relatively small area of the verowhiteplus i3DP printed part. It has been shown previously that some photopolymers are toxic for zebrafish embryos36 and so it is important that the biocompatibility is ascertained for the photopolymer and application used.
Reproducibility of E. coli batch cultivation and comparison with bench scale bioreactor
E. coli BL21 was used for validation of the microbioreactor since this is widely used for production of biopharmaceutical proteins. Cultivations within the microbioreactor were performed in triplicate at 1200 rpm with defined medium in triplicate and with the values of pH, DO and biomass (OD) recorded every 10 seconds. The starting pH of the batch cultivation was 7.0 ± 0.1 and with no pH control being implemented. The temperature and stirring speed were kept constant whilst the DO was maintained through a feedback control loop to keep the concentration above 50%.Fig. 4 shows a comparison of cultivations of E. coli BL21 in modified LB medium within the microbioreactor and with a bench scale bioreactor. The E. coli cells start to grow immediately without any observable lag phase as opposed to growth in defined medium. There is a consistent high growth rate of the cells during exponential growth phase where the associated high demand for oxygen is shown by the rapid decrease in DO level in the culture medium. A high oxygen transfer capability is the main requirement for high cell density cultivation and is necessary for many bioprocesses. The reproducibility and scale-up of a microbioreactor to a conventional bench scale bioreactor are very important when considering the real utility of a microbioreactor as a high-throughput platform for bioprocesses. The bench scale cultivation was carried out in a 5 L, with a 2 L working volume, stirred tank bioreactor (ez2 control bundle, Applikon Biotechnology Ltd) using the same modified LB medium and strain at pH 6.9. The growth curve for the bench scale bioreactor was obtained by manually taking samples every 60 minutes and measuring the OD by performing dilution if OD is over 0.8. Fig. 4 shows a good agreement of growth profile obtained between microbioreactor and bench scale bioreactor, with the results being consistent for all replicates. The growth profile for the microbioreactor and large-scale bioreactor both show a lag phase of one hour and have comparable final cell optical densities. The microbioreactor (7.1 ± 0.4) showed a slightly higher OD than the 5 L bioreactor, 2 L working volume, (6.5 ± 0.35). It can be seen from Fig. 4A and B that there is only a small difference for the DO and OD profiles between the microbioreactor and the bench scale bioreactor even though the pH is uncontrolled for the microbioreactor – the pH reduced to 6.3 in the microbioreactor due to formation of acidic by-products which have a small impact on the E. coli culture itself. The ability to change mixing in the microbioreactor to different stirring speeds enables control of oxygenation and also allows varying growth kinetics ranging from shake flasks conditions to those characterized by conventional bench-scale stirred-tank bioreactors.
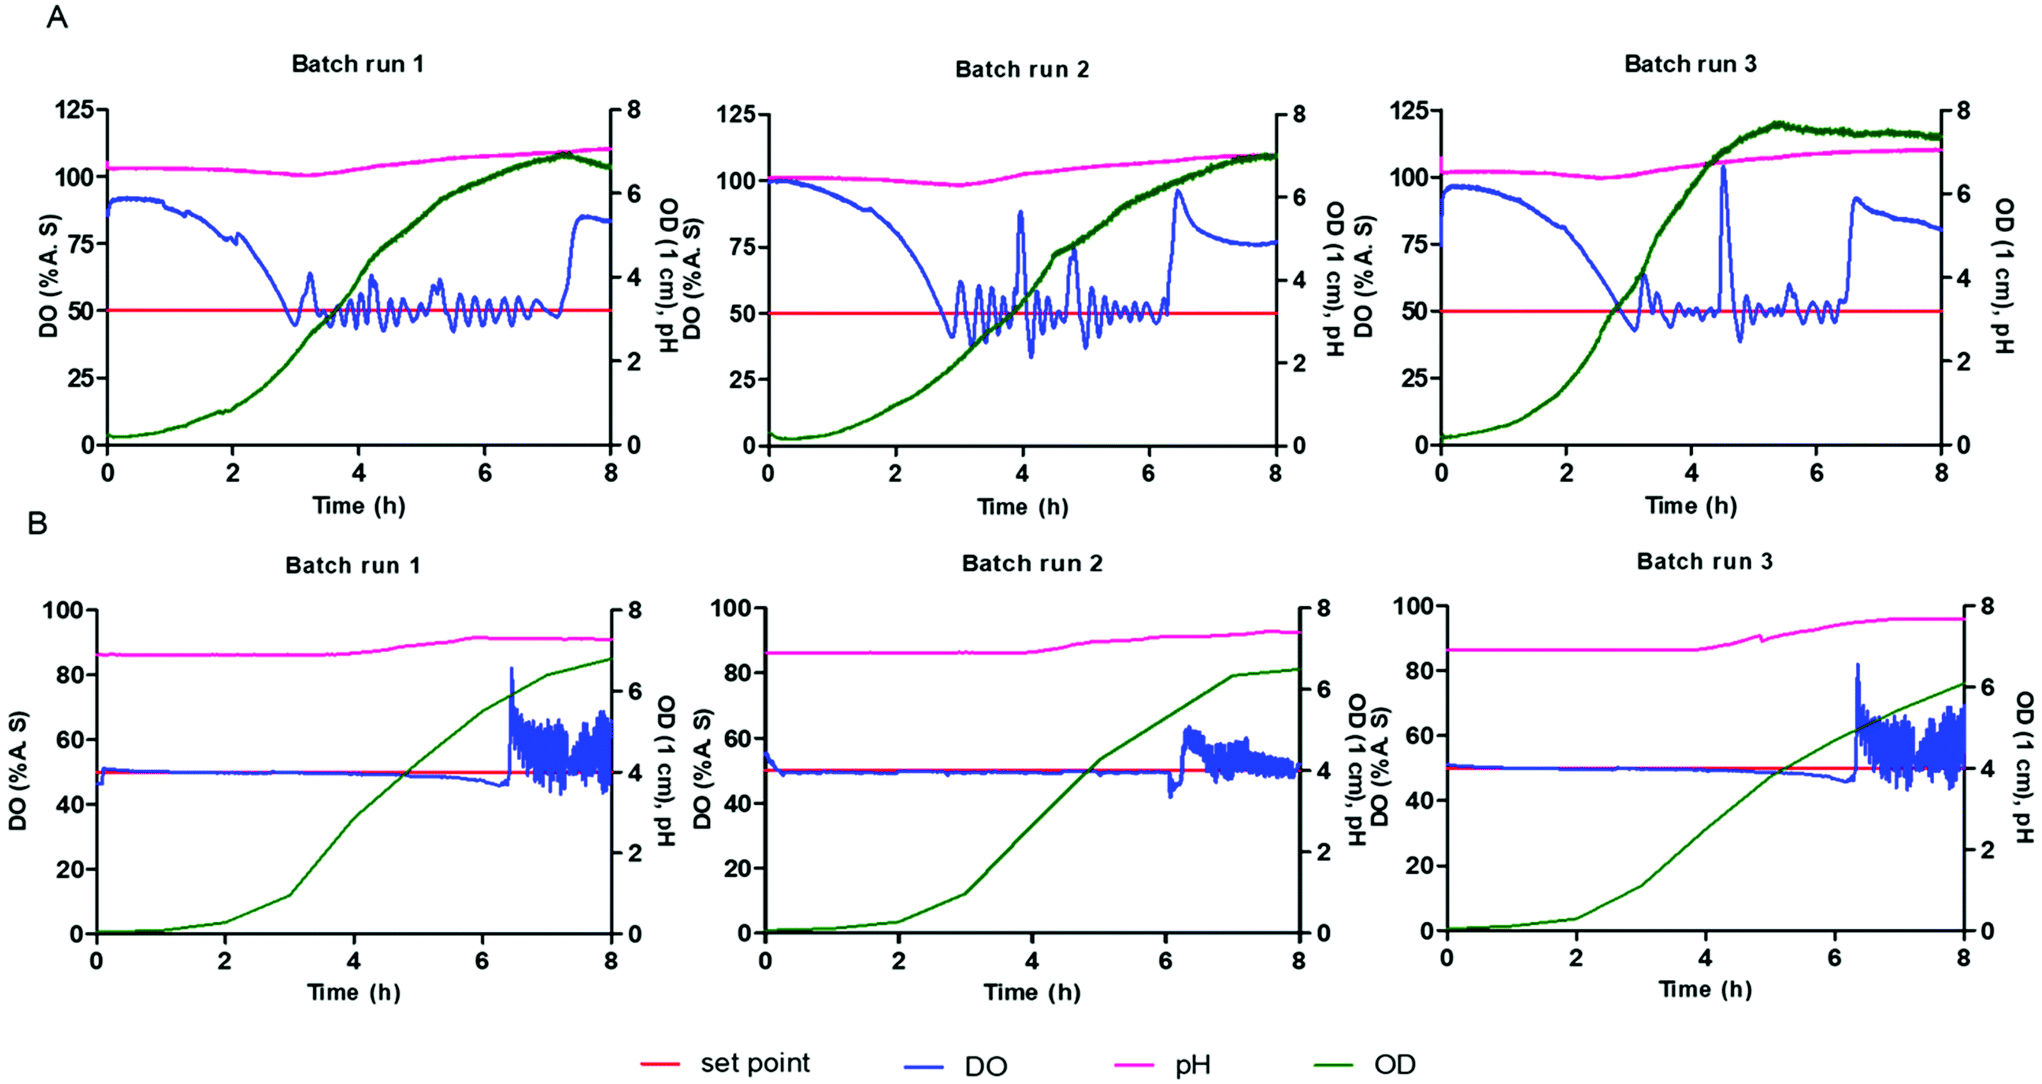 | ||
| Fig. 4 The growth profile of E. coli showing optical density, pH and dissolved oxygen from three independent (a) pH uncontrolled batch cultivations within the microbioreactor at 1200 rpm and (b) pH controlled batch cultivations within the 5 l bioreactor (2 L working volume) with modified LB media and DO was maintained through a feedback control loop to keep the concentration above 50%. | ||
Batch and continuous cultivation with downstream analytics for P. Pastoris batch cultivation reproducibility of P. pastoris
The batch cultivation for P. pastoris was carried out with a mixed carbon source methanol (10 g L−1) and glycerol (10 g L−1) and with a DO setpoint of 30% air saturation to achieve the necessary biomass for continuous culture. Fig. 5 shows triplicate cultivations within the microbioreactor at 1200 rpm stirring speed with buffered minimal media with 0.652 C-mol L−1 containing 50![[thin space (1/6-em)]](https://www.rsc.org/images/entities/char_2009.gif) :50% glycerol and methanol as a mixed feed. The pH, DO and biomass (g L−1 DCW) were recorded every 10 seconds within the microbioreactor. The starting pH of the batch cultivation was 6.0 ± 0.1 and the measured end point pH was around 5.5 ± 0.1, with no pH control being implemented. The temperature and stirring speed were kept constant, whilst the DO was maintained through a feedback control loop to keep the concentration above 30%. The batch cultivations for the P. pastoris growth profiles showed that an increase in the cell biomass is associated with a fall in the DO concentration, arising from oxygen consumption by cells.
:50% glycerol and methanol as a mixed feed. The pH, DO and biomass (g L−1 DCW) were recorded every 10 seconds within the microbioreactor. The starting pH of the batch cultivation was 6.0 ± 0.1 and the measured end point pH was around 5.5 ± 0.1, with no pH control being implemented. The temperature and stirring speed were kept constant, whilst the DO was maintained through a feedback control loop to keep the concentration above 30%. The batch cultivations for the P. pastoris growth profiles showed that an increase in the cell biomass is associated with a fall in the DO concentration, arising from oxygen consumption by cells.
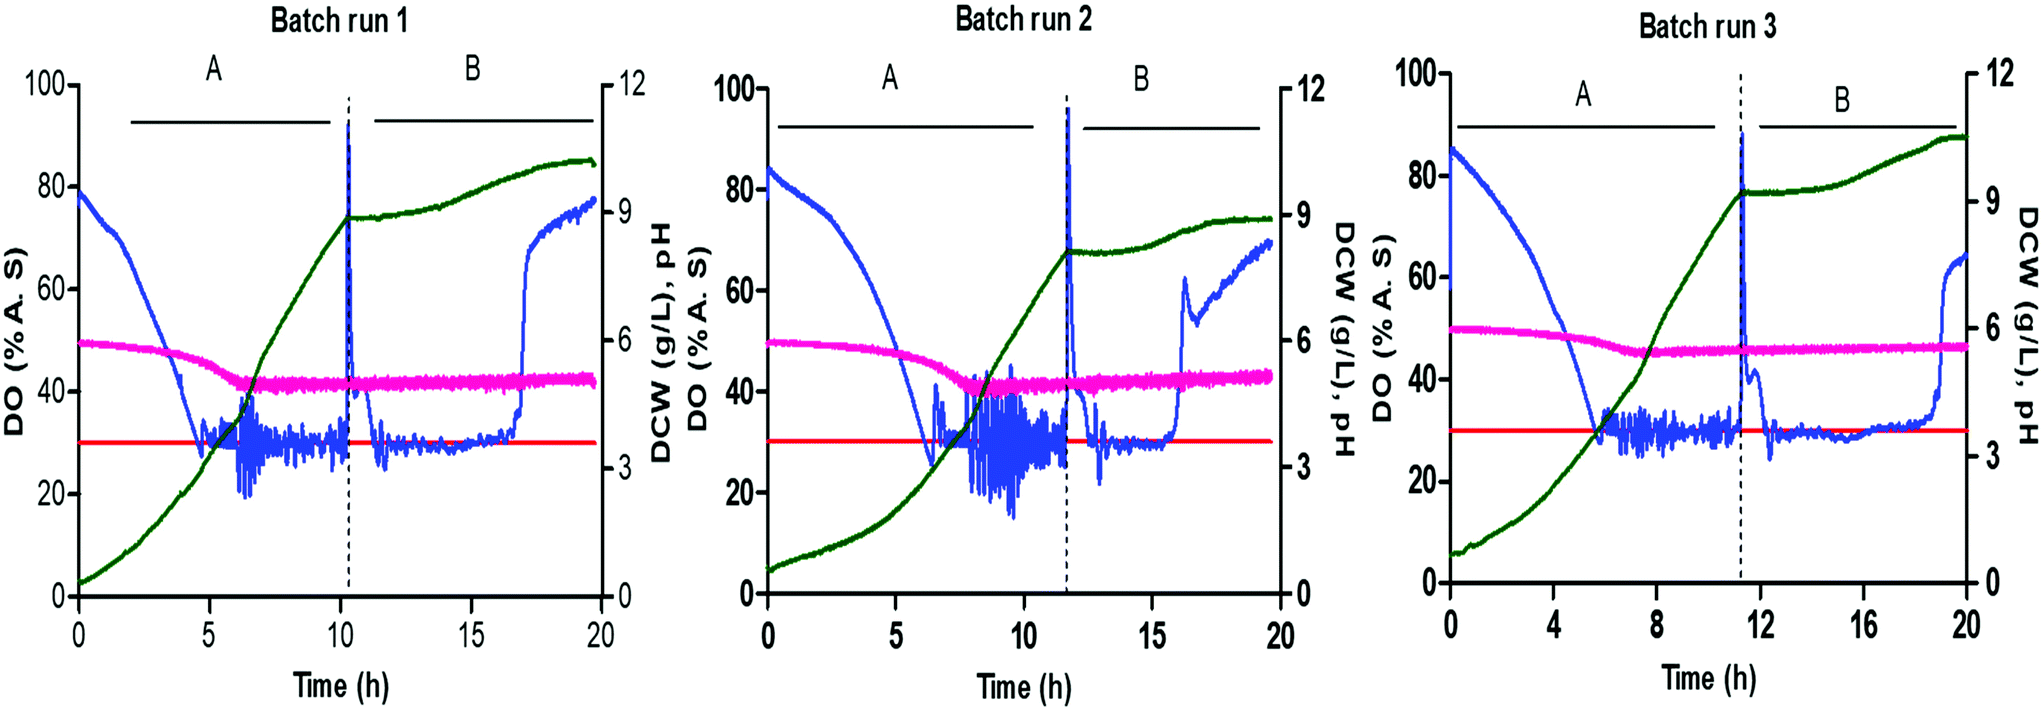 | ||
| Fig. 5 Diauxic growth of P. pastoris CLD804 mut+ with glycerol (a) and methanol (b) with triplicate batch cultivation in microbioreactor with the growth curves showing profiles for DO, pH and cell density DCW (g L−1). | ||
All cultivations had an initial biomass concentration 0.3 ± 0.1 g L−1 and a lag phase that ranged from one to three hours. There were some differences in the DO profile for the different cultivations and this could have arisen from differences in the inoculum. Efforts were made to standardise the procedure for inoculum preparation. It should, however, be noted that any differences in frozen vials or irregular mixing in the shake flask culture could affect the cells in the pre-culture and subsequently the inoculum.
This diauxic growth was exhibited on two carbon sources – shift occurred after 10–11 h of cultivation – and a lag period lasted for 1–2 hours, where the cells are adapting to the use of methanol and producing the alcohol oxidase (AOX) enzyme. Fig. 5 shows that the growth phase for P. pastoris on glycerol (0.20 ± 0.02 h−1) is higher than that on methanol (0.02 ± 0.04 h−1) since the cells first need to adapt to the methanol media and synthesize the enzymes responsible for methanol metabolism. Cultivation using both carbon sources, methanol and glycerol, resulted in an increase in the biomass and associated consumption of oxygen. After the consumption of glycerol, the DO concentration goes above 100%, seen as a spike in the DO from lower metabolic activity, and remains high until cells adapt to methanol. When the cells become adapted to the methanol carbon source, they then start to consume oxygen again and the DO is maintained at 30% setpoint value. The mixing speed was kept constant throughout the batch cultivation to monitor oxygen consumption, and check whether mixing and aeration in the microbioreactor is able to provide sufficient oxygen to meet the requirements for a high cell density culture at small scale. Towards the end of the cultivation, as the carbon source is consumed and is no longer available for the cells to use, the oxygen concentration is seen to increase and remains at a constant high level. Fig. 5 shows good growth agreement between the three batch cultivations for diauxic growth, with glycerol and methanol, and a dry cell weight of 10 ± 1 g L−1. The reproducibility of these cultivations within the microbioreactor demonstrates the system's utility for real world applications.
Continuous cultivation of P. pastoris with metabolite analytics
Batch cultivation of cells with the mixed carbon source was used to achieve a good level of biomass. Continuous cultivation is started, with a specific feed medium, when the methanol is completely consumed, indicated by a spike in the DO curve. The dilution rate for all of the continuous cultivation experiments were set to 0.07 h−1 (1.1 μL min−1) which was the minimum flow rate that could be controlled within the system. The profile of growth with dry cell weight concentrations, DO and pH for continuous cultivation is shown in Fig. 6A–C for constant feeds of (A) methanol (B) 50% methanol-sorbitol and (C) 50% methanol-glucose.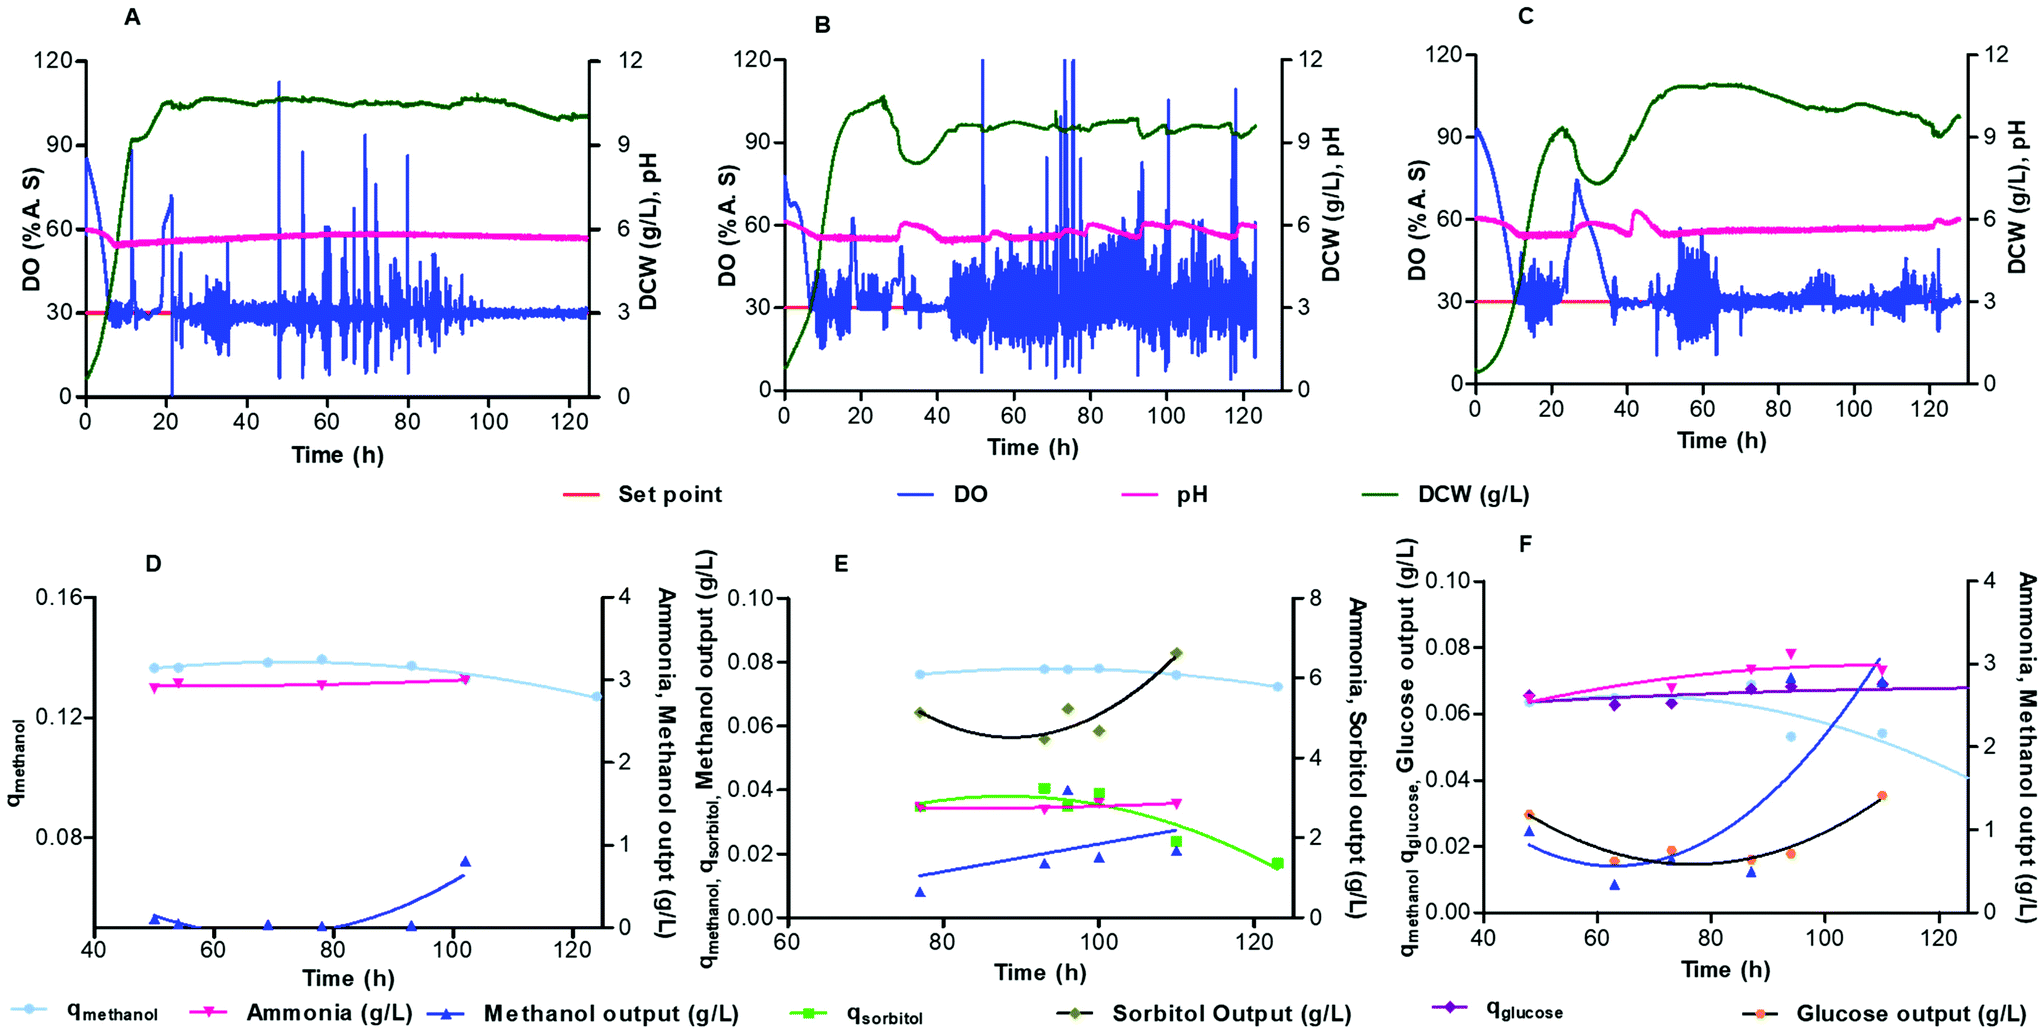 | ||
| Fig. 6 Dry cell weight, specific consumption rate of substrate (gsubstrate gDCW−1 h−1), NH3 production and residual substrate concentration in relation to dissolved oxygen and ph during continuous fermentation of P. pastoris CLD804 in microbioreactor at d = 0.07 h−1 for different feeding medium (a and d) 100% pure methanol (0.652 C mol L−1, 20.87 g L−1) (b and e) 50% sorbitol-methanol (0.652 C mol L−1, 10.44 g L−1 methanol and 9.89 g L−1 sorbitol) (c and f) 50% methanol-glucose (0.652 C mol L−1, 10.44 g L−1 methanol and 9.78 g L−1 glucose). Lines of best fit were constructed for the datasets (d–f). | ||
Fig. 6A–C shows that the DO profile is maintained at 30% air saturation, but with spikes at 2 h intervals arising from taking samples from the microbioreactor. In all three of the feeding cases, after three residence times the cells reach steady state with a relatively stable biomass density of around 10 g L−1 of dry cell weight. In the case of a mixed feed of methanol-sorbitol, the constant feeding rate (0.07 h−1) is between the maximal specific growth rates on methanol and sorbitol, 0.140 h−1 ± 0.007 h−1 and 0.032 ± 0.002 h−1 respectively.37 Initially cells are washed out, as seen by the decrease in biomass in Fig. 6B, since the dilution rate is higher than the maximum specific growth rate on sorbitol. This is in contrast to the pure methanol feed, shown in Fig. 6A, where no washout of cells is observed since the dilution rate is lower than the maximum specific growth rate on methanol.
For the methanol-sorbitol mixed feed, the cells are primarily consuming methanol since the dilution rate is higher than the maximum specific growth on sorbitol. The cells consume methanol and sorbitol simultaneously but once the methanol is completely consumed by the cells then the increase in biomass is constrained by the limited ability of cells to consume sorbitol. For the methanol-glucose feed, the dilution rate (0.07 h−1) is lower than the maximal specific growth rates on glucose (0.28 ± 0.01 h−1),38 and methanol (0.140 ± 0.007 h−1),37 so that cells can consume both of the substrates. There is some wash out of cells observed (Fig. 6C), since there is a lag period required for adaptation of cells to the methanol-glucose mixed feed medium.
At steady state, the specific production and consumption rates qi were calculated from:
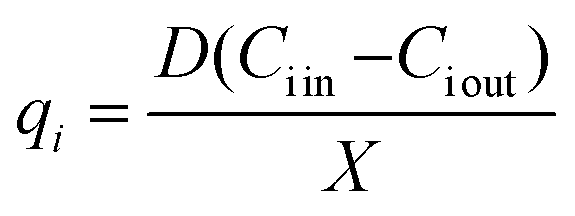 | (3) |
The yield (R) of substance j on substance i was calculated as a reconciled yield coefficient (g biomass per g of substrate) by
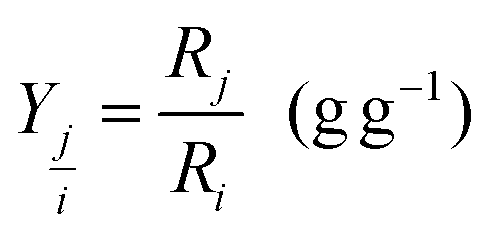 | (4) |
The concentration of the substrate, metabolites and product in the microbioreactor were determined by collecting samples, at steady state, periodically from the microbioreactor. The specific consumption rate for each substrate and reconciled yield coefficients were calculated using respectively eqn (3) and (4). For the different media feeds, the reconciled yield coefficients for biomass and ammonia produced; specific consumption rates of substrate as well as the residual substrate are shown in Fig. 6D and E. Values for these, along with the concentrations for the substrate and ammonia at harvest are given in Table 1.
| Methanol | 50% sorbitol-methanol | 50% methanol-glucose | |
|---|---|---|---|
| Final biomass (g L−1) | 10.04 | 9.62 | 9.74 |
| Yx/s (gg−1) | 0.50 ± 0.02 | 0.49 ± 0.03 | 0.44 ± 0.06 |
| Y NH3/s (gg−1) | 0.12 ± 0.03 | 0.13 ± 0.01 | 0.15 ± 0.03 |
| q methanol (gmethanolgDCW−1h−1) | 0.135 ± 0.004 | 0.076 ± 0.03 | 0.05 ± 0.012 |
| Methanol in harvest (g L−1) | 2.67 | 0.508 | 5.11 |
| Ammonia produced in harvest (g L−1) | 3.113 | 2.846 | 3.05 |
| Total protein in harvest (g L−1) | 118 ± 1 | 143 ± 3 | 66 ± 2 |
| DNA release in harvest (ng mL−1) | 186 ± 4 | 374.5 ± 6 | 593 ± 5 |
| Protease release in harvest (RFU) | 970 ± 9 | 989 ± 11 | 2442 ± 6 |
Methanol starts to accumulate inside the microbioreactor after 83 h (Fig. 6D) but with no effect on the biomass (Fig. 6A). For the methanol-sorbitol feed, the consumption of methanol does not change significantly during the cultivation and the residual methanol concentration is very low in the culture medium with a modest increase over time (Fig. 6E). This contrasts with a decrease in the consumption of sorbitol towards the later stage of the cultivation and an accumulation of the residual sorbitol within the culture medium. The accumulation of sorbitol in the spent medium arises from a lower maximum specific growth rate on sorbitol than the dilution rate for cultivation.39 For the methanol-glucose mixed feed, there is a decrease in the methanol consumption over the course of 124 h of cultivation (Fig. 6F) whilst this is maintained for both the methanol and methanol-sorbitol mixed feeding (Fig. 6D and E). It can also be seen from Fig. 6F that the residual glucose concentration is very low in the culture medium but that there is an accumulation of the residual methanol within the culture medium. In this case, after the cells have consumed all of the glucose then a further increase in biomass is limited since the cells have limited ability to consume methanol.
Characterisation of protein production from microbioreactor system
SDS page densitometry was used for quantification of the aprotinin product in the supernatant from the microbioreactor element (Fig. 7A). The error bars in Fig. 7A represent the variation, as standard deviation, of the product band density over the period of the cultivation. The normalised aprotinin SDS-PAGE band intensity was higher for pure methanol induction (314 ± 23) than for co-feeding with methanol-sorbitol (202 ± 17). Moreover, the aprotinin production was fairly constant during cultivation with pure methanol and sorbitol-methanol co-feeding but was found to reduce over time with methanol-glucose co-feeding as indicated by the larger error bar. A few studies have shown some minor improvement in product yield by directly replacing methanol with sorbitol in terms of C mol.37,40 Our work suggests that product formation is more sensitive to methanol induction rather than cell biomass, as indicated by the sharp drop in production of aprotinin during methanol-glucose mixed feeding. The relationship between recombinant protein production and biomass is complex and will depend on the cultivation conditions (pH, temperature, oxygen), physiology of cells, presence of repressor/inducer molecules as well as the target construct and product.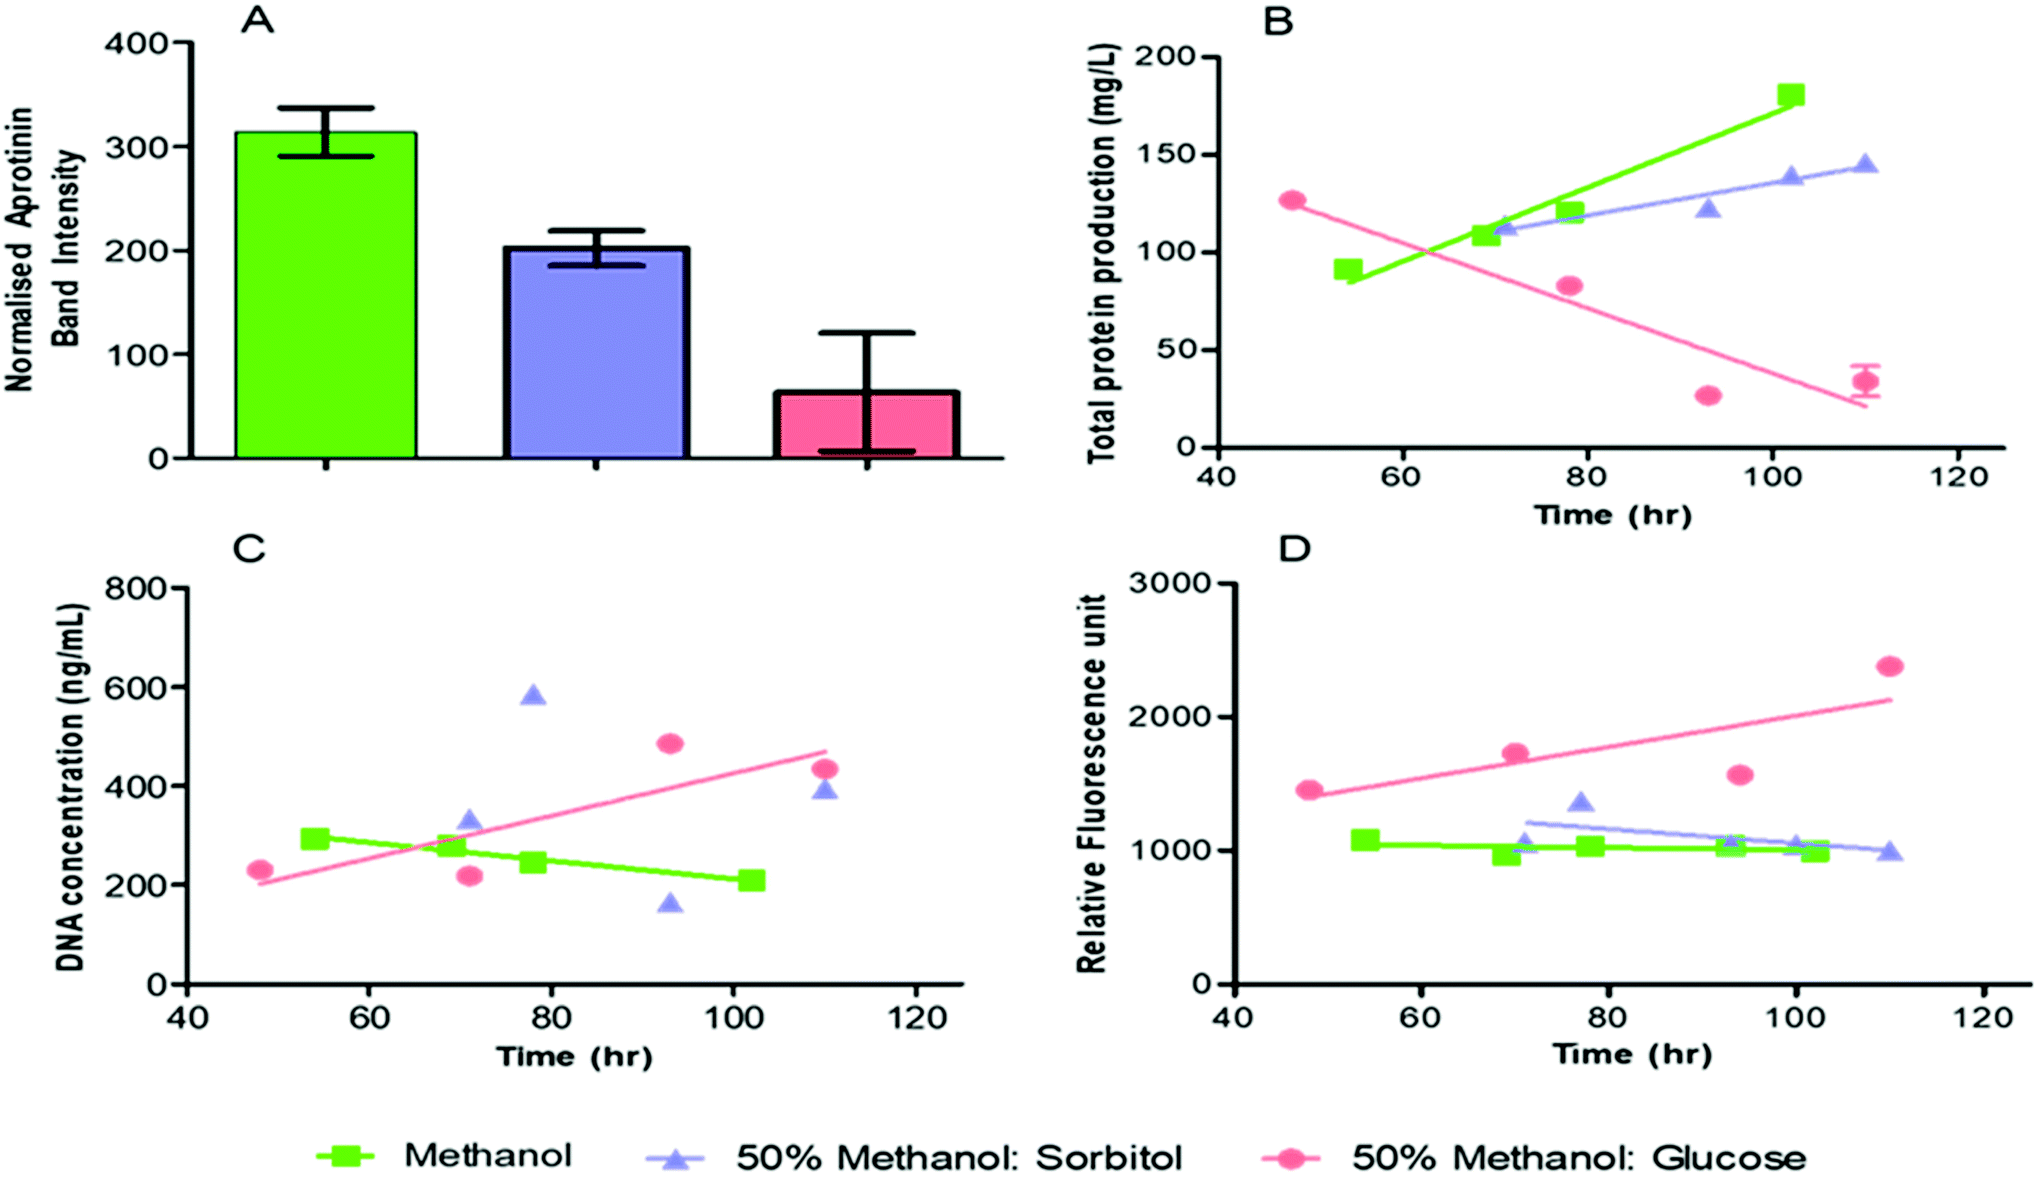 | ||
| Fig. 7 Supernatant analysis over the cultivation time with induction feed of pure methanol (green), 50% sorbitol-methanol (blue) and 50% glucose-methanol (red) by P. pastoris CLD804 in microbioreactor (a) densitometric analysis of the aprotinin bands, the intensity of bands were normalised by loaded sample concentration and the error bars are a result of the standard deviation between product band density over the period of the cultivation (b) total protein release (c) DNA release and (d) protease release. | ||
Methanol induction increases oxidative cellular stress due to the production of formaldehyde. Mixed feeding can improve cell viability by reducing the cellular burden of methanol metabolism on cells. An increase in the cell viability can potentially be indicated by an increase in the total protein production (Fig. 7B). In the case of methanol induction, the total protein produced increases over a range of 12 mg g−1 DCW to 18 mg g−1 DCW. This compares with a gradual increase of total protein released reaching a maximum to 14.6 mg g−1 DCW for sorbitol co-feeding, but a gradual decrease of total protein released with glucose co-feeding from accumulation of methanol inside the microbioreactor. The total protein produced at harvest was found to be highest for sorbitol-methanol co-feeding, followed by pure methanol and lowest for methanol-glucose (Table 1). The gradual decrease in the total protein produced for methanol-glucose co-feeding (Fig. 7B) is ascribed to glucose providing an excess carbon source and being preferentially consumed over methanol by the cells which leads to methanol accumulation in the media. In contrast to this, under carbon limited continuous culture – using 60:40% carbon from glucose and methanol (11.7 g per carbon L) – the repressive effect of glucose can be eliminated with improvement on biomass and productivity.38 Some studies have found that co-feeding can improve protein production but these have used different conditions, e.g. using a mixed feed technique where the methanol concentration is kept fixed and sorbitol is fed as a large pulse during the cultivation.41–44 In this study the sorbitol is added in a continuous manner since sorbitol accumulation has no effect on AOX1.45
Total protein is not necessarily the most appropriate measure for cell viability since P. pastoris will naturally secrete some proteins and the amount of protein released is small.46 Better measures of cell viability are a release of either DNA or protease into the supernatant since these are only released on cell death.47Fig. 7C shows that the residual DNA concentration increases with co-feeding of methanol-glucose and, in contrast to this a flat or decreased DNA release with respectively co-feeding of methanol-sorbitol and with methanol alone. We also find that the proteases released for the pure methanol feeding and the methanol-sorbitol co-feeding are broadly similar and flat against increased levels of protease released for co-feeding of methanol-glucose mixed. Moreover, the protease concentration in the harvest was approximately similar for the pure methanol and methanol-sorbitol mixed feeds, but was higher for the methanol-glucose feed. This indicates that the methanol-sorbitol mixed feed has similar cultivation to that of pure methanol, but that the methanol-glucose mixed feed, under the conditions used, has a relatively negative effect on productivity and quality.
Conclusion
A low-cost microfluidic microbioreactor with integrated optical sensors allowing complex fluidic operations, using pressurised fluid driving and off-chip fluidic switching was demonstrated for batch and continuous cultivations towards optimisation of recombinant protein production. The approach used would also be applicable for a variety of applications within synthetic biology, cell and gene therapy and organ-on-chips. Prototyping and low volume manufacture of the microbioreactor element using i3DP was both convenient and low cost as well as being sufficiently biocompatible. The microbioreactor design is amenable for volume manufacture using micro-injection moulding to reduce the cost of the device. There was good reproducibility between cultivation of E. coli within the microbioreactor and a 2 L bench scale bioreactor. The microbioreactor has high oxygen transfer efficiency and this was demonstrated for both batch and continuous cultivation of P. pastoris which has high oxygen requirement. Triplicate batch cultivations of P. pastoris within the microbioreactor showed high level of reproducibility for cell density, pH, DO and DCW. For continuous cultivation the microbioreactor system can be integrated with existing downstream analytics – SDS-Page electrophoresis for protein product; Bradford assay for total protein; total DNA assay; protease assay – to characterise the supernatant and optimise the feed. The developed microbioreactor system can be used for bioprocess optimisation including strain selection and optimisation of bioprocess parameters which could speed up bioprocess development.Future work will focus on implementation of fed batch cultivation, integration of information from the microfluidic microbioreactor – as a miniaturised physical model – with computational models for the understanding of cellular processes. We will also seek parallelisation of the microbioreactor elements for higher volume of information and application for novel bioprocesses.
Conflicts of interest
There are no conflicts to declare.Acknowledgements
This work was supported by the European Commission through the Horizon 2020 GateOne project (project number 644856) and also by the UKRI, Research England, Connecting Capability Fund through the Thyme project (project code ccf14-7167). MP wishes to acknowledge FUJIFILM Diosynth Biotechnologies for partial support of a studentship and AA wishes to acknowledge support of the Libyan Education Ministry for support of studentship. We wish to thank and remember the many valuable contributions of Dr Simon M. Scott who sadly passed away before preparation of this work.References
- A. B. Zepeda, A. Pessoa and J. G. Farías, Braz. J. Microbiol., 2018, 49, 119–127 CrossRef CAS
.
- M. P. Marques and N. Szita, Curr. Opin. Chem. Eng., 2017, 18, 61–68 CrossRef PubMed
- G. Pasirayi, V. Auger, S. M. Scott, P. K. S. M. Rahman, M. Islam, L. O'Hare and Z. Ali, Micro Nanosyst., 2012, 3, 137–160 CrossRef
- P. K. S. M. Rahman, G. Pasirayi, V. Auger and Z. Ali, Biotechnol. Lett., 2009, 31, 209–214 CrossRef CAS PubMed
- P. K. S. M. Rahman, G. Pasirayi, V. Auger and Z. Ali, Biotechnol. Appl. Biochem., 2010, 55, 45–52 CrossRef CAS PubMed
- A. Buchenauer, M. C. Hofmann, M. Funke, J. Büchs, W. Mokwa and U. Schnakenberg, Biosens. Bioelectron., 2009, 24, 1411–1416 CrossRef CAS PubMed
- A. L. Zydney, Curr. Opin. Chem. Eng., 2015, 10, 8–13 CrossRef
-
J. Gijs Kuenen, in Encyclopedia of Microbiology, 2019, pp. 743–761 Search PubMed
- P. A. Hoskisson and G. Hobbs, Microbiology, 2005, 151, 3153–3159 CrossRef CAS PubMed
- N. Ziv, N. J. Brandt and D. Gresham, J. Visualized Exp., 2013, 80, e50168 Search PubMed
- A. Schmideder, T. S. Severin, J. H. Cremer and D. Weuster-Botz, J. Biotechnol., 2015, 210, 19–24 CrossRef CAS PubMed
- S. Lladó Maldonado, P. Panjan, S. Sun, D. Rasch, A. M. Sesay, T. Mayr and R. Krull, Biotechnol. Bioeng., 2019, 116, 65–75 CrossRef PubMed
- E. J. S. Brás, V. Chu, M. R. Aires-Barros, J. P. Conde and P. Fernandes, J. Chem. Technol. Biotechnol., 2017, 92, 334–341 CrossRef
- S. C. C. Shih, I. Barbulovic-Nad, X. Yang, R. Fobel and A. R. Wheeler, Biosens. Bioelectron., 2013, 42, 314–320 CrossRef CAS PubMed
- M. Rashid, Y.-H. Dou, V. Auger and Z. Ali, Micro Nanosyst., 2010, 2, 108–136 CrossRef CAS
- S. Halldorsson, E. Lucumi, R. Gómez-Sjöberg and R. M. T. Fleming, Biosens. Bioelectron., 2015, 63, 218–231 CrossRef CAS
- G. Pasirayi, S. M. Scott, M. Islam, L. O'Hare, S. Bateson and Z. Ali, Talanta, 2014, 129, 491–498 CrossRef CAS PubMed
- A. Lakey, Z. Ali, S. M. Scott, S. Chebil, H. Korri-Youssoufi, S. Hunor, A. Ohlander, M. Kuphal and J. S. Marti, Biosens. Bioelectron., 2019, 129, 147–154 CrossRef CAS PubMed
- R. Amin, S. Knowlton, A. Hart, B. Yenilmez, F. Ghaderinezhad, S. Katebifar, M. Messina, A. Khademhosseini and S. Tasoglu, Biofabrication, 2016, 8 Search PubMed
- N. Bhattacharjee, A. Urrios, S. Kang and A. Folch, Lab Chip, 2016, 16, 1720–1742 RSC
- Z. Zhang, P. Boccazzi, H. G. Choi, G. Perozziello, A. J. Sinskey and K. F. Jensen, Lab Chip, 2006, 6, 906–913 RSC
- K. S. Lee, P. Boccazzi, A. J. Sinskey and R. J. Ram, Lab Chip, 2011, 11, 1730–1739 RSC
- P. Perez-Pinera, N. Han, S. Cleto, J. Cao, O. Purcell, K. A. Shah, K. Lee, R. Ram and T. K. Lu, Nat. Commun., 2016, 7, 12211 CrossRef CAS PubMed
- A. v. Lis, K. Schneider, J. Weber, J. D. Keasling, M. K. Jensen and T. Klein, Microb. Cell Fact., 2019, 18, 1–11 CrossRef PubMed
- S. Bateson, AIMS Electron. Electrical Eng., 2019, 3, 1–15 Search PubMed
- D. Schäpper, S. M. Stocks, N. Szita, A. E. Lantz and K. v. Gernaey, Chem. Eng. J., 2010, 160, 891–898 CrossRef
- F. Garcia-Ochoa and E. Gomez, Biotechnol. Adv., 2009, 27, 153–176 CrossRef CAS PubMed
- S. Suresh, V. C. Srivastava and I. M. Mishra, J. Chem. Technol. Biotechnol., 2009, 84, 1091–1103 CrossRef CAS
- P. Painmanakul, J. Wachirasak, M. Jamnongwong and G. Hebrard, Eng. J., 2009, 13, 13–28 CrossRef
- A. H. Rose, Trends Biotechnol., 1985, 3, 242–243 CrossRef
- J. C. van Suijdam, N. W. F. Kossen and A. C. Joha, Biotechnol. Bioeng., 1978, 20, 1695–1709 CrossRef CAS
- K. Van'T Riet, Ind. Eng. Chem. Process Des. Dev., 1979, 18, 357–364 CrossRef
- W. A. Brown, Chem. Eng. Educ., 2001, 35, 134–139 CAS
- H. L. T. Lee, P. Boccazzi, R. J. Ram and A. J. Sinskey, Lab Chip, 2006, 6, 1229–1235 RSC
- Z. Zhang, N. Szita, P. Boccazzi, A. J. Sinskey and K. F. Jensen, Biotechnol. Bioeng., 2006, 286, 93–92 Search PubMed
- N. P. MacDonald, F. Zhu, C. J. Hall, J. Reboud, P. S. Crosier, E. E. Patton, D. Wlodkowic and J. M. Cooper, Lab Chip, 2016, 16, 291–297 RSC
- C. Jungo, J. Schenk, M. Pasquier, I. W. Marison and U. von Stockar, J. Biotechnol., 2007, 131, 57–66 CrossRef CAS PubMed
- L. Paulová, P. Hyka, B. Branská, K. Melzoch and K. Kovar, J. Biotechnol., 2012, 157, 180–188 CrossRef PubMed
- T. Egli, C. Bosshard and G. Hamer, Biotechnol. Bioeng., 1986, 28, 1735–1741 CrossRef CAS PubMed
- H. Niu, L. Jost, N. Pirlot, H. Sassi, M. Daukandt, C. Rodriguez and P. Fickers, Microb. Cell Fact., 2013, 12, 33 CrossRef CAS PubMed
- J. Xie, Q. Zhou, P. Du, R. Gan and Q. Ye, Enzyme Microb. Technol., 2005, 36, 210–216 CrossRef CAS
- Z. Wang, Y. Wang, D. Zhang, J. Li, Z. Hua, G. Du and J. Chen, Bioresour. Technol., 2010, 101, 1318–1323 CrossRef CAS PubMed
- C. Arnau, R. Ramón, P. Ferrer and F. Valero, J. Biotechnol., 2007, 131, s76 CrossRef
- M. J. Gao, Z. Li, R. S. Yu, J. R. Wu, Z. Y. Zheng, Z. P. Shi, X. B. Zhan and C. C. Lin, Bioprocess Biosyst. Eng., 2012, 35, 1125–1136 CrossRef CAS PubMed
- P. Çalik, B. Bozkurt, G. H. Zerze, B. Inankur, E. Bayraktar, E. Boy, M. A. Orman, E. Açik and T. H. Özdamar, J. Chem. Technol. Biotechnol., 2013, 88, 1631–1640 CrossRef
- A. G. Lopes, N. Khan, J. Liddell and E. Keshavarz-Moore, Biotechnol. Prog., 2012, 28, 1029–1036 CrossRef CAS PubMed
- Y. Zhang, R. Liu and X. Wu, Ann. Microbiol., 2007, 57, 553–560 CrossRef CAS
Footnote |
| † Electronic supplementary information (ESI) available. See DOI: 10.1039/d0an01266a |
| This journal is © The Royal Society of Chemistry 2020 |