
 Open Access Article
 This Open Access Article is licensed under a
 Creative Commons Attribution 3.0 Unported Licence
The search for a unique Raman signature of amyloid-beta plaques in human brain tissue from Alzheimer's disease patients†
Benjamin
Lochocki
 *a,
Tjado H. J.
Morrema
b,
Freek
Ariese
a,
Jeroen J. M.
Hoozemans
b and
Johannes F.
de Boer
a
*a,
Tjado H. J.
Morrema
b,
Freek
Ariese
a,
Jeroen J. M.
Hoozemans
b and
Johannes F.
de Boer
a
aDepartment of Physics and Astronomy, LaserLaB Amsterdam, VU Amsterdam, The Netherlands. E-mail: ben.lochocki@vu.nl
bDepartment of Pathology, Amsterdam Neuroscience, Amsterdam University Medical Center, Amsterdam, The Netherlands
First published on 6th January 2020
Abstract
Definite Alzheimer's disease (AD) diagnosis is commonly done on ex vivo brain tissue using immuno-histochemical staining to visualize amyloid-beta (Aβ) aggregates, also known as Aβ plaques. Raman spectroscopy has shown its potential for non-invasive and label-free determination of bio-molecular compositions, aiding the post-mortem diagnosis of pathological tissue. Here, we investigated whether conventional Raman spectroscopy could be used for the detection of amyloid beta deposits in fixed, ex vivo human brain tissue, taken from the frontal cortex region. We examined the spectra and spectral maps of three severe AD cases and two healthy control cases and compared their spectral outcome among each other as well as to recent results in the literature obtained with various spectroscopic techniques. After hyperspectral Raman mapping, Aβ plaques were visualized using Thioflavin-S staining on the exact same tissue sections. As a result, we show that tiny diffuse or tangled-like morphological structures, visible under microscopic conditions on unstained tissue and often but erroneously assumed to be deposits of Aβ, are instead usually an aggregation of highly auto-fluorescent lipofuscin granulates without any, or limited, plaque or plaque-like association. The occurrence of these auto-fluorescent particles is equally distributed in both AD and healthy control cases. Therefore, they cannot be used as possible criteria for Alzheimer's disease diagnosis. Furthermore, a unique plaque-specific/Aβ spectrum could not be determined even after possible spectral interferences were carefully removed.
1. Introduction
Aside from intracellular phosphorylated tau (pTau) deposits,1,2 extracellular accumulation of amyloid-beta into plaques is known as the main pathological hallmark in ex vivo brain tissue for the diagnosis of Alzheimer's disease.3–6 Aβ peptides are molecular chains split off from the amyloid precursor protein (APP) and they adopt predominantly a poorly soluble β-sheet conformation. As state of the art diagnosis, Aβ is targeted in cerebrospinal fluid (CSF) analysis7,8 and positron emission tomography (PET) is performed on in vitro and in vivo brain tissue.9,10 Furthermore, blood components and derivatives have been investigated for potential diagnosis of Alzheimer's disease using spectroscopic techniques.11–14 The former mentioned methods are, at least, partially invasive, time consuming and expensive. Nevertheless, even though these assessments are done in vivo and would aid the early diagnosis of AD, a conclusive assessment can only be done post-mortem. Ex vivo (immuno-)histochemical detection on brain tissue is carried out using staining with conventional anti-Aβ antibodies,15,16 Thioflavin-S2,17,18 or curcumin,19,20 a potential biomarker for the detection of Aβ plaques. In addition, pathological evidence of Aβ aggregates was observed in retinal tissue of mice and humans19 but could only be identified in human brain tissue by others.20 However, to identify Aβ deposits, the tissue often has to undergo a time-consuming staining procedure. Additionally, this could put the tissue under stress in terms of heat and deformation, which potentially alters the tissue structure or even leads to total tissue loss. Therefore, techniques such as FTIR-spectroscopy,21 Raman spectroscopy22–24 and its derivatives coherent anti-Stokes Raman scattering (CARS), stimulated Raman scattering (SRS) and surface-enhanced Raman spectroscopy (SERS)17,18,25 could offer a label-free and non-destructive characterization of the morphology of the tissue. Together with optical coherence tomography,26,27 these techniques could overcome the disadvantages of the staining procedure. Furthermore, these techniques could potentially lead to non-invasive in vivo detection and characterization of amyloid plaques e.g., in the retina.The tissue samples are excited with a narrowband illumination source. A very small fraction of the light undergoes inelastic scattering according to the vibrational modes of the irradiated molecules, thus providing a spectral fingerprint.28–31 These unique spectral shifts characterize the molecular components. Here, we used a commercial Raman spectrometer with a near-infrared illumination source (λ = 785 nm) to obtain spectral information of biomolecules within the fingerprint region of 850 to 1850 cm−1. This range is sufficient to determine structural properties and relative concentrations of lipids (around 1445 cm−1), proteins (Amide I) in β-sheet (around 1660 to 1670 cm−1) and phenylalanine (around 1003 cm−1).22,24,32,33 Literature suggests that the peak intensity at 1669 cm−1 (β-sheet) or the peak ratio between β-sheet and lipids (1669 cm−1 to 1445 cm−1) increases when measuring inside an amyloid plaque.22,33,34 Furthermore, recent Alzheimer related publications on mouse brain tissue suggest that a lipid ring (halo) surrounds the plaque location,18,21 while others found lipids and lipofuscin co-localized with plaques in human brain tissue.16,17 In a recent study, Michael et al. presented Raman spectral data (λ = 647.1 nm) from a tiny diseased human brain tissue area of 30 × 30 μm, barely matching the size of a plaque. They reported the spectral identification of plaque-like structure by using cluster analysis.24 However, like Archer et al.,23 their work lacked convincing evidence that the presented structure was indeed an accumulation of amyloid-beta. Neither was the imaged location stained afterwards to confirm a plaque-like accumulation nor was there proof of a spectral shift or alteration, as one would expect with Raman spectral data if a higher β-sheet content would be imaged. Therefore, definitive proof that an amyloid-beta deposit has been measured is still missing.
In what follows, we report on the findings of hyperspectral Raman mapping of formalin fixed, dewaxed diseased and healthy human brain tissue. We raster-imaged areas of around 0.25 mm2 with high spatial resolution. This allowed us to identify unique spectra and correlate our spectral finding to the auto-fluorescence image acquired before staining as well as the fluorescence images acquired after staining the same tissue section with Thioflavin-S. The chosen area was big enough to contain several plaques35 and the step size small enough to acquire the spectral data with an adequate spatial resolution and yet within a reasonable amount of time. With this work, we aim to provide for the first time conclusive evidence of the spectral origins while at the same time verifying the existence of plaques in the measured areas.
2. Materials and methods
Brain tissue
Post mortem brain tissue was obtained from the Netherlands Brain Bank (NBB; Amsterdam, the Netherlands). Prior to death, donors had signed informed consent for brain autopsy, the use of brain tissue and medical records for research purposes. Neuropathological diagnosis was based on histochemical stainings including hematoxylin and eosin, Congo red staining, Bodian or Gallyas and Methenamine silver stainings and immunohistochemical stainings for amyloid-beta, p-tau, alpha-synuclein, and p62. These stainings were performed on formalin-fixed, paraffin embedded (FFPE) brain tissue of multiple brain regions including the frontal cortex, temporal pole, superior parietal lobe, occipital pole, amygdala and the hippocampus. Neuropathological diagnosis of AD was based on Braak stages for NFT and amyloid,36 Thal phases for amyloid-beta,37 as well as CERAD criteria for neuritic plaques.38Based on post mortem diagnosis, we excluded cases with other neurodegenerative diseases. Post mortem, formalin-fixed, paraffin-embedded brain tissue sections from the frontal lobe (F2) were assessed. The area of interest was the gray matter region where plaques are expected to appear and their presence had been validated using immunohistochemistry of adjacent slices. Here we report on the results of three AD and three healthy control samples. Their characteristics can be found in Table 1. Please note that two areas of interest were measured from healthy control tissue #1.
Tissue preparation
For the present study, 20 μm thick paraffin embedded tissue sections were cut using a microtome and mounted on fused quartz glass microscope slides (Alfa Aesar via ThermoFisher (Kandel), Germany) using distilled water. The sections were deparaffinized using xylene, 1 × 10, 2 × 5 min. Afterward, the tissue was rehydrated using ethanol in 3 steps (100% (2 × 2 min), 95% (2 min) and 70% (2 × 2 min)) and rinsed with phosphate-buffered saline (PBS; pH 7.4) and tap water. The dewaxing step was introduced to have tissue in “as much of an in vivo state as possible”.40 Furthermore, paraffin could potentially contribute to the Raman spectra at around 1441 cm−1, coinciding with the lipid peak,41 which would bias any Raman peak and peak ratio measurements. Raman spectroscopy was performed on sections not covered by a coverslip.Thioflavin-S staining
Thioflavin-S binds to the fibrillary amyloid structure, mostly present in cored and fibrillary plaques well as neurofibrillary Tau tangles. Thioflavin-S staining was performed after Raman imaging. Dried out tissue was rehydrated in tap water for 10 minutes. The tissue sections were incubated with 1% Thioflavin-S (Sigma-Aldrich) solution (demineralized water) for 10 min, followed by rinsing off excess Thioflavin-S using 70% alcohol. Following staining, slides were washed using PBS and covered using Tris-buffered saline (TBS)/glycerol mounting medium, as described previously,20 and covered with a coverslip. Any possible non-fibrillar types or regions of plaques35 are likely not stained and hence the plaque might appear smaller than expected. Thioflavin-S staining is commonly used to identify plaque in tissue17,18,42 and here it is preferred to conventional histochemical antibody staining since no heating step (to break the formalin bridges) or any other harsh method is needed to achieve the staining. It should be mentioned that the tissue sections were placed loosely on the quartz substrate. Therefore, chances are high that they would come off easily, which could result in unwanted tissue loss.It is important to emphasize that each individual measurement (auto-fluorescence, Raman mapping, and fluorescence) per case was obtained from the same tissue sections and not from adjacent sections. By doing so, we eliminated the potential differences between adjacent tissue sections. Moreover, we ensure the identical origin of our data when using different imaging techniques. Further, it also simplifies the matching and overlaying of each imaging modality, which is crucial for subsequent data processing and visualization.
Immunohistochemistry
The presence or absence of Amyloid-β was also examined using immunohistochemistry in the sequential tissue sections above and below the Raman section. Five μm thick paraffin sections were mounted on superfrost+ microscopy slides. Sections were deparaffinized, autoclave treated using citrate buffer and stained either with mouse monoclonal anti-Amyloid-β antibodies 4G8 (Biolegend, San Diego, CA, USA, dilution 1![[thin space (1/6-em)]](https://www.rsc.org/images/entities/char_2009.gif) :8000) or IC-16 (dilution 1:800).43 Hematoxylin counterstaining was performed and sections were covered using quick-D and a coverslip.
:8000) or IC-16 (dilution 1:800).43 Hematoxylin counterstaining was performed and sections were covered using quick-D and a coverslip.
Raman spectroscopy
The Raman images were recorded in mapping mode using a commercially available Raman spectrometer, Renishaw inVia, with an excitation wavelength of 785 nm. The following settings were kept constant for each case: the laser power was at 100% and measured as 82 mW at the sample plane with a spot size of around 1.3 μm. The exposure time per pixel measurement was 1.5 s (single accumulation). The tissue sustained no damage during the measurement. The relatively short exposure time combined with a single accumulation per pixel resulted in a good SNR and therefore in adequate Raman spectra. The used settings are a reasonable compromise between overall mapping time and the total area of interest. Expected Raman peaks are clearly visible when measuring in ‘normal’ tissue areas as we used hydrated tissue with minimum scattering. However, some further improvement could be achieved by minimizing scattered light by measuring in water immersion.44 We recorded the fingerprint region from 875 to 1941 cm−1, meaning 1022 points per spectrum using a grating of 1200 l mm−1 (equal to approximately 1.04 wavenumbers per pixel). The C–H stretching range around 3000 cm−1 was not measured. The total Raman spectra acquisition time per case was <14 hours for 28224 points, forming a raster image with a step size of three μm and an area of 501 × 501 μm (equal to an image the size of 168 × 168 pixels). All tissue sections were imaged using the above-described settings, except control tissue C#2, which had a slightly reduced size of 168 × 157 pixels. The attached Leica microscope was equipped with a Leica (N Plan EPI) 50× objective with a 0.75 NA. During the study, we observed that the optics within the objective introduces a background signal containing a broad hump at around 1350 cm−1 that is superimposed on the Raman signal in this wavenumber region (more details in the ESI, Fig. S1†).
Initial tissue location
Others have used fuzzy or tangle-like structures, seen under bright field microscopy conditions, as points of interest for identifying potential plaque locations.24 However, in our experience that approach is not a valid method to identify plaque. We could not establish a solid method to identify plaques in unstained tissue, in order to select an area of interest for imaging. For that reason, tissue-imaging locations were selected by navigating close to structural hallmarks like blood vessels within the gray matter. In adjacent stained tissue sections, we also observed amyloid accumulations in blood vessel walls but these locations were often rejected due to highly fluorescent blood residues further hampering Raman measurements.Additional imaging modalities
It is worth noting that all samples were subjected to the same conditions to reduce possible experimental variability. The Raman settings (exposure time and accumulation), the objective used, the laser power reaching the sample, the imaging area and size, the staining protocol and data processing were identical (Fig. 1).
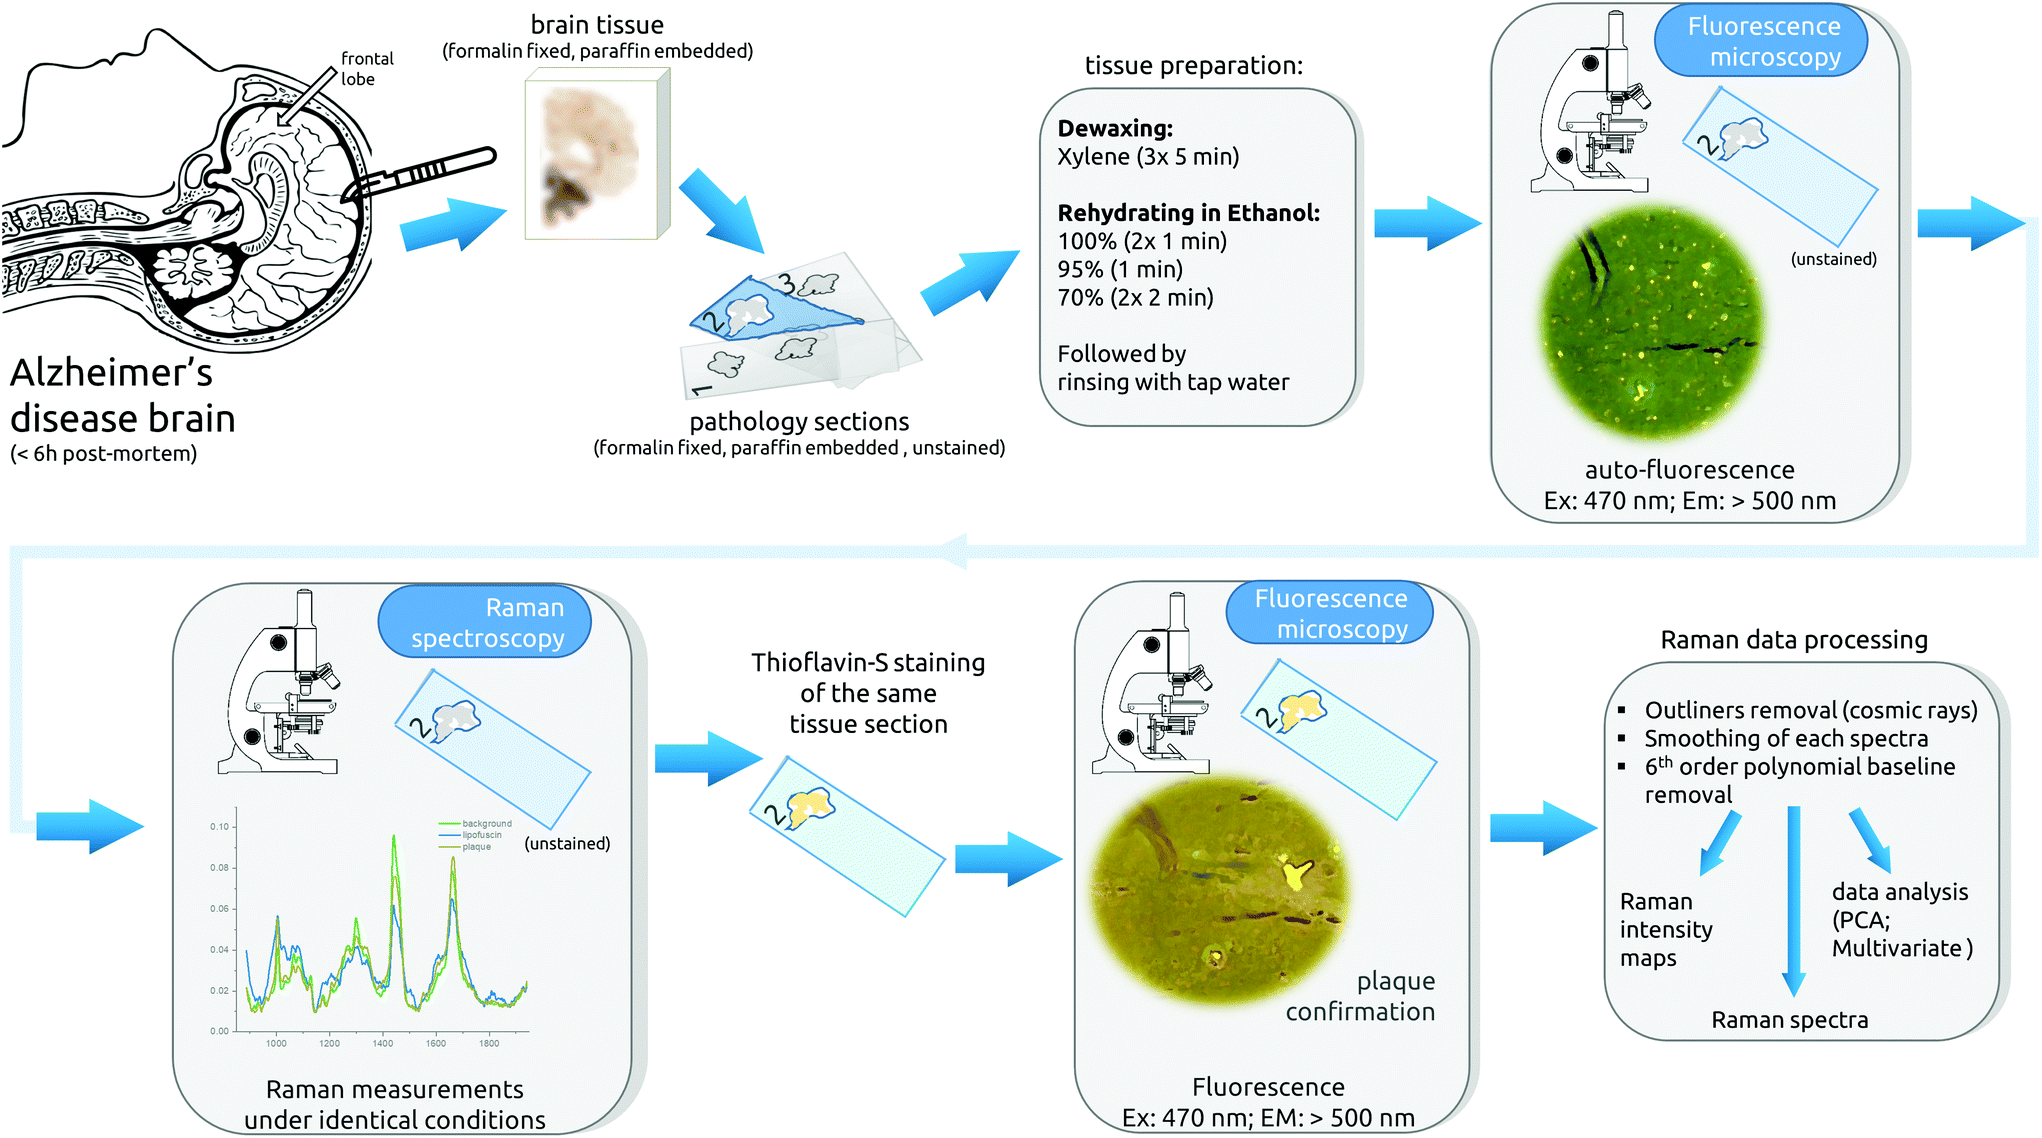 | ||
| Fig. 1 Description of the experimental workflow. Brain tissue is taken within 6 hours post mortem, fixed with formalin, and embedded in paraffin. Next, the tissue is cut in thin sequential sections and mounted on quartz glass microscope slides, followed by the dewaxing process. Afterward, the center section is imaged under the auto-fluorescence microscope and subsequently Raman measurements are taken. After Raman mapping, the same tissue section is stained with Thioflavin-S and imaged with the fluorescence microscope. The final step is the data processing. Meanwhile, adjacent sections were stained. | ||
3. Results and discussion
Images before and after staining
Fig. 2 gives an overview of the images obtained for the six tissue samples used in this study. The top three rows show the imaging results for AD brain tissues while the lower three rows represent the results of the healthy control tissues. Fig. S9 in the ESI† provides an overview of all examined sections and their adjacent stained slices. The columns in Fig. 2 depict different imaging modalities. In the left column, auto-fluorescence images of one AD and one healthy control case before staining are shown. Both cases show a similar distribution of bright spots the size of 10–20 μm across the tissue. Michael et al.24 associated such bright spots with neurotic plaques but the Thioflavin-S staining (last column) confirms only four plaques within the tissue area (see Fig. 3, AD #3, red arrows), which is much lower than the number of bright spots. Although the highlighted plaques are co-localized with bright spot locations, there are many more bright spots that do not co-localize with plaque locations. Moreover, the bright spots appear also in a similar manner within healthy tissue. Fig. 3 shows a more detailed comparison between the auto-fluorescence, the integrated Raman intensity (both before staining) and the fluorescence of the Thioflavin-S stained tissue images. The correlation between the bright spots in the auto-fluorescence and the Raman image is striking and clearly visible. The Thioflavin-S stained image further confirms the lack of convincing correlation between plaques and bright spots.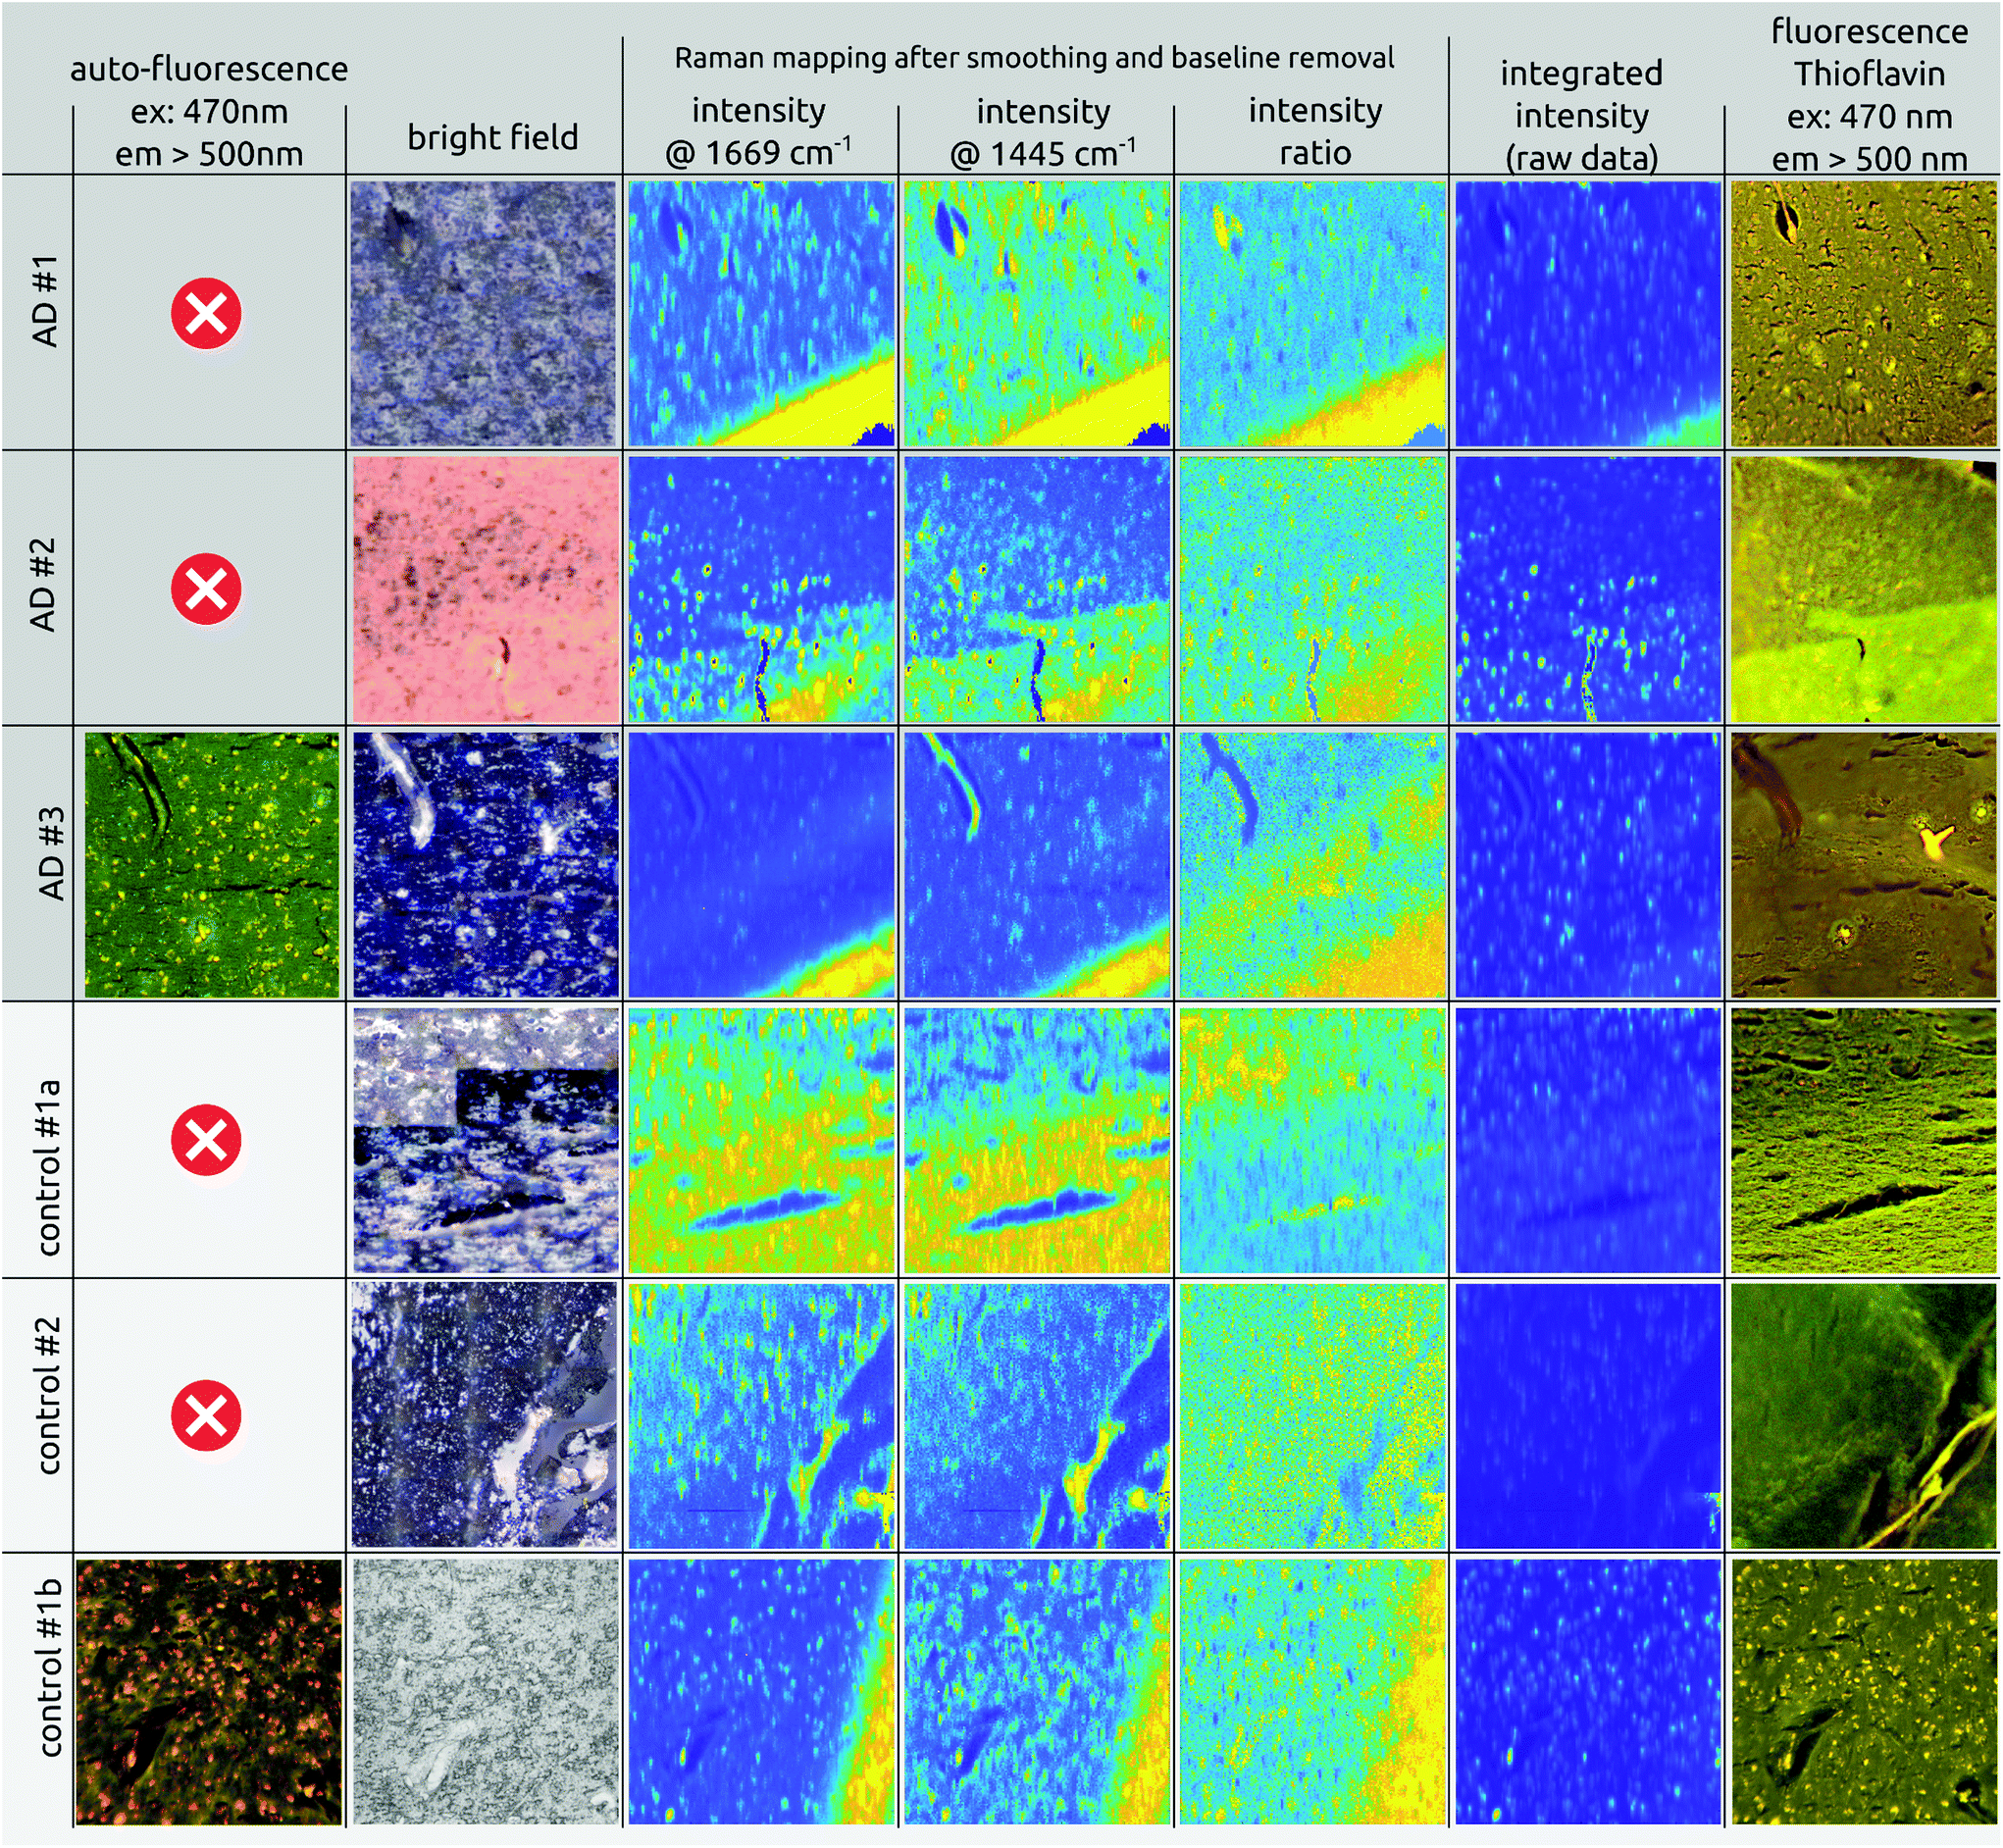 | ||
| Fig. 2 Overview of the brain tissue samples used in the present study. Rows 1 to 3: AD brain tissue (dark gray); rows 4 to 6: healthy control tissue (light gray). Columns depict different imaging modalities. From left to right: Auto-fluorescence; bright field images; Raman intensity mapping using wavenumbers 1669 and 1445 cm−1 (β-sheet and lipid); the intensity ratio of β-sheet/lipid; integrated intensity of the Raman spectra; fluorescence image of the Thioflavin-S stained tissue. Raman mapping images are contrast stretched for better visibility. Each image is 501 × 501 μm (except image C#2: 501 × 471 μm). All Raman intensity images are calculated with a bandwidth of 4 cm−1. | ||
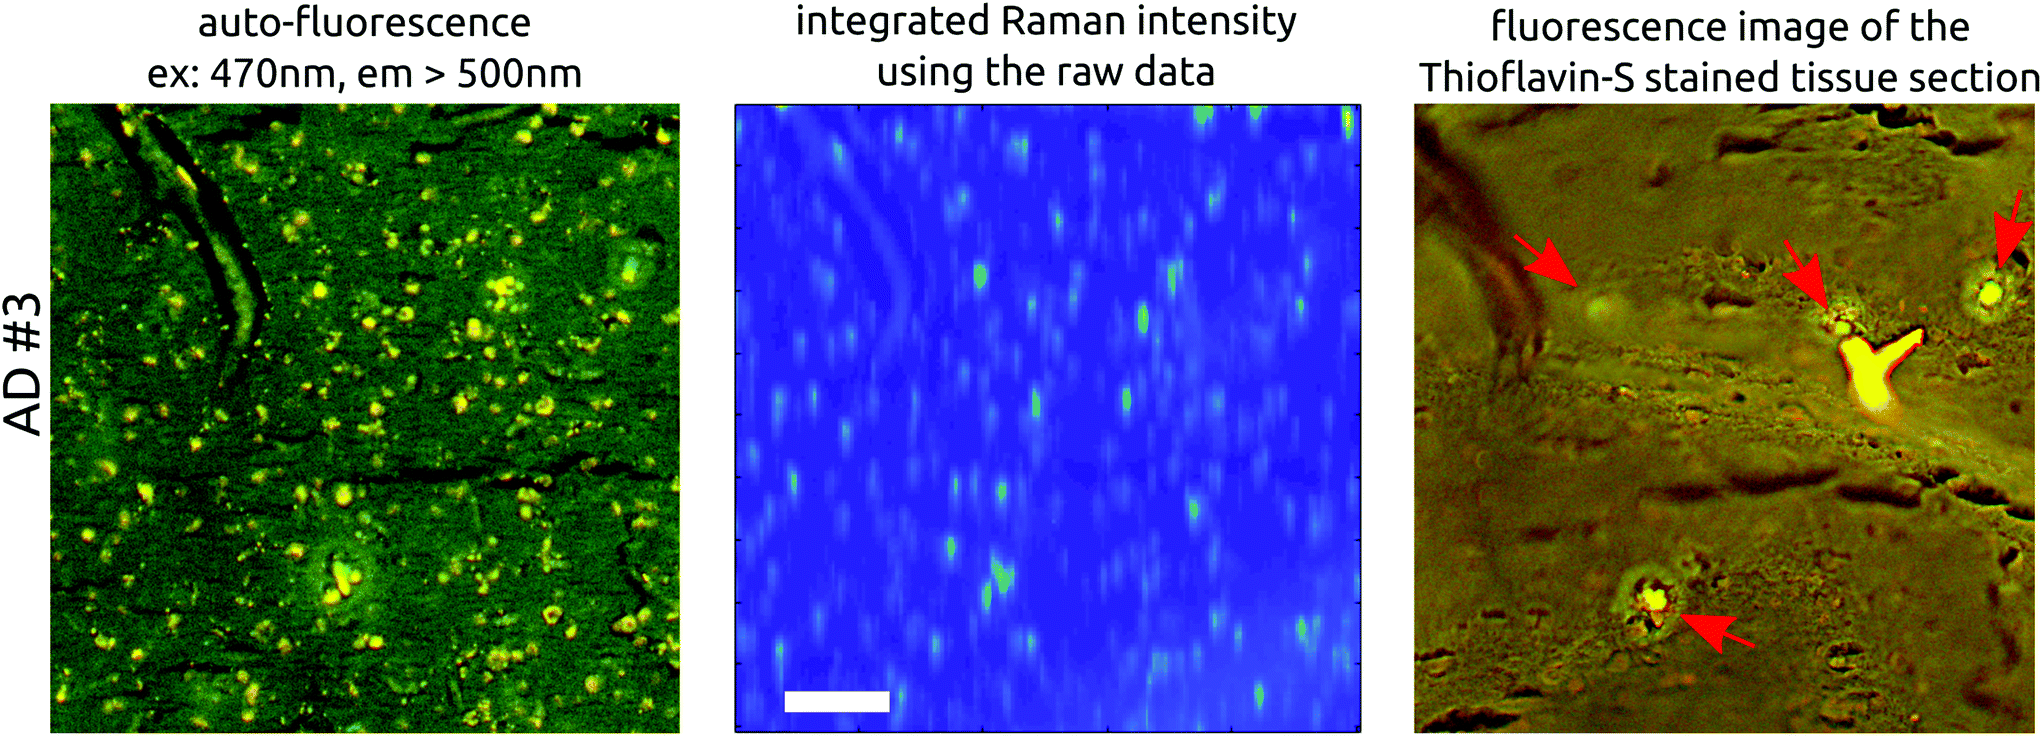 | ||
| Fig. 3 Enlarged view of AD #3, showing the auto-fluorescence images next to the integrated Raman intensity image and the Thioflavin-S stained image following Raman measurements. The bright auto-fluorescence spots (left image) match the spots of the Raman intensity image. On the contrary, Thioflavin-S staining confirms only three amyloid beta accumulations (red arrows). The big yellow ‘Y’ is debris. Scale bar is 100 μm. | ||
Column 2 in Fig. 2 shows the bright field or webcam images, illustrating the area chosen for imaging. For instance, the white to gray matter transition can be spotted (control #1a). The latter is confirmed by the lipid, 1445 cm−1, intensity image (column 4) where a higher lipid content is visible in the white matter due to myelin covering the nerve fibers.49–51
Columns 3 and 4 show intensity maps of Raman spectra at wavenumbers 1669 and 1445 cm−1, the expected β-sheet and lipid peaks integrated over a bandwidth of ±10 cm−1. As can be clearly seen in all mapping images, in both AD and healthy cases, the high intensity spot values coincide with the bright spots found in the auto-fluorescence images. These are attributed to the portion of fluorescence superimposed on the Raman signal (see spectra in Fig. 4). Even after removing the underlying fluorescence completely, by applying a 6th order polynomial baseline removal, we obtained a higher Raman signal compared to areas where little fluorescence background was present.
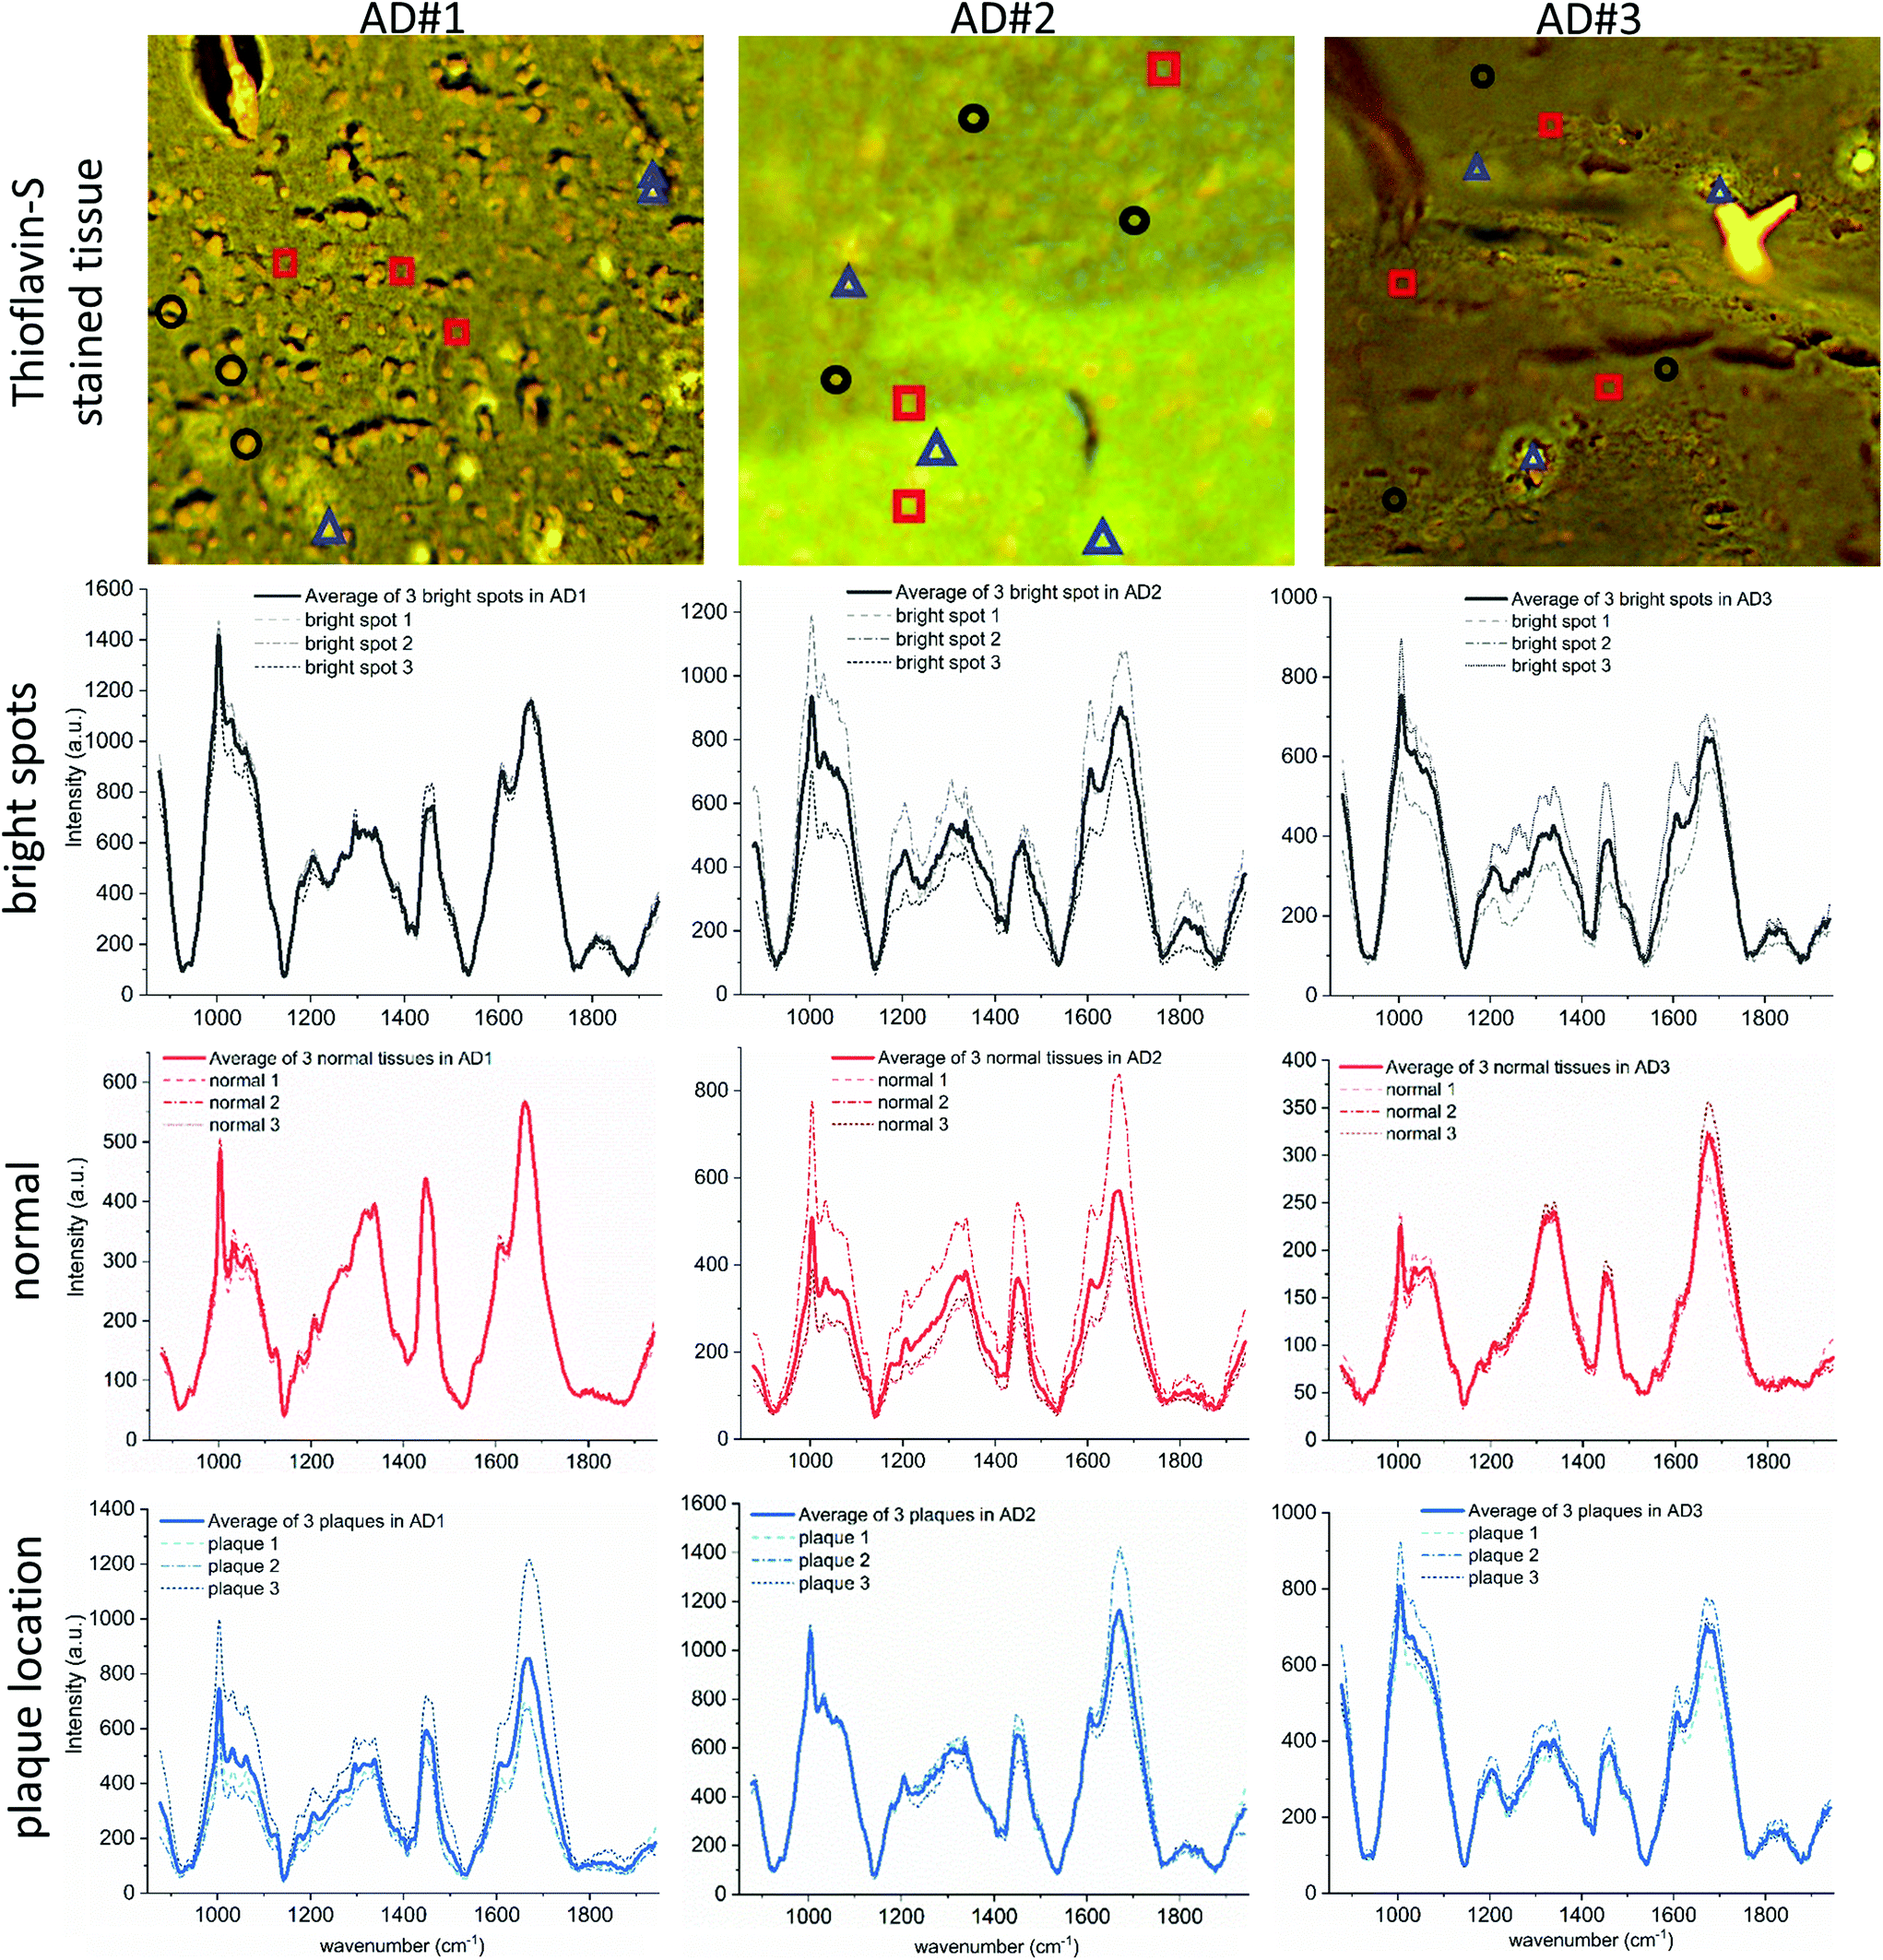 | ||
| Fig. 4 Spectral Raman data of all three AD cases. First row: Fluorescence images of the Thioflavin-S stained tissue. Areas where spectral data were taken consisted of 3 × 3 pixels and are marked with (i) black circles (bright spots), (ii) red squares (normal tissue) and (iii) blue triangles (plaque location). The corresponding spectra are shown in rows two to four, where the dashed lines depict the spectra of the three locations separately and the solid line represents the average of these. The tails at the beginning and end of the spectra are from the 6th order polynomial baseline removal. | ||
It is possible that the origin for fluorescence, probably a dense aggregate of insoluble molecules, is also the origin for the higher Raman signal in the bright spots. Possibly, the effective path length of the excitation light increases due to random scattering, which results in more Raman photons and thus a higher Raman signal across the spectrum. Multiple scattering can be noticed in dense areas compared to areas that are more transparent. Furthermore, a lower water content, and thus a higher density of biomolecules in general, may also play a role. The bright stripes, mainly in the corner of these images (AD #1, AD #3, and control #1b) are not coming from the tissue itself. They are rather impurities within the quartz glass substrate that was used during this study. We refer the reader to Fig. S2 of the ESI† for further details.
To investigate whether the ratio of the β-sheet to lipid peak could be an indicator for plaques, as proposed by others,22,33 we present the ratio mapping in column 5 of Fig. 2. Around wavenumber 1666 to 1670 cm−1 one would expect an intensity increase due to the expected β-sheet folding within amyloid deposits. However, the ratio images are not highlighting possible plaque locations. The protein to lipid ratio images lead to the conclusion that the ratio of the two distinct peaks is not an indicator for plaque locations as is confirmed by the Thioflavin-S stained image of the same tissue section.
The mapped images of column 6 of Fig. 2 show the integrated intensity of the Raman spectra (the sum of intensities per spectral measurement per pixel) of the raw, un-processed, data. Since there is no post-processing step involved, the data still contain a high amount of fluorescent background and therefore match the auto-fluorescence images perfectly. Furthermore, the bright spots in the integrated images are co-localized with the bright spots in the background subtracted Raman intensity images at 1669 cm−1 and 1445 cm−1. Hence, this is further evidence that fluorescence is highly correlated with the intensity of the Raman spectra, even though a baseline has been removed.
To provide evidence that amyloid plaques have been imaged and measured, we show the fluorescence images of the Thioflavin-S stained tissue in column 7. Plaques and deposits appear as bright yellow areas within the Thioflavin-S image. As can be seen in the control cases, bright yellow spots do not appear, confirming the healthy status of the brain tissue and the previously assessed Braak and Braak AD status. In the case of AD patients, bright yellow spots confirm the existence of amyloid-beta deposits, which are rarely co-localized with the auto-fluorescence spots (in unstained tissue) of the left column.16 The Thioflavin-S stained image of the third control case #1b, however, is not as clear as the other control cases, as also the fluorescent dots seemed to be labeled by Thioflavin-S. We are not certain about the reason but an explanation might be that this particular tissue was stained several weeks after the Raman images were taken. Hence, chances are that the tissue might have totally dried out and that the 10 min while Thioflavin-S was applied were not enough for the Thioflavin-S to be taken up and to stain the tissue. This particular Thioflavin-S fluorescence image resembles therefore the earlier taken auto-fluorescence image in a similar fashion by highlighting the bright fluorescence spots rather than an expected homogenous yellowish image. Usually, the strong Thioflavin-S fluorescence signal from Aβ deposits overwhelms the auto-fluorescence signal of the bright spots, as can be seen in the Thioflavin-S fluorescence images of the AD cases. Since control case #1b has no amyloid accumulation, the auto-fluorescence of the bright areas is still present. That is unfortunately not in line with control cases #1a and #2, where the Thioflavin-S stained tissue appears homogenous and brighter while at the same time suppressing the auto-fluorescence of the bright spots. We hypothesize that the delayed staining and the dried out tissue is the reason for the specific Thioflavin-S stain of the control case #1b.
Raman spectroscopy
The Raman intensity images, obtained from the recorded Raman spectra allow for manual segmentation of three different components within diseased tissue. Obviously, the spectral data could only be selected after obtaining the Thioflavin-S image, which indicates plaque positions within the tissue. Next, the resulting Thioflavin-S image was cropped to match the Raman imaged area and was subsequently superimposed. Afterward, the bright yellow spots, highlighting plaques in the tissue, provided visual guidance to choose the areas where “plaque spectra” had been measured earlier and those were taken for further analysis.Normal background tissue
The main component of the segmentation is what we call ‘normal’ or background tissue, meaning tissue without any special feature. It shows the expected Raman peaks for biological tissue at the wavenumbers 1003, 1445 and 1669 cm−1, representing phenylalanine, lipids and proteins, respectively. Overall, averaged background tissue spectra (red solid lines) are shown in the third row of Fig. 4 for each AD case. The dashed lines are the underlying averaged spectra taken from the areas selected based on the Thioflavin-S stained images (red squares).Bright spots
The second component of the segmentation are the ‘bright spots’. Their spectra are taken from regions indicated by the black circles, averaged, and shown in the second row of Fig. 4. The spots are easily identified since their overall Raman signal is high compared to other spectra and based on an intense and broad fluorescence background.48 Part of that is still visible after baseline removal and also found by others but possibly miss-interpreted as neuritic plaque spectra.24 These bright spots have a high intensity both in the auto-fluorescence image and in the background of the Raman images. This indicates an overall broad banded fluorescence coming from the underlying particles, since the auto-fluorescence images are taken with an excitation of 470 nm (resulting in yellow emission) and the Raman images with an excitation of 785 nm. Therefore, it must be due to a complex mixture of chromophores. The only substance that we are aware of that matches both the fluorescence background and the accumulation in elderly brain tissue is lipofuscin.52,53 Lipofuscin appears as tiny granulates, distributed throughout the tissue and was also mentioned as possible cause of fluorescence by others.16,24,54,55 It consists of yellow-brown pigments and residues of lysosomal digestion composed of oxidized protein and lipids,52,53 hence their strong appearances in the 1445 and 1669 cm−1 intensity images. Lipofuscin is also known to “accumulate progressively through the normal aging process in hippocampus”, in humans and in animals.56–60 Its broad fluorescence is also known from retinal imaging in humans61 and was described as fluorescence source by Chen et al., using two-photon fluorescence on live transgenic mice brain tissue.62,63 The tiny lipofuscin granulates, usually 0.1 to 5 μm in size,53,64 accumulate to deposits and fill the cytoplasm of cells, therefore reaching a size of 10 to 20 μm. That matches the size of the main feature described by Michael et al.24 as neuritic plaque in their recent publication. Their cluster analysis of the obtained spectra is purely based on intensity changes due to strong fluorescence, which is not necessarily associated with plaques in tissue. However, based on our data it rather appears that their hyperspectral Raman image shows a fluorescent, lipofuscin containing deposit with probably no relation to an amyloid beta accumulation. In fact, it matches the size of a potential lipofuscin deposit and its higher fluorescent background intensity. In addition, they were not able to confirm their findings with an adequate staining of the same location in the same tissue section. Here, in the presented study, we are able to confirm or reject a plaque deposit within our measured tissue areas as we obtain the fluorescence and Raman images in the same tissue section that was also later stained with Thioflavin-S. In addition, we show the immunohistochemically stained adjacent slices, independently confirming plaque occurrence in the chosen tissue location (see Fig. S9 in the ESI†). Furthermore, the bright spots caused mainly by lipofuscin fluorescence are also present in the healthy control tissue and consequently could not be plaques, which is also confirmed by the Thioflavin-S staining. To confirm lipofuscin as cause of the strong fluorescence signal we stained a formalin fixed, five μm thick tissue section with Sudan Black B, which is known as specific histochemical stain for lipofuscin.65,66 In Fig. 5, we compare the auto-fluorescence image of the deparaffinized tissue with the white light image after staining with Sudan Black B. By binding this dye, the lipofuscin deposits appear now as black dotted areas under white light and exactly match the bright yellow spots in the auto-fluorescence image. Nevertheless, it is important to mention that lipofuscin deposits have been found co-localized within amyloid-beta deposits before.16,67 In our study, we also found matches between a lipofuscin accumulation and plaque location. However, as also described in the previous cited studies,68 that it is rarely the case. In AD #3, a few of the bright spots coincide with plaque locations but in case AD #2 the plaques appear mainly in locations where no bright spots are present.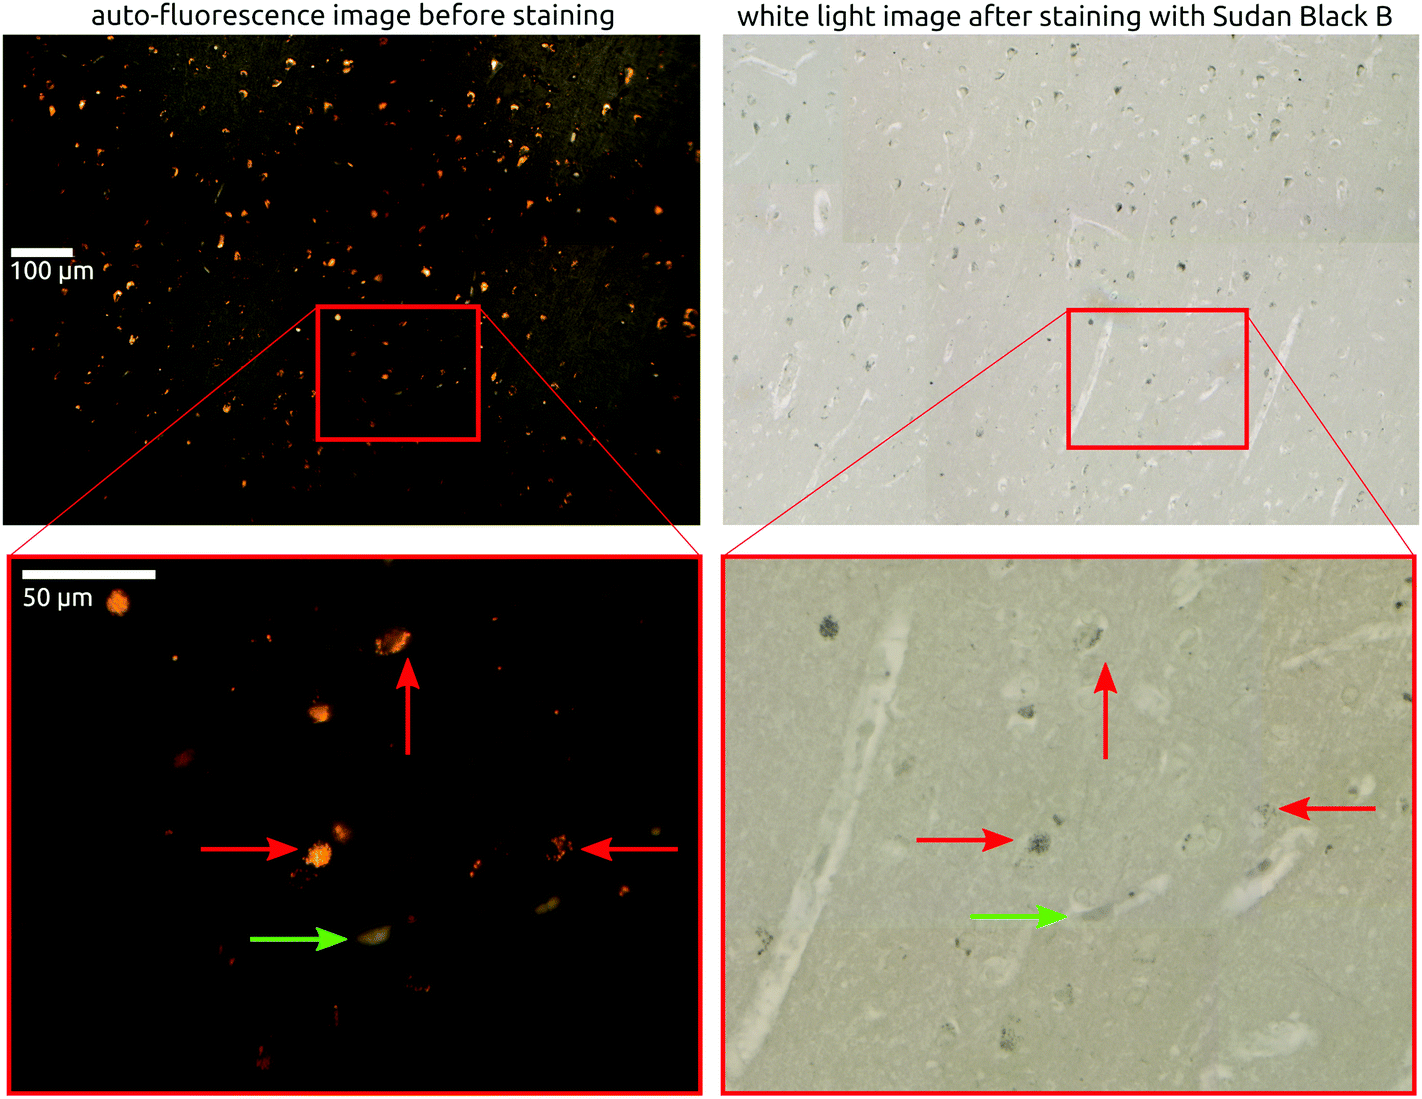 | ||
| Fig. 5 Left side shows the auto-fluorescence image of the tissue. The yellow bright spots are lipofuscin deposits, filled with lipofuscin granulates. The Sudan Black B staining of the exact same tissue (right side, white light images) confirms the lipofuscin as the same bright spots are now stained in black. The red arrows depict some of the lipofuscin deposits before and after staining. The green arrows point to a possible blood vessel, filled with remaining blood, showing some fluorescence. | ||
Yet, it can be argued that both, amyloid beta and lipofuscin, are “metabolic waste”69 heaps or “a depot of unexcreted waste products”57 and therefore accumulate in similar areas. Furthermore, lipofuscin is known to be an age related pigment granules and known for its increased accumulation with age.52,59,70 Neuronal somas, filled with lipofuscin, were found in human brain tissue.71 Further, lipofuscin was also found next to microglia,52 in mice and rat brain tissue.56,62
Plaque locations
A third component of the manual segmentation are the spectra of confirmed plaque locations. The location of plaques and hence their spectra is only known from the fluorescence image of the Thioflavin-S stained tissue. In Fig. 4, we show the selected plaque areas, indicated with blue triangles. Their spectra are plotted in the fourth row of Fig. 4 (blue solid lines).For ease of comparison, the overall averaged spectra are shown in Fig. 6. It shows that the plaque spectrum (blue solid line) falls completely within the standard deviation of the spectrum of the bright, lipofuscin enriched spots and is therefore not as unique as former studies suggest.22,72 This would make it very difficult to use the spectra as unique identifier for plaques within AD diseased brain tissue. Furthermore, one should notice that all three types of spectra look very similar in shape and general trend, but differ somewhat only in overall intensity, which we hypothesize is based on the underlying increased scattering and does not show obvious spectral differences. The amide I band of both the plaque locations and the bright spots shows a pronounced flank around 1670 cm−1, in line with an elevated β-sheet level. This spectral feature would allow distinction from the background tissue (red spectra) but not from each other. Furthermore, we analyzed the areas under the main peaks and their variation in the amide I and lipid region but obtained only results quite similar as the peak analysis and these are therefore not shown in this report. For further proof that plaque associated regions are not easily identifiable based on their Raman spectra, we provide the results of a principal component analysis and Multivariate Curve Resolution-Alternating Least Squares analysis on case AD #3 tissue in Fig. S5, S6 and S7 in the ESI.†
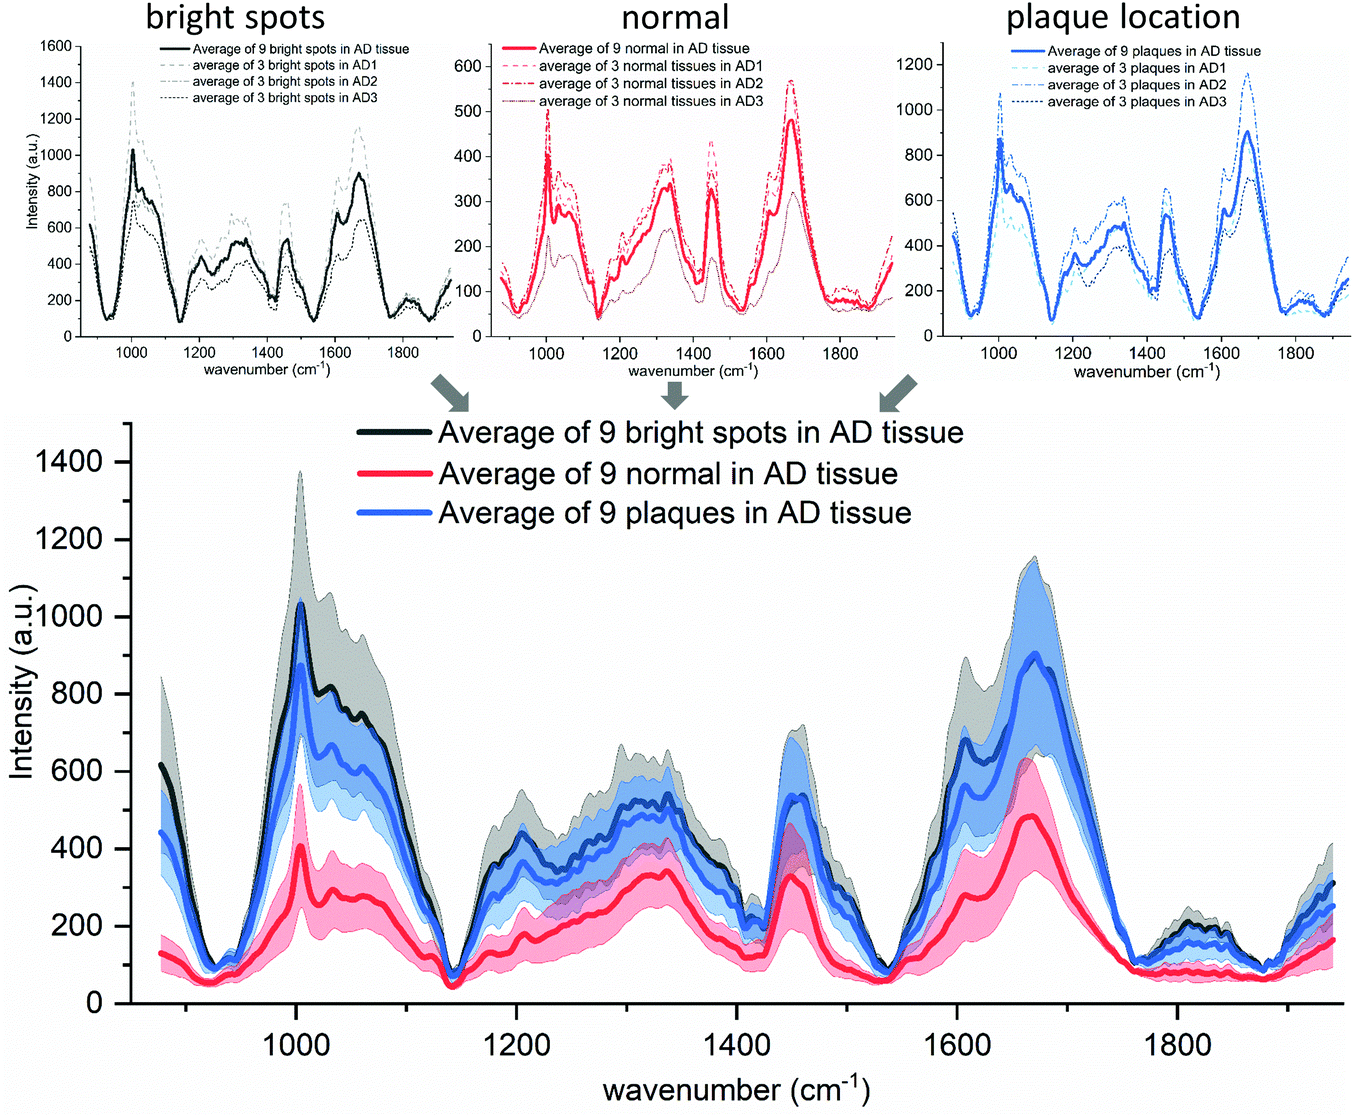 | ||
| Fig. 6 Spectral comparison of the three AD cases. The top row shows the average (solid line) of the three measured AD tissue spectra (dashed lines are equal to the solid lines in Fig. 4). The bottom graph shows the average spectra for each tissue feature (solid lines: black, red and blue) and their standard deviation (gray, light red and light blue, respectively). | ||
However, Ryzhikova et al. suggest the use of artificial neural networks as spectral changes might “not be visible by eye” but might be picked up by machine learning methodologies.11 That could be tested in the future, but our spectral data look diverse; the inter-spectral variability is probably too high to obtain any specific Aβ spectra that could be used for unambiguous plaque identification.
The recent results of Ji et al. raise the question if fixed tissue is even suitable for the detection of the possible β-sheet configuration change within the protein peak.18 When using stimulated Raman spectroscopy (SRS) on transgenic mouse brain tissue, they were able to detect amyloid beta plaques only when using fresh or freshly frozen tissue. The detection failed when using fixed tissue sections.73
As mentioned before, in our formalin fixed tissue we observed that lipofuscin and amyloid beta could spatially accumulate in the same regions, but only in rare cases. More precisely, they rarely occur in exactly the same spots, which supports the claim that a spectral distinction is impossible if the raster imaging step size and laser spot size of the Raman spectroscope do not provide the possibility for high-resolution differentiation.
Fused quartz substrate interference
A fourth component of the Raman spectra represents the luminescent impurities inside the quartz glass substrate, which are superimposed on the spectra obtained from the overlying tissue. The spectra are shown in more detail in Fig. S2 of the ESI.† These impurity patches were also observed outside the tissue and even with empty unused substrates. However, they were not observed in the auto-fluorescence images with 470 nm excitation. Nonetheless, the impact of its existence can be best seen in the Raman intensity images of Fig. 2, especially in AD #1, AD #3, and control #1b, as bright stripes crossing the complete tissue. The existence of those unwanted impurities render the Raman measurements taken from the overlaying locations invalid. Hence, further studies will be carried out using a different substrate. One could argue that the quartz glass impurities would bias our results and could be the reason for not finding plaque specific spectra. We tested this idea, but as shown in the ESI,† PCA (Fig. S5 and S6†) and MCR-ALS (Fig. S7†) should still have been able to produce positive results even though a strong and unwanted spectrum was present. In addition, the spectra we have chosen for our analysis were carefully selected from areas where the substrate impurities were not present, as can be seen in the images of row one in Fig. 4.Healthy control tissue
We also have calculated spectral averages from the control tissue. Apart from the quartz impurity, we only obtained spectra from the bright spots and the ‘normal’ background tissue. Averages of all three control samples are plotted in Fig. 7 against their complement obtained from diseased tissue. The detailed spectra are shown in Fig. S8 in the ESI.† Again, spectral differences are mainly found in the overall intensity. It is worth to mention that the spectra of the normal tissue taken from the AD cases have a higher background than the healthy control cases (Fig. 7b, red lines), which might be related to oxidative stress. On the other hand, the spectra of the bright lipofuscin spots of the AD and control samples are almost identical but with a higher standard deviation in the control tissues.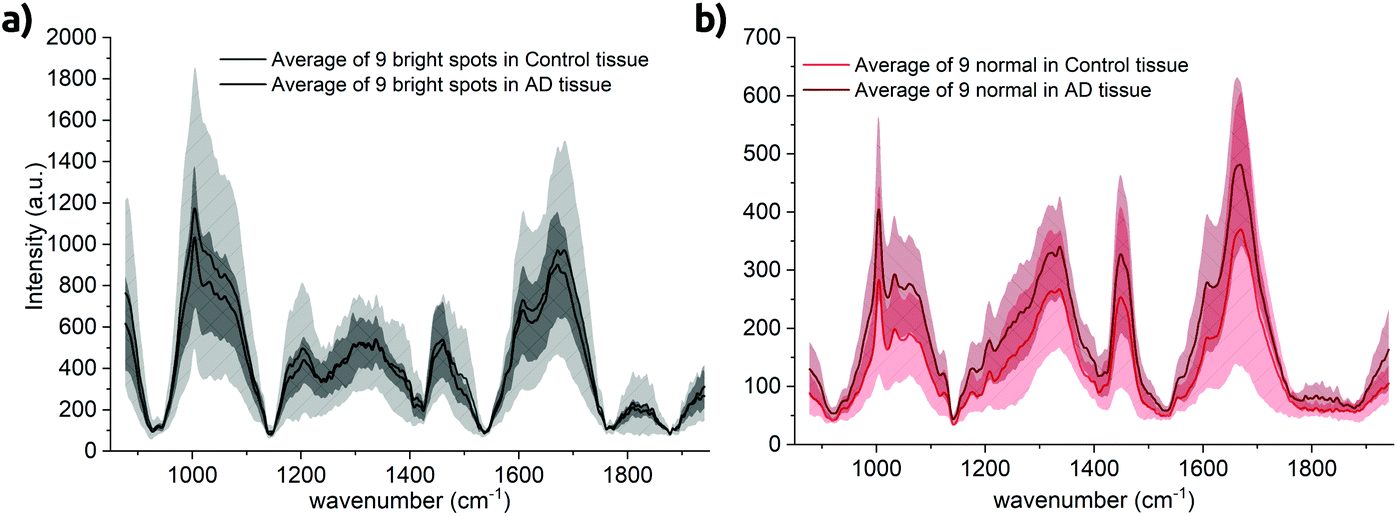 | ||
| Fig. 7 Comparison of spectral distribution within control and AD tissue. (a) Spectra taken from bright spot locations. The standard deviation of the bright spots of the control tissue is depicted in light gray and almost double compared to the standard deviation of bright spots taken from AD tissue (b) spectra taken from ‘normal’ tissue. Overall background is higher in the AD tissue. | ||
The number of bright spots seems to be roughly equal for AD and control cases. Furthermore, we did not compare the amount of lipofuscin58 or size differences of lipofuscin granules between white and gray matter,74 nor between AD and healthy cases.
5. Conclusion
In the presented study, we compared Alzheimer diseased brain tissue with healthy control tissue, using the hyperspectral mapping capabilities of a conventional Raman spectroscopy instrument. Label-free Raman intensity images show no clear spectral differences between AD and control cases; neither do ratio images of different wavenumbers. Sudworth et al. have reported on the general differentiation between AD and healthy control brain tissue in humans using Raman spectroscopy, but did not aim to spectrally identify Aβ accumulations specifically.22 Although Archer et al. aimed at finding a specific component within human AD tissue using principal component analysis (PCA), they were not able to present evidence that the spectra were indeed recorded from Aβ deposits and not caused by other components.23 Both studies have in common that they used freshly frozen tissue without prior fixation, a Raman illumination source of λ = 830 nm and a bulky piece of tissue rather than a thin tissue section. In addition, both papers do not show confirmation that amyloid-beta plaques were imaged. Here, Thioflavin-S staining confirms the neuropathological pre-study diagnosis by indicating amyloid deposits as bright yellow spots. In addition, we measured bright fluorescent spots, which are equally uniformly distributed throughout both kinds of tissue and are probably mainly lipofuscin deposits, which could co-localize in rare cases with plaque locations. However, in most cases they are not correlated to plaques as shown in the Thioflavin-S stained images and due to their appearance in healthy control tissue.The used hardware made the spectral analysis very challenging since the objective in the Raman microscope introduced some additional luminescence background as also reported elsewhere before.75 Furthermore, the quartz glass substrate added an interfering spectral component, which made part of the measurements unusable. Preliminary measurements show much cleaner spectra when using a low fluorescence objective and CaF2 substrate and these will therefore be used in subsequent studies. The fluorescence, introduced by the high lipofuscin content could possibly be avoided when a longer wavelength illumination source for Raman spectroscopy is chosen.76 The relatively long acquisition time of spontaneous Raman scattering when measuring a large area could be overcome either by non-scanning Raman techniques77 or by stimulated Raman scattering (SRS) imaging.18
Funding
This research is supported by the Dutch Technology Foundation STW (grant number 13935, I-READ), which is part of the Netherlands Organization of Scientific Research (NWO), and which is partly funded by the Ministry of Economic Affairs.Conflicts of interest
The authors declare no competing financial interests.Acknowledgements
The authors would like to thank Pien S. Bouman and Sjoerd D. Kok for helping to obtain data and for preparing parts of the figures used in this report.Post mortem brain tissue was obtained from the Netherlands Brain Bank (NBB; Amsterdam, the Netherlands).
References
- J. L. Cummings, N. Engl. J. Med., 2004, 351, 56–67 CrossRef CAS PubMed.
- J. den Haan, T. H. J. Morrema, F. D. Verbraak, J. F. de Boer, P. Scheltens, A. J. Rozemuller, A. A. B. Bergen, F. H. Bouwman and J. J. Hoozemans, Acta Neuropathol. Commun., 2018, 6, 1–11 CrossRef PubMed.
- D. J. Selkoe, Neuron, 1991, 6, 487–498 CrossRef CAS PubMed.
- J. Hardy and D. Allsop, Trends Pharmacol. Sci., 1991, 12, 383–388 CrossRef CAS PubMed.
- K. Beyreuther and C. L. Masters, Brain Pathol., 1991, 1, 241–251 CrossRef CAS PubMed.
- D. J. Selkoe and J. Hardy, EMBO Mol. Med., 2016, 8, 595–608 CrossRef CAS PubMed.
- N. Andreasen and H. Zetterberg, Curr. Med. Chem., 2008, 15, 766–771 CrossRef CAS PubMed.
- P. Mecocci, L. Paolacci and V. Boccardi, Geriatr. Care, 2018, 4, 29–32 Search PubMed.
- W. E. Klunk, H. Engler, A. Nordberg, Y. Wang, G. Blomqvist, D. P. Holt, M. Bergström, I. Savitcheva, G. Huang, S. Estrada, B. Ausen, M. L. Debnath, J. Barletta, J. C. Price, J. Sandell, B. J. Lopresti, A. Wall, P. Koivisto, G. Antoni, C. A. Mathis and B. Långström, Am. Neurol. Assoc., 2004, 55, 306–319 CrossRef CAS PubMed.
- M. D. Ikonomovic, W. E. Klunk, E. E. Abrahamson, C. A. Mathis, J. C. Price, N. D. Tsopelas, B. J. Lopresti, S. Ziolko, W. Bi, W. R. Paljug, M. L. Debnath, C. E. Hope, B. A. Isanski, R. L. Hamilton and S. T. DeKosky, Brain, 2008, 131, 1630–1645 CrossRef PubMed.
- E. Ryzhikova, O. Kazakov, L. Halamkova, D. Celmins, P. Malone, E. Molho, E. A. Zimmerman and I. K. Lednev, J. Biophotonics, 2015, 8, 584–596 CrossRef PubMed.
- S. Mordechai, E. Shufan, B. S. Porat Katz and A. Salman, Analyst, 2017, 142, 1276–1284 RSC.
- M. Paraskevaidi, C. L. M. Morais, D. E. Halliwell, D. M. A. Mann, D. Allsop, P. L. Martin-Hirsch and F. L. Martin, ACS Chem. Neurosci., 2018, 9, 2786–2794 CrossRef CAS PubMed.
- Z. Fišar, R. Jirák, M. Zvěřová, V. Setnička, L. Habartová, J. Hroudová, Z. Vaníčková and J. Raboch, Clin. Biochem., 2019, 1–10 Search PubMed.
- S. Ikeda, D. Allsop and G. G. Glenner, Lab. Invest., 1989, 60, 113–122 CAS.
- M. R. D'Andrea, R. G. Nagele, N. A. Gumula, P. A. Reiser, D. A. Polkovitch, B. M. Hertzog and P. Andrade-Gordon, Neurosci. Lett., 2002, 323, 45–49 CrossRef.
- J. Kiskis, H. Fink, L. Nyberg, J. Thyr, J. Y. Li and A. Enejder, Sci. Rep., 2015, 5, 1–9 Search PubMed.
- M. Ji, M. Arbel, L. Zhang, C. W. Freudiger, S. S. Hou, D. Lin, X. Yang, B. J. Bacskai and X. S. Xie, Sci. Adv., 2018, 4, 1–8 CrossRef PubMed.
- Y. Koronyo, D. Biggs, E. Barron, D. S. Boyer, J. A. Pearlman, W. J. Au, S. J. Kile, A. Blanco, D.-T. Fuchs, A. Ashfaq, S. Frautschy, G. M. Cole, C. A. Miller, D. R. Hinton, S. R. Verdooner, K. L. Black and M. Koronyo-Hamaoui, JCI Insight, 2017, 2, 1–19 CrossRef PubMed.
- J. den Haan, T. H. J. Morrema, A. J. Rozemuller, F. H. Bouwman and J. J. M. Hoozemans, Acta Neuropathol. Commun., 2018, 6, 75–87 CrossRef PubMed.
- F. Palombo, F. Tamagnini, J. C. G. Jeynes, S. Mattana, I. Swift, J. Nallala, J. Hancock, J. T. Brown, A. D. Randall and N. Stone, Analyst, 2018, 143, 850–857 RSC.
- C. D. Sudworth and N. Krasner, Proc. of SPIE: Biomedical Vibrational Spectroscopy and Biohazard Detection Technologies, 2004, vol. 5321, pp. 93–101 Search PubMed.
- J. K. J. Archer, C. D. Sudworth, R. Williams, T. How, N. Stone, D. Mann and R. A. Black, Proc. of SPIE-OSA Biomedical Optics: Diagnostic Optical Spectroscopy in Biomedicine IV, 2007, vol. 6628, pp. 1–10 Search PubMed.
- R. Michael, A. Lenferink, G. F. J. M. Vrensen, E. Gelpi, R. I. Barraquer and C. Otto, Sci. Rep., 2017, 7, 1–11 CrossRef CAS PubMed.
- L. Guerrini, R. Arenal, B. Mannini, F. Chiti, R. Pini, P. Matteini and R. A. Alvarez-Puebla, ACS Appl. Mater. Interfaces, 2015, 7, 9420–9428 CrossRef CAS PubMed.
- J. W. Evans, R. J. Zawadzki, R. Liu, J. W. Chan, S. M. Lane and J. S. Werner, J. Biophotonics, 2009, 2, 398–406 CrossRef CAS PubMed.
- P. Eugui, A. Lichtenegger, M. Augustin, D. J. Harper, M. Muck, T. Roetzer, A. Wartak, T. Konegger, G. Widhalm, C. K. Hitzenberger, A. Woehrer and B. Baumann, Biomed. Opt. Express, 2017, 9, 2476–2494 CrossRef PubMed.
- Handbook of Biomedical Optics, ed. D. A. Boas, C. Pitris and N. Ramanujam, CRC Press, Taylor & Francis Group, New York, 2011, pp. 233–254 Search PubMed.
- J. M. Benevides, S. A. Overman and G. J. Thomas Jr., in Current Protocols in Protein Science, 2003, pp. 1–35 Search PubMed.
- D. W. Shipp, F. Sinjab and I. Notingher, Adv. Opt. Photonics, 2017, 9, 315 CrossRef.
- E. Cordero, J. Biomed. Opt., 2018, 23, 1 Search PubMed.
- Z. Movasaghi, S. Rehman and I. U. Rehman, Appl. Spectrosc. Rev., 2007, 42, 493–541 CrossRef CAS.
- R. Michael, C. Otto, A. Lenferink, E. Gelpi, G. A. Montenegro, J. Rosandić, F. Tresserra, R. I. Barraquer and G. F. J. M. Vrensen, Exp. Eye Res., 2014, 119, 44–53 CrossRef CAS PubMed.
- J. Dong, C. S. Atwood, V. E. Anderson, S. L. Siedlak, M. A. Smith, G. Perry and P. R. Carey, Biochemistry, 2003, 42, 2768–2773 CrossRef CAS PubMed.
- D. R. Thal, C. Schultz, I. Sassin, E. Ghebremedhin, K. Del Tredici, E. Braak and H. Braak, J. Neuropathol. Exp. Neurol., 2000, 59, 733–748 CrossRef CAS PubMed.
- H. Braak and E. Braak, Acta Neuropathol., 1991, 82, 239–259 CrossRef CAS PubMed.
- D. R. Thal, U. Rüb, M. Orantes and H. Braak, Neurology, 2002, 58, 1791–1800 CrossRef PubMed.
- S. S. Mirra, A. Heyman, D. McKeel, S. M. Sumi, B. J. Crain, L. M. Brownlee, F. S. Vogel, J. P. Hughes, G. van Belle and L. Berg, Neurology, 1991, 41, 479 LP CrossRef PubMed.
- B. T. Hyman, C. H. Phelps, T. G. Beach, E. H. Bigio, N. J. Cairns, M. C. Carrillo, D. W. Dickson, C. Duyckaerts, M. P. Frosch, E. Masliah, S. S. Mirra, P. T. Nelson, J. A. Schneider, D. R. Thal, B. Thies, J. Q. Trojanowski, H. V. Vinters, T. J. Montine, C. H. Phelps, T. G. Beach, E. H. Bigio, N. J. Cairns, D. W. Dickson, C. Duyckaerts, M. P. Frosch, E. Masliah, S. S. Mirra, P. T. Nelson, J. A. Schneider, D. R. Thal, J. Q. Trojanowski, H. V. Vinters and B. T. Hyman, Alzheimer's Dementia, 2013, 8, 1–13 Search PubMed.
- L. M. Fullwood, D. Griffiths, K. Ashton, T. Dawson, R. W. Lea, C. Davis, F. Bonnier, H. J. Byrne and M. J. Baker, Analyst, 2013, 139, 446–454 RSC.
- E. Ó. Faoláin, M. B. Hunter, J. M. Byrne, P. Kelehan, H. A. Lambkin, H. J. Byrne and F. M. Lyng, J. Histochem. Cytochem., 2005, 53, 121–129 CrossRef PubMed.
- T. C. Dickson and J. C. Vickers, Neuroscience, 2001, 105, 99–107 CrossRef CAS PubMed.
- N. A. Verwey, J. J. M. Hoozemans, C. Korth, M. R. Van Royen, I. Prikulis, D. Wouters, H. A. M. Twaalfhoven, E. S. Van Haastert, D. Schenk, P. Scheltens, A. J. M. Rozemuller, M. A. Blankenstein and R. Veerhuis, Amyloid, 2013, 20, 179–187 CrossRef CAS PubMed.
- F. Bonnier, A. Mehmood, P. Knief, A. Meade and H. Lambkin, J. Raman Spectrosc., 2011, 42, 888–896 CrossRef CAS.
- V. Mazet, Background correction, https://www.mathworks.com/matlabcentral/fileexchange/27429-background-correction.
- V. Mazet, C. Carteret, D. Brie, J. Idier and B. Humbert, Chemom. Intell. Lab. Syst., 2005, 76, 121–133 CrossRef CAS.
- L. T. Kerr and B. M. Hennelly, Chemom. Intell. Lab. Syst., 2016, 158, 61–68 CrossRef CAS.
- E. B. Hanlon, I. Itzkan, R. R. Dasari, M. S. Feld, R. J. Ferrante, A. C. McKee, D. Lathi and N. W. Kowall, Photochem. Photobiol., 1999, 70, 236–242 CAS.
- G. Ayala, P. Carmona and J. Monreal, Eur. Biophys. J., 1987, 14, 219–225 CrossRef CAS PubMed.
- R. E. Kast, G. W. Auner, M. L. Rosenblum, T. Mikkelsen, S. M. Yurgelevic, A. Raghunathan, L. M. Poisson and S. N. Kalkanis, J. Neuro-Oncol., 2014, 120, 55–62 CrossRef CAS PubMed.
- R. Kast, G. Auner, S. Yurgelevic, B. Broadbent, A. Raghunathan, L. M. Poisson, T. Mikkelsen, M. L. Rosenblum and S. N. Kalkanis, J. Neuro-Oncol., 2015, 125, 287–295 CrossRef CAS PubMed.
- L. Lei, R. Tzekov, S. Tang and S. Kaushal, Mol. Vision, 2012, 18, 103–113 CAS.
- T. Jung, N. Bader and T. Grune, Ann. N. Y. Acad. Sci., 2007, 1119, 97–111 CrossRef CAS PubMed.
- M. R. D'Andrea, Intracellular Consequences of Amyloid in Alzheimer's Disease, 2016, pp. 1–14 Search PubMed.
- S. Itagaki, P. L. McGeer, H. Akiyama, S. Zhu and D. Selkoe, J. Neuroimmunol., 1989, 24, 173–182 CrossRef CAS PubMed.
- S. Singh Kushwaha, N. Patro and I. Kumar Patro, Ann. Neurosci., 2018, 4, 223–233 CrossRef PubMed.
- R. S. Sohal and L. S. Wolfe, Prog. Brain Res., 1986, 70, 171–183 CAS.
- R. L. Friede, Acta Neuropathol., 1962, 2, 113–125 CrossRef CAS.
- W. J. Streit and Q.-S. Xue, Aging Dis., 2010, 1, 254–261 Search PubMed.
- D. De Biase, A. Costagliola, T. B. Pagano, G. Piegari, S. Wojcik, J. Dziewiatkowski, E. Grieco, G. Mattace Raso, V. Russo, S. Papparella and O. Paciello, BMC Vet. Res., 2017, 13, 1–9 Search PubMed.
- J. Sparrow and T. Duncker, J. Clin. Med., 2014, 3, 1302–1321 CrossRef PubMed.
- C. Chen, Z. Liang, B. Zhou, X. Li, C. Lui, N. Y. Ip and J. Y. Qu, ACS Chem. Neurosci., 2018, 9, 3128–3136 CrossRef CAS PubMed.
- C. Chen, Z. Liang, B. Zhou, N. Ip and J. Y. Qu, Proc. of SPIE: Neural Imaging and Sensing, 2018, vol. 10481, 0A 1–6 Search PubMed.
- C. L. Dolman and P. M. MacLeod, Lipofuscin and its Relation to Aging, Academic Press, Inc., 1981, vol. 2 Search PubMed.
- K. Evangelou and V. G. Gorgoulis, in Oncogene-Induced Senescence: Methods and Protocols, Methods in Molecular Biology, ed. M. A. Nikiforov, Springer Science+Business Media, New York, 2017, vol. 1534, pp. 111–119 Search PubMed.
- E. A. Georgakopoulou, K. Tsimaratou, K. Evangelou, M.-P. J. Fernandez, V. Zoumpourlis, I. P. Trougakos, D. Kletsas, J. Bartek, M. Serrano and V. G. Gorgoulis, Aging, 2013, 5, 37–50 CAS.
- L. I. Benowitz, W. Rodriguez, P. Paskevich, E. J. Mufson, D. Schenk and R. L. Neve, Exp. Neurol., 1989, 106, 237–250 CrossRef CAS PubMed.
- M. R. D'Andrea, in Bursting Neurons and Fading Memories - An Alternative Hypothesis of the Pathogenesis of Alzheimer's Disease, Academic Press, 2015, pp. 33–41 Search PubMed.
- M. Nedergaard, Neuroscience, 2013, 340, 1529–1530 CAS.
- P. Thériault and S. Rivest, Curr. Biol., 2016, 26, R772–R775 CrossRef PubMed.
- M. Ji, S. H. Ramkissoon, M. Garrard, A. C. Wang, S. Lewis, N. Sanai, A. Fisher-Hubbard, O. Sagher, S. Camelo-Piragua, C. O. Maher, D. Fu, M. Snuderl, S. Venneti, D. A. Orringer, T. D. Johnson, X. S. Xie, C. W. Freudiger, J. A. Heth and M. Ji, Sci. Transl. Med., 2015, 7, 309ra163 CrossRef PubMed.
- P. J. Eravuchira, M. Banchelli, C. D'Andrea, M. De Angelis, P. Matteini and I. Gannot, Proc. of SPIE: Optical Fibers and Sensors for Medical Diagnostics and Treatment Applications, 2019, vol. 1087211, pp. 11–17 Search PubMed.
- M. Ji, M. Arbel, L. Zhang, C. W. Freudiger, S. S. Hou, D. Lin, X. Yang, B. J. Bacskai and X. S. Xie, Sci. Adv., 2018, 4, 1–4 Search PubMed.
- S. Safaiyan, N. Kannaiyan, N. Snaidero, S. Brioschi, K. Biber, S. Yona, A. L. Edinger, S. Jung, M. J. Rossner and M. Simons, Nat. Neurosci., 2016, 19, 995–998 CrossRef CAS PubMed.
- L. T. Kerr, H. J. Byrne and B. M. Hennelly, Anal. Methods, 2015, 7, 5041–5052 RSC.
- H. J. Butler, L. Ashton, B. Bird, G. Cinque, K. Curtis, J. Dorney, K. Esmonde-White, N. J. Fullwood, B. Gardner, P. L. Martin-Hirsch, M. J. Walsh, M. R. McAinsh, N. Stone and F. L. Martin, Nat. Protoc., 2016, 11, 664–687 CrossRef CAS PubMed.
- E. Schmälzlin, B. Moralejo, I. Gersonde, J. Schleusener, M. E. Darvin, G. Thiede and M. M. Roth, J. Biomed. Opt., 2018, 23, 1–11 Search PubMed.
Footnote |
| † Electronic supplementary information (ESI) available. See DOI: 10.1039/c9an02087j |
| This journal is © The Royal Society of Chemistry 2020 |