 Open Access Article
Creative Commons Attribution 3.0 Unported Licence
Infrared spectra of micro-structured samples with microPhotoacoustic spectroscopy and synchrotron radiation
Kirk H.
Michaelian
 *a,
Mark D.
Frogley
 b,
Gianfelice
Cinque
b and
Luca
Quaroni
 c
c
aNatural Resources Canada, CanmetENERGY Devon, One Oil Patch Drive, Devon, Alberta T9G 1A8, Canada. E-mail: Kirk.Michaelian@canada.ca
bDiamond Light Source Limited, Harwell Science and Innovation Campus, Chilton, Didcot, Oxfordshire OX11 0DE, UK
cDepartment of Physical Chemistry and Electrochemistry, Faculty of Chemistry, Jagiellonian University, ul. Gronostajowa 2, 30-387, Kraków, Poland
First published on 23rd December 2019
Abstract
Photoacoustic spectroscopy (PAS) measures the photon absorption spectrum of a sample through detection of the acoustic wave generated by the photothermal effect as one modulates the intensity of the incident radiation at each wavelength. We have recently demonstrated the implementation of PAS in a microscopy configuration with mid-infrared radiation (microPAS). In the present work, we describe the performance of microPAS using synchrotron radiation (SR) in diffraction-limited spectromicroscopy and imaging experiments. Spectra were obtained for polystyrene beads, polypropylene fibres, and single fibres of human hair. SR produced microPAS spectra of much higher intensity as compared with those obtained using conventional mid- and near-infrared sources. For hair samples, the penetration depth of mid-infrared light, even with bright SR, is significantly shorter than the probed sample thickness at very low modulation frequencies resulting in saturated PAS spectra. In contrast, microPAS spectra of polymer beads were in general of much better quality than those obtained with conventional sources. We also demonstrated the capability to collect line profiles and line spectra at diffraction limited spatial resolution. The microPAS spectra of beads appear free from appreciable bandshape distortions arising from the real part of the refractive index of the sample. This observation confirms microPAS as an absorption-only technique and establishes it as a valuable new tool in the microspectroscopic analysis of particulates and of samples with a complex topography.
Introduction
Photoacoustic spectroscopy (PAS) belongs to the diverse group of photothermal techniques that are widely used for materials characterisation.1 When the wavelength of modulated incident light matches a spectral absorption band of a material, light energy is absorbed, causing localised heating and the production of an oscillating thermal wave that propagates to the cooler surface of the sample. The perturbation is communicated to the gas surrounding the material by interfacial heat transfer and generates oscillating density and pressure gradients in the gas. In a sealed gas-microphone cell, the perturbation propagates as an acoustic wave which typically falls within the acoustic or ultrasonic range and is detected by an appropriately situated sound transducer. Detection of the PA signal is most commonly performed using an electret condenser microphone. Several other detection methods are also utilised, including cantilever deflection caused by the pressure wave, the deflection of a probe laser beam by the pressure and density gradients in proximity to the sample surface, the shift in peak resonance of a micro-ring resonator, or sample thickness modulation as detected by a Fabry–Perot interferometer.2–4 The intensity of the PA signal is a function of the absorption coefficient. Under appropriate conditions, the wavelength dependence of the PA intensity is equivalent to the absorption spectrum of the sample, closely resembling the spectrum derived from a conventional transmission measurement. Additionally, the modulation frequency of the incident light determines the depth response of the PA signal; variation of this frequency creates the possibility of depth profiling in layered and inhomogeneous materials.PAS at visible wavelengths (optical PAS) has seen major developments in recent years, with promising applications in the biomedical field. From the spectroscopy perspective, optical PAS delivers similar information content to that in conventional UV/visible absorption spectroscopy. Moreover, PAS can be implemented as an imaging technique, using either tomographic reconstruction methods (PhotoAcoustic Computed Tomography – PACT) or beam scanning methods (PhotoAcoustic Microscopy – PAM). Similar to standard optical microscopy, PAM spatial resolution can reach the diffraction limit, or several hundred nanometres in the optical region. In appropriate wavelength regions, particularly the visible or near-IR, and with suitable optical configurations, depth responses can reach an extension of the order of millimetres, thus providing an important advantage with respect to conventional visible microscopy techniques. One recent remarkable application in biological imaging has been the imaging of subcellular structures based on their absorption at visible wavelengths.5 Similarly, spatial resolution in mid-infrared imaging has been improved by combining the technique with probe beam deflection at visible wavelengths6 or with ultraviolet7 sample irradiation.
In contrast to the visible region, PAS in the mid-IR spectral range has been developed mostly as an analytical technique for bulk samples up to the present time. Mid-IR PA spectra convey information similar to that in more common types of mid-IR spectra; this includes access to structural information at the molecular level and the capability for molecular identification via fingerprinting and quantitation. The technique can be employed for the characterisation of all states of matter. With regard to solid materials, a wide range of sample forms is accessible, including grains, powders, optically and thermally thick samples, layered materials and coarse, irregular structures. Sample preparation is usually minimal. While PAS remains less common than several other IR spectroscopy methods (e.g., attenuated total reflectance, KBr pellet transmission, diffuse reflectance), the flexibility of PAS often makes it the technique of choice for the IR analysis of samples of technological interest.8 Mid-infrared PA spectra are most commonly acquired with the use of Fourier Transform Infrared (FT-IR) spectrometers, where the moving mirror in the interferometer provides the modulation necessary for generation of the PA signal. Mid-IR lasers provide an alternative means for the acquisition of PA spectra.
Despite the rich information content afforded by mid-IR PA spectroscopy, the technique has been applied primarily to macroscopic samples. However, a microsampling accessory has been commercially available for more than two decades; this device was successfully demonstrated in 1999.9 Measurements on microspecimens are enabled with a holder that locates the sample in a predefined position at the focal point of the infrared beam. While this approach permits spectromicroscopy measurements on small samples, it does not afford the capability to visualise and screen extended samples, to select multiple measurement positions, or to perform line or raster scanning of the sample. In other words, imaging is not readily achievable with this accessory.
To address these limitations, we have recently designed and constructed a PA cell that is easily coupled to commercial and custom-built microscopes for mid-IR microscopy and spectroscopy. This new cell enables PA spectroscopy on micrometric samples. In contrast to the previous method, the cell allows sample visualisation and creates the possibility to select measurement locations, including raster scanning, of the sample. This device can be used with a variety of light sources, including visible and mid-IR lasers, the standard incandescent near-infrared (NIR) and mid-IR (MIR) sources in benchtop spectrometers, as well as synchrotron radiation (SR). It was notably shown that the intensity of the PA signal provided by SR is much greater than that from thermal MIR and NIR sources, making it possible to obtain good quality spectra from a beam focused to a diffraction-limited spot. This development concatenates the features of PAS and IR microscopy and is referred to as microPhotoacoustic Spectroscopy (microPAS).10 In the present work we characterise the microPAS cell with respect to microscopy performance parameters, while using SR to operate at diffraction-limited spatial resolution.
Experimental
The microPAS cell (detailed design shown in ref. 10, Fig. 1) consists of a metal block with a central cavity that contains the sample. BaF2 windows enclose the cavity on both sides. A Brüel & Kjær Model 4955 microphone/preamplifier pair (sensitivity, 1100 mV Pa−1; inherent noise, 6.5 dB A; frequency range 10–16![[thin space (1/6-em)]](https://www.rsc.org/images/entities/char_2009.gif) 000 Hz) served as the detector. A Listen Sound Connect power supply provided the polarisation voltage to the microphone and functioned as a cascaded three-stage signal amplifier/attenuator.
000 Hz) served as the detector. A Listen Sound Connect power supply provided the polarisation voltage to the microphone and functioned as a cascaded three-stage signal amplifier/attenuator.
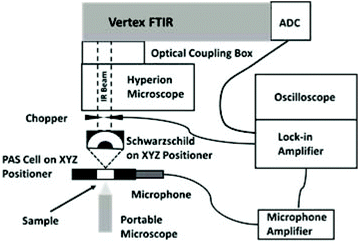 | ||
| Fig. 1 Experimental layout for microscope/FT-IR system, microscope side port top view. Adapted from Fig. 2c in ref. 10. | ||
The Bruker Vertex 80v FT-IR spectrometer at the MIRIAM beamline B22 of Diamond was utilised to acquire the microPAS spectra. Thermal sources (globar, 400–7000 cm−1; near-infrared, 1500–12![[thin space (1/6-em)]](https://www.rsc.org/images/entities/char_2009.gif) 000 cm−1) and SR were alternately employed for the measurements. The spectrometer was operated in continuous-scan mode, with modulation frequencies (specified with respect to the 15
000 cm−1) and SR were alternately employed for the measurements. The spectrometer was operated in continuous-scan mode, with modulation frequencies (specified with respect to the 15![[thin space (1/6-em)]](https://www.rsc.org/images/entities/char_2009.gif) 797 cm−1 HeNe laser used for FT sampling) ranging from 100 to 400 Hz. To keep data acquisition times manageable while maintaining signal/noise ratios at an acceptable level, spectrum resolution was limited to 16 cm−1. The PA spectra shown in this work were not corrected for system response through division by the spectrum of an optically opaque sample such as carbon black, as is commonly done in PA spectroscopy. In the experiments measuring the total PA intensity, the FT-IR scanner was stopped and a mechanical chopper provided the modulation necessary to generate the PA signal. This signal was demodulated using a Signal Recovery 7270 DSP lock-in amplifier. The measurement of total intensity allows spatial mapping of the sample based on integrated PA response, but with no spectral resolution.
797 cm−1 HeNe laser used for FT sampling) ranging from 100 to 400 Hz. To keep data acquisition times manageable while maintaining signal/noise ratios at an acceptable level, spectrum resolution was limited to 16 cm−1. The PA spectra shown in this work were not corrected for system response through division by the spectrum of an optically opaque sample such as carbon black, as is commonly done in PA spectroscopy. In the experiments measuring the total PA intensity, the FT-IR scanner was stopped and a mechanical chopper provided the modulation necessary to generate the PA signal. This signal was demodulated using a Signal Recovery 7270 DSP lock-in amplifier. The measurement of total intensity allows spatial mapping of the sample based on integrated PA response, but with no spectral resolution.
The horizontal collimated beam from the side output port of the spectrometer was focused by an infinity-corrected Agilent Schwarzschild objective (15× magnification, 0.65 numerical aperture) mounted on an XYZ micropositioner. The microPAS cell was mounted vertically on a second micropositioner and arranged to intercept the beam. The sample was visualised in transmission using a portable digital microscope situated behind the cell. The beam from the HeNe sampling laser in the spectrometer was coincident with the IR beam for all sources used in this work. This layout (Fig. 1) made it possible to locate specific sample positions at the focal point of the objective.
Samples were loaded in the microPAS cell in three different ways. Polystyrene (PS), acetyl polystyrene (AcPS) beads and polypropylene (PP) fibres were drop cast (from water suspension) on the lower BaF2 cell window. EM-Tec CT12 conductive double-sided adhesive carbon tabs were applied directly to the optical window. Hair fibres were enclosed individually in the cell and retained by compressing the extremes between the cell O-ring and the central ferrule.
Transmission FT-IR spectra of single beads were collected using the Hyperion microscope connected to the same Vertex 80v spectrometer described previously. Measurements were performed with SR by closing the output confocal aperture to 20 × 20 μm2 and positioning it on the centre of the selected bead. Mid-infrared spectra were acquired by averaging 256 scans at a resolution of 4 cm−1.
Results and discussion
MicroPAS with mid-infrared synchrotron radiation
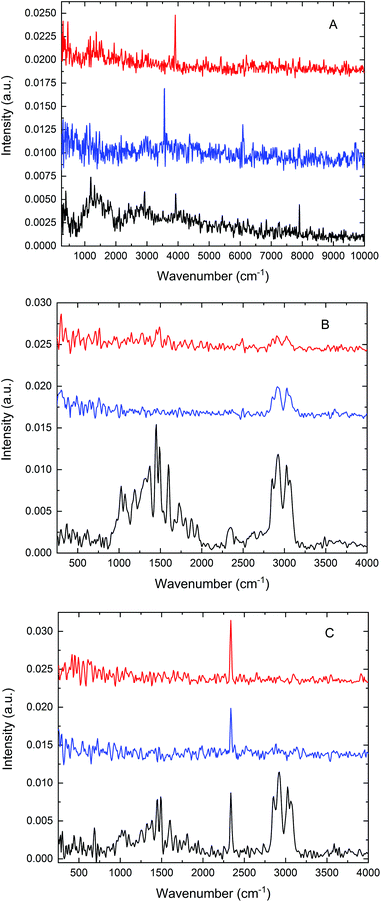
We previously recorded microPAS spectra of single layers of PS beads using a diffraction-limited IR beam spot.10 This experiment demonstrated the functionality of the cell and showed the substantial increase in PA intensity arising from the use of high brightness SR as compared with the conventional benchtop (MIR, NIR) light sources, despite the comparable power levels delivered by the three sources. However, the structure of the sample exposed to the beam was not defined in this experiment, i.e., it was unknown whether single or multiple beads were exposed to the beam or indeed if the same sample location was probed with each source. In the current work, this experiment was expanded by measuring microPAS spectra of an extended sample (a carbon tab), a layer of confluent beads (as in ref. 10), and a single bead using the three different light sources. Results of these tests are presented in Fig. 2. A scan rate of 200 Hz was used to acquire these spectra.
Fig. 2A shows the spectra obtained from the carbon tab sample in the 500–10![[thin space (1/6-em)]](https://www.rsc.org/images/entities/char_2009.gif) 000 cm−1 range. Spectra of this material are characterised by broad and weak features, possibly due to its physical structure (leading to strong directional thermal diffusivity), high opacity, and lack of chemical functionality. The entire spectrum is barely detectable above the background noise level with the MIR (top curve) and NIR (middle curve) sources; by contrast the SR source yielded an appreciable, albeit weak, PA spectrum. No intensity was observable below about 800 cm−1 because of the cutoff by the BaF2 optical windows. The movement of the scanning mirror in the interferometer produces modulation frequencies that increase linearly with wavenumber, a standard feature in FT-IR spectroscopy. Consequently the PA intensity, which varies approximately as 1/f, is intrinsically diminished at high wavenumbers as compared with low wavenumbers. Sampling depth is similarly reduced at high wavenumbers.8
000 cm−1 range. Spectra of this material are characterised by broad and weak features, possibly due to its physical structure (leading to strong directional thermal diffusivity), high opacity, and lack of chemical functionality. The entire spectrum is barely detectable above the background noise level with the MIR (top curve) and NIR (middle curve) sources; by contrast the SR source yielded an appreciable, albeit weak, PA spectrum. No intensity was observable below about 800 cm−1 because of the cutoff by the BaF2 optical windows. The movement of the scanning mirror in the interferometer produces modulation frequencies that increase linearly with wavenumber, a standard feature in FT-IR spectroscopy. Consequently the PA intensity, which varies approximately as 1/f, is intrinsically diminished at high wavenumbers as compared with low wavenumbers. Sampling depth is similarly reduced at high wavenumbers.8
Fig. 2B shows the spectra acquired for an unstructured cluster of PS beads, about 35–75 μm in size. While all three sources yielded PA spectra with clearly recognisable absorption bands, the benchtop sources gave much weaker spectra. As already reported in our previous work,10 a more intense PA spectrum, by almost an order of magnitude, can be acquired with the use of a focused SR beam. The absorption spectrum of PS contains two distinct groups of bands, one in the 1000–2000 cm−1 (fingerprint) region and another from about 2700 to 3200 cm−1 corresponding to carbon–hydrogen stretching. The region below about 1500 cm−1 does not exhibit any bands in the NIR source spectrum, as is expected, while only very weak bands are visible with the MIR source. In sharp contrast with these results, all of the known features of PS are visible in the spectrum obtained with SR (bottom curve).
A similar comparison of three spectra acquired for a single PS bead is shown in Fig. 2C. The same bead was examined in all three measurements. The bead was centred on the beam using the portable microscope unit described earlier. PA intensity was maximised by manual profiling along the focus axis (Z direction), enabling direct comparison of the intensities in the three spectra. In this experiment, like that depicted in Fig. 2B, SR demonstrated a distinct advantage compared with the thermal sources, yielding the only spectrum with well-defined bands. The sharp band near 2350 cm−1 in all three spectra is artefactual, and is not relevant to the current discussion.
From a broad perspective, the results presented in Fig. 2 confirm the viability of microPAS. Furthermore, they emphasise the distinct advantage provided by the use of synchrotron radiation, which is more pronounced when microsamples are examined. This advantage exists despite the comparable power levels at the sample (as measured by a thermopile) provided by the thermal sources and by SR10 because of the linear dependence of the PA signal on flux density.1 Light focused to a diffraction-limited spot provides higher flux density than light of comparable power focused to a larger spot. With regard to the spectra of a single bead (Fig. 2C), SR provided the only useful data. In optical FT-IR microspectroscopy, the principal advantage has been attributed to the brightness of the synchrotron emission, which makes it possible to focus all of the collected photons into a diffraction-limited light spot.11 In our microPAS experiments the SR advantage appears even more remarkable than in microspectroscopy with optical detection. In optical IR microscopy, the advantage afforded by the use of SR diminishes as sample sizes increase above 20 μm. Samples larger than 100 μm are easily analysed in spectromicroscopy experiments using a standard MIR source. In contrast, the examples in Fig. 2 show that samples larger than 5λ do not yield usable microPAS spectra with the MIR source, while they give clear spectra with the SR source. It can also be noted that optical IR microscopy measurements in transmission require sample thicknesses on the order of a few micrometres, depending on the spectral region of interest. Thicker samples display saturation effects or significant nonlinearity in the stronger absorption bands. For example, the polystyrene and acetyl polystyrene (AcPS) samples analysed in Fig. 3 are optically thick in the IR region, demonstrating this undesirable behaviour. In contrast, the microPAS spectra of PS beads in Fig. 2 do not exhibit any obvious saturation.
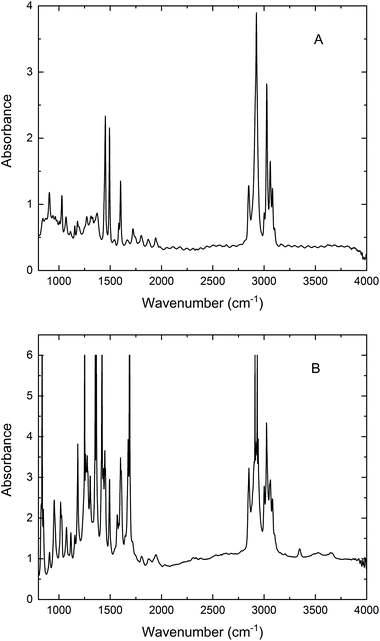 | ||
| Fig. 3 Micro FT-IR absorption spectra of (A) 53 μm PS; (B) 90 μm AcPS beads recorded in a transmission experiment with SR using a 20 × 20 μm2 confocal aperture. Resolution, 4 cm−1; 256 scans. | ||
Sample profiling, spatial resolution and sample scanning
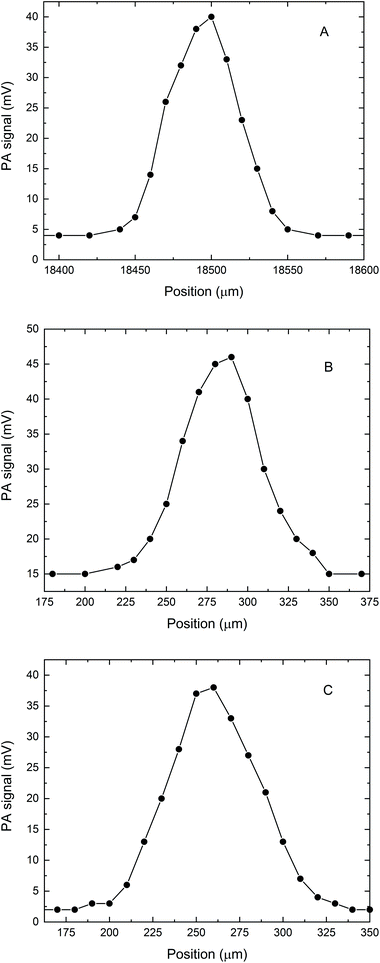
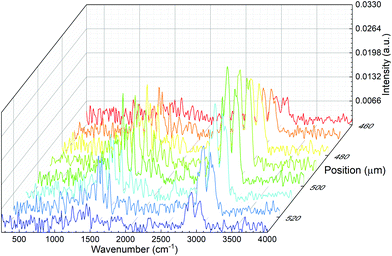
We also tested the capability of the microPAS cell for providing accurate profiles of microscopic samples by scanning the focused beam across the sample in the transverse direction. Tests were performed on a PS bead (diameter approximately 50–60 μm), a PP thread (∼80 μm) and hair fibres (approximately 80–100 μm). The profiles were measured by recording the lock-in amplifier voltage as a function of the spatial coordinate while the sample in the microPAS cell was illuminated with the focused SR beam. The FT-IR scanner (moving mirror) was kept stationary during these measurements, and the modulation was provided by a mechanical chopper operating at 17 Hz. The observed PA signal at each position was due to the sample absorption integrated over the entire mid-IR spectral range. The transversal profile recorded for a PS bead is shown in Fig. 4A. In the 10 μm (1000 cm−1) region, which is the longest absorbed wavelength within the spectrum (see Fig. 2) the calculated Airy disk diameter is 2.44λ/2 × NA = 18.8 μm, where NA, the numerical aperture, is 0.65. The shape of the observed transversal profile for the bead arises from the convolution of the bead shape with the intensity distribution of the beam; this leads to a predicted maximum width for the bead profile of 88–98 μm (the bead diameter plus two times the Airy disk diameter). This is similar to ∼100 μm, the experimental result. Similarly, the profiles for the PP thread and single hair fibre in Fig. 4B and C, total widths about 125–150 μm, are both consistent with values predicted from a convolution of the Airy disk dimension with the sample size. Detailed analysis of these spectrally integrated microPAS profiles is beyond the scope of this paper, since sample surface, as well as effects due to thermal wave propagation, could contribute to the shape of the profile.Spectral line scans were performed by recording microPAS spectra in the mid-IR region at a spectrometer scan rate of 100 Hz while scanning the sample at the focal point of the beam in the transverse direction. Fig. 5 shows the results of a line scan of a single PS bead. Spectra are plotted in the 400–4000 cm−1 region. These spectra were acquired over a span of 70 μm centred on the middle of the bead. The results show the viability of raster scanning with the microPAS cell. This creates the possibility of building spectral hypercubes and using them to construct PAS images, where contrast is generated by differential absorption of mid-IR light. The main limitation of this technique would be measurement time, currently about 19 min for each spectrum in Fig. 5. This will lead to experiment times of several hours for even a small 2D raster of points with the current microphone sensitivity, although we expect that use of more sensitive pressure transducers will allow significantly better performance.
Diffraction, scattering and reflection generally contribute to IR absorption spectra of particles recorded with optical detection, often producing band shapes that appear distorted relative to the ideal shapes produced by a pure absorption process.12,13 The role of Mie scattering in this context has recently been discussed in detail.14 The distortion of band shapes is often attributed to a contribution from the real part of the refractive index of the sample. In some cases, the distortion is so severe as to affect or even prevent a realistic interpretation of the spectroscopic data. The samples investigated in our experiments ranged from about 50 to 100 μm in size, much larger than the wavelength of the incident radiation. In this range, the samples are outside of the Mie and Rayleigh scattering regimes and any contributions from the real refractive index are expected to arise primarily from reflection or refraction of the beam at the sample-air interface. Careful inspection of the microPAS spectra acquired for the samples studied in this work, both beads and fibres, does not reveal any obvious band distortions due to these effects. This observation agrees with the early reports that PAS measurements on pelleted samples are free from dispersion artefacts15 and with the recent application to the study of PC3 cells.16 Any band distortions in PA spectra are also expected to have a different appearance than those observed in transmission or reflection measurements, where reflection losses appear as “derivative shaped” contributions to the absorption profile, in some cases leading to negative absorbance values.17 In contrast, PAS measures only the amount of energy absorbed by the sample; light losses due to reflection or scattering may give rise to a decreased PA signal, but not to a negative intensity value in a PA spectrum. However, spectra measured near bead edges are difficult to assess in this respect due to their modest signal-to-noise ratios. To summarise, it is still possible that minor band distortions from optical effects will contribute to the spectra but go undetected in the current experiments. Future experiments will address this issue more fully.
Studies of hair
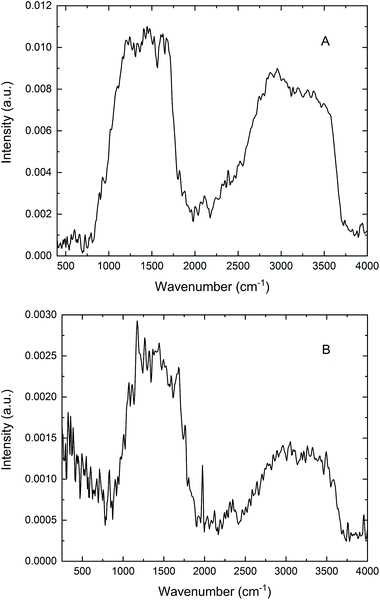
As mentioned in the Introduction, PAS frequently finds application in the study of “difficult” samples. Human hair certainly qualifies as a non-ideal material for infrared analysis in this context; dispersion of individual hairs in an alkali halide powder, while preparing for transmission or diffuse reflectance measurements, can be quite problematic. By contrast, the acquisition of PA infrared spectra of neat hair samples turns out to be relatively straightforward: examples include the early work of Jiang,9 spectra recorded using a standard gas-microphone cell,8 and cantilever-based PA investigations.18,19 These successful studies prompted microPAS experiments for hair accompanying the line scan depicted in Fig. 4C.Fig. 6 presents two typical spectra of a single hair fibre acquired with the microPAS cell. These spectra were recorded at a resolution of 16 cm−1 using SR as the source. While this low resolution somewhat broadens the amide bands between about 1500 and 1700 cm−1, as well as the carbon–hydrogen and nitrogen–hydrogen bands near 3000 cm−1, these spectra still lack the expected detail. Previous experience suggests that the low modulation frequencies (100 Hz and 400 Hz in Fig. 6A and B, respectively) might lead to partial saturation, where some of the information regarding an absorption profile is obscured. This proposal is evaluated through the following simple calculation.
The sampling depth in a microPAS experiment is approximately equal to the thermal diffusion length μs, given by μs = (α/πf)1/2, where α, the thermal diffusivity, is about 0.001 cm2 s−1 for hair and f is the modulation frequency at the wavenumber in question. A rough calculation leads to a μs value of about 17 μm at 100 Hz. For the mid-infrared region from 800 to 4000 cm−1 (above the BaF2 cutoff), modulation frequencies range from about 5 to 25 Hz in Fig. 6A and from 20 to 100 Hz in Fig. 6B. Hence μs varies from ∼80 to 35 μm above 800 cm−1 as wavenumber increases from left to right in Fig. 6A, and from ∼40 to 17 μm in Fig. 6B. In other words, at lower wavenumbers, and particularly at the lower scan frequency, the sampling depths in these tests are less than, or similar to, the physical dimension (diameter) of the hair fibre. In this circumstance, the sample is said to be optically opaque (no light is transmitted) and thermally thick. The PA signal is fully saturated when μs is greater than the absorption length; on the other hand, the PA response more closely approximates an ordinary absorption spectrum when μs is less than this distance.1 Thus, it is reasonable to conclude that in the spectra in Fig. 6 the absorption is actually partially saturated. The microPAS spectra differ qualitatively from published bulk spectra of hair,8,9,18,19 which were acquired at significantly higher modulation frequencies, and exhibit much more detail. The spectrum of a single hair fibre, obtained using photothermal microspectroscopy at a frequency of 2.2 kHz,20 also shows saturation effects, while exhibiting more structure than the microPAS spectra. The reason for the discrepancy in saturation levels between techniques that both rely on the photothermal effect will be the subject of future investigation. ATR spectra of hair recorded in our laboratory are very similar to these published spectra.
Two general aspects of the microPAS spectra of hair also deserve comment. First, it can be noted that the 100 Hz spectrum in Fig. 6A is about four times as intense as the 400 Hz spectrum in Fig. 6B. This factor is consistent with the known ∼1/f dependence of PA intensity mentioned earlier. Secondly, the intensity of the broad band extending from about 2500 to 3700 cm−1 is diminished with regard to the ∼1000–2000 cm−1 band in the 400 Hz spectrum, reflecting the wavenumber dependence of f that was also discussed previously. This effect is less noticeable in the 100 Hz spectrum, where the depth of penetration is greater and saturation plays a greater role.
Conclusions
A custom-built microPAS cell was utilised to acquire spectra of PS beads, PP fibres, and human hair in this investigation. FT-IR PA spectra obtained with mid- and near-infrared thermal sources were compared with those recorded with SR. While the thermal sources mostly yielded spectra that were barely adequate, SR produced spectra of better quality for single PS beads, a layer of beads, and single PP fibres. Spectral line scans for PS beads showed the viability of raster scanning with the microPAS cell.MicroPAS spectra of a single hair fibre obtained using SR exhibited very broad bands as compared with those in published spectra of bulk hair samples. Calculation of the thermal diffusion lengths in the microPAS experiments confirmed that bands in these spectra are likely affected by saturation, a consequence of the low modulation frequencies employed in these tests.
Finally, it should be noted that spectra acquired on the edges of curved samples (i.e., beads and fibres) are at least qualitatively similar to those obtained when the incident radiation impinges on the middle of the sample. No artefacts due to contributions from the real part of the refractive index (refraction, diffraction, or scattering) were observed in this work. The capability to provide purely absorptive IR spectra is a powerful advantage for the characterisation of particulate samples, such as sands, powders and all samples with a generally coarse or irregular topography on the micrometric scale. These samples are generally difficult to study by all-optical configurations of IR microscopy, yielding heavily distorted spectra that are difficult to analyse and cannot be used in database search. This category includes many samples of industrial and technological interest, and also samples used in the biomedical/bioanalytical field, art conservation, archaeology, and environmental science. MicroPAS bears promise to become a tool enabling characterisation of all such samples by IR spectroscopy and at the single particle level.
Conflicts of interest
There are no conflicts to declare.Acknowledgements
We thank Tim May and Tor Pedersen (Canadian Light Source Inc., Saskatoon, Saskatchewan) for many helpful discussions. This work was carried out with the support of the Diamond Light Source (proposal SM17743-1) and of the Canadian Light Source. The Canadian Light Source is supported by the Canada Foundation for Innovation, Natural Sciences and Engineering Research Council of Canada, the University of Saskatchewan, the Government of Saskatchewan, the National Research Council Canada, Western Economic Diversification Canada, and the Canadian Institutes of Health Research. This project has received funding by the European Union's Horizon 2020 research and innovation programme under the Marie Skłodowska-Curie grant agreement No. 665778 (POLONEZ 2 fellowship to Luca Quaroni, managed by the National Science Center Poland under contract UMO-2016/21/P/ST4/01321).References
- A. Rosencwaig, Photoacoustics and Photoacoustic Spectroscopy, Wiley-Interscience, New York, 1980 Search PubMed.
- S.-L. Chen, L. J. Guo and X. Wang, Photoacoustics, 2015, 3, 143 CrossRef PubMed.
- S. M. Maswadi, B. L. Ibey, C. C. Roth, D. A. Tsyboulski, H. T. Beier, R. D. Glickman and A. A. Oraevsky, Photoacoustics, 2016, 4, 91 CrossRef PubMed.
- K. Chen, Q. Yu, Z. Gong, M. Guo and C. Qu, Sens. Actuators, B, 2018, 268, 205 CrossRef CAS.
- Z. Tan, Z. Tang, Y. Wu, Y. Liao, W. Dong and L. Guo, Opt. Express, 2011, 19, 2426 CrossRef CAS PubMed.
- D. Zhang, C. Li, C. Zhang, M. N. Slipchenko, G. Eakins and J.-X. Cheng, Sci. Adv., 2016, 2, e1600521 CrossRef PubMed.
- J. Shi, T. T. W. Wong, Y. He, L. Li, R. Zhang, C. S. Yung, J. Hwang, K. Maslov and L. V. Wang, Nat. Photonics, 2019, 13, 609 CrossRef CAS PubMed.
- K. H. Michaelian, Photoacoustic IR Spectroscopy. Instrumentation, Applications and Data Analysis, Wiley-VCH, Weinheim, 2nd edn, 2010 Search PubMed.
- E. Y. Jiang, Appl. Spectrosc., 1999, 53, 583 CrossRef CAS.
- K. H. Michaelian, M. D. Frogley, C. S. Kelley, T. Pedersen, T. E. May, L. Quaroni and G. Cinque, Infrared Phys. Technol., 2018, 92, 240 CrossRef.
- E. Levenson, P. Lerch and M. C. Martin, Infrared Phys. Technol., 2008, 51, 413 CrossRef.
- M. Miljković, B. Bird and M. Diem, Analyst, 2012, 137, 3954 RSC.
- B. Mohlenhoff, M. Romeo, M. Diem and B. R. Wood, Biophys. J., 2005, 88, 3635 CrossRef CAS PubMed.
- A. J. Schofield, R. Blümel, A. Kohler, R. Lukacs and C. J. Hirschmugl, J. Chem. Phys., 2019, 150, 154124 CrossRef PubMed.
- G. Laufer, J. T. Huneke, B. S. H. Royce and Y. C. Teng, Appl. Phys. Lett., 1980, 37, 517 CrossRef CAS.
- T. J. Harvey, A. Henderson, E. Gazi, N. W. Clarke, M. Brown, E. Correia Faria, R. D. Snook and P. Gardner, Analyst, 2007, 132, 292 RSC.
- P. Grosse, Vib. Spectrosc., 1990, 1, 187 CrossRef CAS.
- J. K. Lehtinen and T. A. Kuusela, AMA Conference Proceedings IRS2, 2013, p. 130 Search PubMed.
- J. K. Lehtinen, Int. J. Thermophys., 2013, 34, 1559 CrossRef CAS.
- A. Hammiche, L. Bozec, M. J. German, J. M. Chalmers, N. J. Everall, G. Poulter, M. Reading, D. B. Grandy, F. L. Martin and H. M. Pollock, Spectroscopy, 2004, 19, 20 Search PubMed.
| This journal is © The Royal Society of Chemistry 2020 |

