In situ growth of Au nanoparticles on natural melanin as biocompatible and multifunctional nanoagent for efficient tumor theranostics†
Zhaojie
Wang
a,
Nuo
Yu
a,
Wanjian
Yu
a,
Hao
Xu
a,
Xuan
Li
a,
Maoquan
Li
b,
Chen
Peng
*c,
Qian
Wang
*d,
Meifang
Zhu
a and
Zhigang
Chen
 *a
*a
aState Key Laboratory for Modification of Chemical Fibers and Polymer Materials, College of Materials Science and Engineering, Donghua University, Shanghai 201620, China. E-mail: zgchen@dhu.edu.cn
bDepartment of Interventional and Vascular Surgery, Affiliated Shanghai Tenth People's Hospital, Tongji University, Shanghai 200072, China
cCancer Center, Shanghai Tenth People's Hospital, Tongji University School of Medicine, Shanghai 200072, China. E-mail: cpengrr@tongji.edu.cn
dDepartment of Orthopaedics, Third Affiliated Hospital of Second Military Medical University, Shanghai, 200438, China. E-mail: Drwangqian23@163.com
First published on 20th November 2018
Abstract
Natural melanin has been demonstrated to be a biocompatible and efficient nanoagent for the photothermal ablation of tumors, but their practical applications are limited due to their lack of typical imaging functions (CT, MRI, etc.). Thus, to achieve multifunctional melanin-based nanoagents for imaging-guided therapy, for the first time, herein, we report the in situ growth of Au nanoparticles on natural melanin as a model through a simple and safe method. The as-synthesized samples are composed of melanin nanoparticles (diameter: ∼120 nm) whose surface are decorated by small Au nanoparticles with an adjustable size ranging from ∼10 to ∼40 nm. These Au-decorated melanin (Au–M) nanocomposites exhibit satisfactory near infrared (NIR) photoabsorption and high photothermal conversion efficiency of 42.3%. Furthermore, the Au–M nanocomposites have a high X-ray attenuation coefficient and exhibit excellent biocompatibility. When the Au–M solutions were injected into the tumor of a mouse, the tumor could be detected by X-ray computed tomography (CT), photoacoustic (PA) and thermal imaging, and then be thermally ablated under the illumination of an 808 nm laser. Therefore, these Au–M nanocomposites have great potential as a novel multifunctional and biocompatible nanoagent for imaging-guided photothermal tumor ablation.
1. Introduction
Cancer is a fatal disease that poses serious a threat to the survival and health of humans.1 The primary treatment methods for cancer include surgery, chemotherapy and radiation therapy; however, they suffer from some disadvantages such as serious side effects, recidivation and metastasis. To solve these issues, near-infrared (NIR) laser-induced photothermal therapy (PTT) has emerged as a new form of treatment.2 An NIR laser can effectively penetrate tissue to irradiate photothermal agents, which convert light into hyperthermia to ablate cancer cells.2 Currently, photothermal agents have been well developed, which can be mainly divided into two types according to their synthetic method. The first is synthetic nanomaterials, including carbon (carbon nanotubes3 and graphene4), semiconductor (CuS5,6 and WO3−x7), noble-metal (Au8,9 and Pd10) and organic (polyaniline11 and polypyrrole12) nanoparticles. Our group chemically synthesized several types of semiconductor-based (CuS13–15 and W18O4916) photothermal nanoagents. All these man-made nanomaterials exhibit strong NIR photoabsorption and photothermal effect for efficient PTT of tumors, but they have relatively unsatisfactory biocompatibility. The other type is natural materials, including chlorophyll,17 anthocyanins,18 and melanin.19–21 These natural materials exhibit high biocompatibility compared with synthetic nanomaterials. Among the natural materials, natural melanin has attracted much attention due to its ideal biocompatibility and high photothermal effect. Currently, melanin nanoparticles are extracted from black sesame,19 cuttlefish20 and hair.21 When natural melanin nanoparticles were injected to tumor, the tumor could be thermally ablated when exposed to an NIR laser.19–21 Thus, natural melanin nanoparticles can be used as efficient and biocompatible photothermal nanoagents for NIR-PTT of tumors.To treat cancers with decreased drug doses and side effects, it will be ideal for nanoagents to have all the required diagnosis and therapy functions for tumors. Such multifunctional nanoagents have been well developed for computed tomography (CT) and magnetic resonance (MR) imaging-guided photothermal therapy, including MnSe@Bi2Se3,22 WS2@Fe3O4,23 and MnO2/Cu2−xS24 nanocomposites. Our group also prepared several multifunctional nanoagents, such as Fe3O4@Cu2−xS,25 FeS2,26 Sb-doped SnO2,27 and Bi28 nanoparticles. Although these multifunctional nanoagents exhibit excellent imaging and photothermal therapy functions for tumors, their biocompatibilities are still a major concern and should be further improved for practical applications. The above-mentioned natural melanin nanoparticles have good biocompatibility and NIR photothermal effect, but they lack the required CT/MRI imaging function. Thus, it will be ideal if melanin nanoparticles can be modified to have the required imaging and photothermal therapy functions for tumors.
It is well known that Au with an atomic number of 79 has been applied as a CT imaging contrast agent due to its excellent X-ray attenuation coefficient, and Au nanoparticles-based medicines have been approved for clinical applications due to their high biocompatibility. The combination of Au nanoparticles with photothermal materials have been realized for the construction of multifunctional nanoagents, such as Cu7S4-Au29 and MnO@Au30 nanocomposites. These features inspired us to develop Au–melanin multifunctional nanocomposites. In the present work, the in situ growth of Au nanoparticles on melanin was realized by simply mixing HAuCl4 and melanin solution at room temperature (∼25 °C) for 14 h. These Au-decorated melanin (abbreviated Au–M) nanocomposites exhibited good NIR photoabsorption and satisfactory photothermal conversion efficiency. Importantly, the Au–M nanocomposites exhibited a high X-ray attenuation coefficient and biocompatibility. With the injection of Au–M nanocomposites, the tumors of mice could be well observed by CT, PA and thermal imaging. Furthermore, the tumor could be thermally ablated without toxicity and side effects under 808 nm laser illumination.
2. Experimental
2.1 In situ growth of Au on melanin nanoparticles
Fresh melanin nanoparticles were obtained from the ink of sacrificed cuttlefish, and washed with water and ethanol four times. Then, a portion of the collected product was vacuum dried for the following characterization, while the other portion was re-dispersed in deionized water to obtain a uniform aqueous dispersion. Subsequently, 1.0, 5.0, and 10.0 μmol HAuCl4 were each added to melanin dispersions (5 mL, 1.0 mg mL−1), and the resulting solutions were magnetically stirred at room temperature (∼25 °C). After 14 h of stirring, the above dispersions were centrifuged and washed with water three times to obtain the Au–M nanocomposites.2.2 Characterization and measurement
To evaluate the photothermal performance of the Au–M nanocomposites, various concentrations (0–0.4 mg mL−1) of Au–M aqueous dispersions (100 μL) in plastic tubes were illuminated by an 808 nm laser device. The temperature of the Au–M dispersions was recorded using an FLIR Automation & Science Camera.Au–M and iobitridol aqueous solutions with different concentrations (Au and I: 2.5–40 mM) were prepared and put in plastic tubes, and then fixed on a scanning table. CT scans were performed, and the X-ray attenuation intensity was evaluated by the related instrument. Contrast enhancement was evaluated in Hounsfield units (HU) for each concentration of Au–M nanocomposite or iobitridol. The characterization, cell and animal experiments are exhibited in the ESI.†
3. Results and discussion
3.1 Synthesis of Au–M nanocomposites
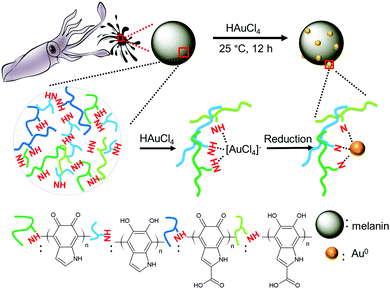
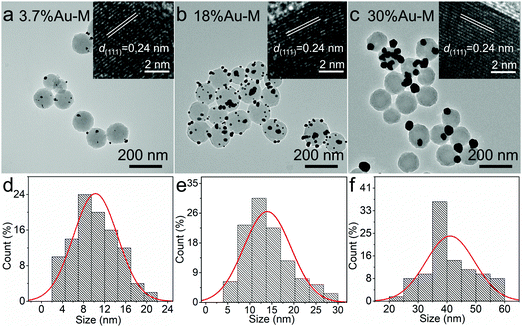
The natural melanin sample was extracted from the ink sac of sacrificed cuttlefish, which consisted of high-purity nanospheres with an average diameter of ∼120 nm (Fig. S1 in the ESI†). To grow Au nanoparticles on natural melanin, HAuCl4 solutions with different concentrations were introduced to the melanin solution under continuous stirring at room temperature (∼25 °C) for 14 h (Fig. 1). It is well-known that natural melanin is a complex bio-polymer consisting of a series of active chemical units such as 5,6-dihydroxyindole, 5,6-dihydroxyindole-2-carboxylic acid and their corresponding o-quinones.31,32 The amine groups (–NH–) of these units have excellent coordination and average reduction abilities. When the HAuCl4 solution was added to the melanin solution, the amine groups (–NH–) could absorb and coordinate AuCl4− ions. Under continuous stirring, the AuCl4− ions were slowly reduced by the amine groups (–NH–), resulting in the formation of metallic Au0. Subsequently, the resulting Au0 underwent a nucleation and in situ growth process to form small Au nanoparticles, which is similar to that in previous reports.33,34 During the reduction reaction, the in situ generated Au nanoparticles continuously coordinated with the imine groups (–N–) in melanin, leading to the in situ growth of Au nanoparticles on melanin. When the Au/melanin weight ratio in the precursor solution was 4%, 20%, or 40%, the weight ratio of Au to melanin in the final nanocomposites was determined to be 3.7 wt%, 18.0 wt%, and 30.0 wt%, respectively, by inductively coupled plasma atomic emission spectroscopy (ICP-AES). The slight decrease in Au content in the final sample can be attributed to the incomplete reduction of AuCl4− ions to metallic Au0. These three samples were abbreviated 3.7%Au–M, 18%Au–M and 30%Au–M, respectively.The morphology and size of the Au–M samples were investigated via transmission electron microscopy (TEM). When 1.0 μmol of HAuCl4 was introduced to the melanin dispersion, the as-obtained 3.7%Au–M sample was composed of spherical melanin nanoparticles whose surface was decorated with a few small nanoparticles with an average size of ∼10 nm (Fig. 2a and d). The high-resolution TEM (inset in Fig. 2a) image exhibits that the small nanoparticle has a spacing of 0.24 nm, which corresponds with the (111) plane spacing of metallic Au (JCPDS Card No. 04-0784). With an increase in the HAuCl4 concentration to 5.0 μmol, the resulting 18%Au–M sample was composed of melanin nanoparticles decorated with small Au nanoparticle with a size of ∼13 nm (Fig. 2b and e), and the number of Au nanoparticles on each melanin nanoparticle increased significantly in comparison to that of the 3.7%Au–M sample. Furthermore, by increasing the HAuCl4 concentration to 10.0 μmol, the 30%Au–M sample consisted of melanin nanoparticles decorated by Au nanoparticles with the obviously bigger size of ∼40 nm (Fig. 2c and f), and there were no Au nanoparticles on the surface of some of the melanin nanoparticles. These results confirm the in situ growth of Au nanoparticles on the melanin nanoparticles without side effects on melanin, and the resulting 18%Au–M sample has a high number of small Au nanoparticles with uniform decoration on each large melanin nanoparticle.
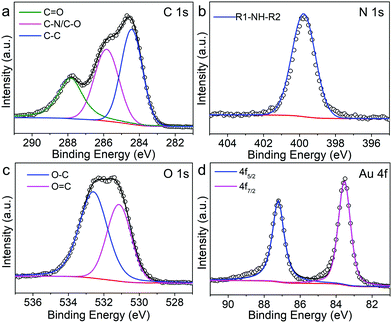
Using the 18%Au–M sample as a model, we further investigated its phase, elemental distribution and chemical status via powder X-ray diffractometry (XRD), energy dispersive spectroscopy (EDS) and X-ray photoelectron spectroscopy (XPS). Its XRD pattern (Fig. 3a) exhibits five diffraction peaks at 38.2°, 44.4°, 64.6°, 77.5° and 81.7°, which correspond to the (111), (200), (220), (311) and (222) planes of metallic Au, respectively (JCPDS No. 04-0784). Its EDS pattern demonstrates that beside the Cu signal from the copper grid, the C, N, O and Au elements are present in the 18%Au–M sample (Fig. S2, ESI†). In addition, the HADDF-STEM image in Fig. 3b confirms that some large spherical nanoparticles are decorated with many small nanoparticles. The elemental mapping images (Fig. 3c–e) indicate that C, N and O elements are homogeneously distributed among large spherical nanoparticles, respectively, suggesting that the large spherical nanoparticles are melanin. The Au signals are located on these small nanoparticles (Fig. 3f), suggesting that the small nanoparticles should be Au. Furthermore, the survey XPS spectrum (Fig. S3, ESI†) exhibits four prominent peaks centered at 285.2, 399.9, 532.0 and 84.0 eV, which correspond to the C (C 1s), N (N 1s), O (O 1s) and Au (Au 4f) elements, respectively. The high-resolution C 1s spectrum (Fig. 4a) could be fitted into three peaks, which can be assigned to the C![[double bond, length as m-dash]](https://www.rsc.org/images/entities/char_e001.gif) O (287.8 eV), C–N/C–O (285.8 eV) and C–C (284.4 eV) species from natural melanin, respectively.35 The high-resolution N 1s spectrum (Fig. 4b) has a strong peak centered at 399.8 eV, which can be attributed to the existence of R1-NH-R2 groups in natural melanin.35 In the O 1s spectrum (Fig. 4c), there is a wide peak, which could be split into two peaks at 532.6 and 531.2 eV due to the O−C and O
O (287.8 eV), C–N/C–O (285.8 eV) and C–C (284.4 eV) species from natural melanin, respectively.35 The high-resolution N 1s spectrum (Fig. 4b) has a strong peak centered at 399.8 eV, which can be attributed to the existence of R1-NH-R2 groups in natural melanin.35 In the O 1s spectrum (Fig. 4c), there is a wide peak, which could be split into two peaks at 532.6 and 531.2 eV due to the O−C and O![[double bond, length as m-dash]](https://www.rsc.org/images/entities/char_e001.gif) C species from natural melanin, respectively.35,36 The Au 4f spectrum (Fig. 4d) shows two divided peaks positioned at 83.5 eV (Au 4f7/2) and 87.2 eV (Au 4f5/2) without any additional peak, confirming the high purity of metallic Au.37 Therefore, these results further confirm the successful in situ growth of metallic Au nanoparticles on the melanin nanoparticles.
C species from natural melanin, respectively.35,36 The Au 4f spectrum (Fig. 4d) shows two divided peaks positioned at 83.5 eV (Au 4f7/2) and 87.2 eV (Au 4f5/2) without any additional peak, confirming the high purity of metallic Au.37 Therefore, these results further confirm the successful in situ growth of metallic Au nanoparticles on the melanin nanoparticles.
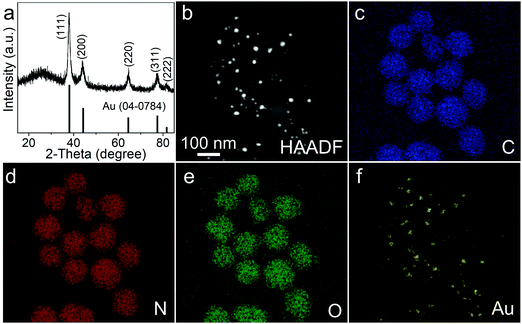 | ||
| Fig. 3 XRD pattern (a), HADDF-STEM image (b) and elemental mappings (c–f) of the 18%Au–M nanocomposite. | ||
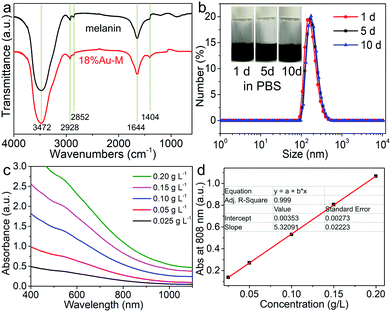
Surface functional groups of nano-biomaterials are crucial for their hydrophilicity and dispersibility in water and various bio-fluids. Thus, the chemical groups of melanin and the 18%Au–M sample were determined via FTIR spectroscopy. Obviously, both samples exhibit very similar FTIR spectra (Fig. 5a). A strong and broad FT-IR transmission band at about 3470 cm−1 can be observed due to the –OH of adsorbed water and carboxyl/phenolic in melanin.38,39 The transmission bands at 2928 and 2852 cm−1 can be assigned to the asymmetric (γas) and symmetric (γs) stretching vibrations of the aliphatic CH units, respectively.40 The band at 1644 cm−1 is related to the C![[double bond, length as m-dash]](https://www.rsc.org/images/entities/char_e001.gif) O stretches from the aromatic ring and/or carboxyl.39,41 Besides, the band at 1404 cm−1 is the phenolic –OH bends and indolic/phenolic NH stretches.38 These results suggest that both melanin and the 18%Au–M sample have –OH, –NH and –COOH groups and the growth of Au has no obvious effect on the chemical groups of melanin.
O stretches from the aromatic ring and/or carboxyl.39,41 Besides, the band at 1404 cm−1 is the phenolic –OH bends and indolic/phenolic NH stretches.38 These results suggest that both melanin and the 18%Au–M sample have –OH, –NH and –COOH groups and the growth of Au has no obvious effect on the chemical groups of melanin.
Owing to the existence of hydrophilic groups (such as –NH– and –COOH) from natural melanin, both natural melanin and the 18%Au–M nanocomposite could be well dispersed in water and various bio-fluids including PBS (phosphate buffer saline), FBS (fetal bovine serum), and DMEM (Dulbecco's modified Eagle medium) (inset in Fig. 5b and Fig. S4, ESI†). Different dispersions containing the 18%Au–M sample exhibited a homogeneous dark brown color. After storage for even 5–10 days, the 18%Au–M dispersions showed negligible changes in their appearance (inset in Fig. 5b and Fig. S4, ESI†) and photoabsorption (Fig. S5, ESI†), and no obvious precipitation was observed. To further investigate the diameter change in the samples, the hydrodynamic size distribution of the 18%Au–M solution was recorded via the dynamic light scattering (DLS) method. The DLS results reveal that 18%Au–M in PBS had the hydrodynamic size of 150–170 nm during storage for 1–10 days (Fig. 5b). Subsequently, the optical properties of the aqueous dispersion containing melanin (0.1 g L−1) and 18%Au–M (0.025–0.2 g L−1) were measured via UV-Vis-NIR spectroscopy (Fig. S6, ESI† and Fig. 5c). Obviously, both melanin and 18%Au–M dispersions with the same concentration (0.1 g L−1) exhibited similar absorption spectra, and they had wide and gradually decreased photoabsorption from the UV to NIR region (Fig. S6, ESI†). A Higher concentration of 18%Au–M enhanced the photoabsorption intensity in the entire UV-Vis-NIR region (Fig. 5c). For example, with an increase in concentration (0.025–0.2 g L−1), the absorbance intensity at 808 nm increased linearly from 0.13 to 1.07 (Fig. 5d). Also, the extinction coefficient of 18%Au–M at 808 nm was determined to be 5.32 × 103 cm2 g−1. Thus, the 18%Au–M nanocomposite has excellent aqueous dispersibility, high colloidal stability and strong NIR photoabsorption.
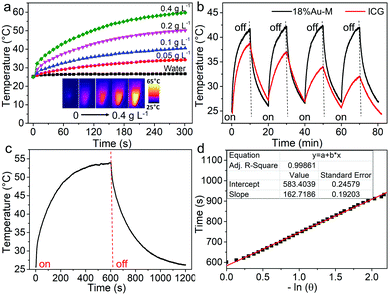
Next, an 808 nm NIR laser was used as the NIR optical source to study the photothermal performances of the 18.3%Au–M nanocomposite. The temperatures of dispersions with various concentrations of 18%Au–M (0.05–0.4 g L−1) were recorded using an IR camera (Fig. 6a). The temperature of water was also measured as a comparison. The water exhibited a low temperature elevation from 25.0 °C to 26.8 °C at 300 s. Importantly, with the illumination of the laser (1.0 W cm−2), the 18%Au–M dispersions exhibited a rapid temperature elevation from 0 to 120 s, which subsequently slowly increased up to 300 s. The temperature elevation (ΔT) at 300 s for the different concentrations was calculated and shown in Fig. S7 (ESI†). With an increase in the 18%Au–M concentration from 0.05 to 0.4 g L−1, ΔT increased almost linearly from 9.2 °C to 36.7 °C, demonstrating an obvious concentration-dependent heating effect. Subsequently, by comparing the 18%Au–M nanocomposites with indocyanine green (ICG), its photothermal stability was evaluated with the illumination of an 808 nm laser (1.0 W cm−2). The equilibrium temperature of the ICG solution decreased rapidly from 38.9 °C for the first cycle to 31.8 °C for the fourth cycle, indicating the obvious photobleaching of ICG by the laser. On the contrary, the temperature of the 18%Au–M dispersion showed no obvious temperature change, reaching the maximum temperature of 41.5 °C during four laser on/off cycles (Fig. 6b). Furthermore, after the cycle illumination tests, the used 18%Au–M sample exhibited a similar morphology and size (Fig. S8, ESI†) with that (Fig. 2b) of the initial 18%Au–M sample, and no obvious changes in the Au nanoparticles were observed. These facts confirm that the 18%Au–M nanocomposite can be used as an effective and stable photothermal nanoagent.
To further measure the photothermal conversion efficiency, the 18%Au–M aqueous dispersion (0.1 mL) was irradiated by an 808 nm laser for 600 s, and then the laser was switched off. During the irradiation and no irradiation process, the real-time temperature of the dispersion was measured using an IR camera (Fig. 6c). The temperature increased rapidly from 25.5 °C at 0 s to 53.9 °C (the highest and balanceable temperature) at 600 s of irradiation, and decreased sharply to 25.5 °C at 1200 s (laser off). The photothermal conversion efficiency was calculated according to Roper's report42 with some modifications as follows:
 | (1) |
 | (2) |
3.2 Cytotoxicity and PTT in vitro
The natural melanin nanoparticles should have high biocompatibility since they are completely biosynthetic materials obtained from the cuttlefish. In addition, the cytotoxicity of different types of Au nanomaterials has been investigated,9,29,30 and all of them exhibited low toxicity for biomedical application. Herein, the cytotoxicity of melanin and 18%Au–M was evaluated using the standard cell counting kit-8 (CCK-8) assay with 4T1 cells and HUVEC cells in vitro (Fig. 7a and Fig. S10, ESI,† respectively). When the 4T1 cells and HUVEC cells were incubated with the natural melanin nanoparticles for 24 h, the cell viability remained high (>80%) in studied the concentration range (0–1.0 g L−1) without no obvious change (Fig. 7a and Fig. S10, ESI,† respectively). Similarly, for the 4T1 cells and HUVEC cells incubated with 18%Au–M nanocomposite with different concentrations (0–1.0 g L−1), the cell viabilities were still very high and there were no obvious differences in cell proliferation. The above results confirm the high biocompatibility of both natural melanin and 18%Au–M nanocomposites, suggesting that Au decoration has no adverse effects on the biocompatibility of natural melanin.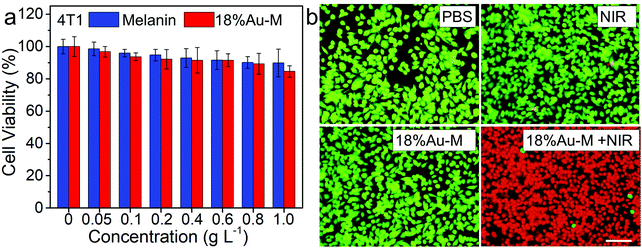 | ||
| Fig. 7 (a) Cytotoxicity evaluation of the 18%Au–M nanocomposite and pure melanin. (b) Fluorescence images of cells stained by calcein-AM and PI. Scale bar: 50 μm. | ||
Due to the strong photothermal effect and high biocompatibility of the 18%Au–M nanocomposite, it can be developed as an excellent photothermal nanoagent to thermally ablate cancer cells. The in vitro photothermal ablation was evaluated via the incubation of 4T1 cells with the 18%Au–M nanocomposite (0.4 g L−1) and then the irradiation with an 808 nm laser (1.0 W cm−2) for 10 min. Afterwards, the 4T1 cells were co-stained with calcein-AM (live cells, green fluorescence) and propidium iodide (PI, dead cells, red fluorescence) to demonstrate the therapeutic effect of 18%Au–M (Fig. 7b). Obviously, the cells in the PBS, NIR laser-treated and 18%Au–M-treated groups presented nearly full green color, implying no obvious therapeutic effect. In contrast, 18%Au–M in combination with NIR laser irradiation efficiently killed the cancer cells, as evidenced by the red color. Therefore, the 18%Au–M nanocomposite can thermally destroy cancer cells in vitro with the illumination of an NIR laser.
3.3 Multimodal imaging and photothermal therapy in vivo
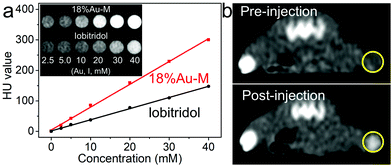
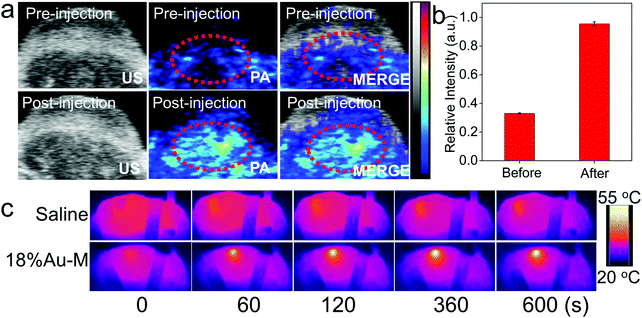
Bio-imaging technologies are of great importance to enhance the therapeutic efficacy and decrease side effects for tumor therapy. The 18%Au–M nanocomposite consists of melanin nanoparticles and Au nanoparticles, in which the Au nanoparticles with high X-ray attenuation capacity can be applied as a CT contrast agent. A series of 18%Au–M dispersions were prepared with an Au concentration in the range of 2.5–40 mM, and they exhibited higher brightness than the clinical iobitridol solutions at equivalent concentrations, as demonstrated in the CT image (Fig. 8a). In addition, the slope of the HU value for the 18%Au–M dispersions (7.8 HU mM−1) was much higher than that (3.7 HU mM−1) for the iobitridol solutions due to their higher X-ray attenuation coefficient (Au: 5.16 cm2 kg−1 and I: 1.94 cm2 kg−1 at 100 keV).28,45 Furthermore, due to the excellent biocompatibility and good CT efficacy of 18%Au–M, we measured its CT imaging effect in vivo. A tumor-bearing mouse was injected intratumorally with 18%Au–M solution (100 μL, 0.4 g L−1) and imaged under a CT instrument (Fig. 8b). The CT image in the tumor site at 30 min post-injection showed higher contrast enhancement (101.4 ± 8 HU) than the images before injection (27.1 ± 5 HU). These results suggest that 18%Au–M can be expected to be a good CT contrast nanoagent.Photoacoustic (PA) imaging has received tremendous interest due to its simultaneous high contrast and high spatial resolution.46,47 The present 18%Au–M nanocomposite with high NIR absorbance and photothermal effect may be a prominent contrast agent for PA imaging. When 18%Au–M in saline solution (100 μL, 0.4 g L−1) was injected into the tumor center of a mouse, the tumor site could be visualized clearly by PA imaging compared with the low signals before injection (Fig. 9a). The mean value of the signal intensity post-injection was nearly three-fold that before-injection (Fig. 9b), indicating that the 18%Au–M nanocomposite is an efficient contrast nanoagent for PA imaging of tumors.
Encouraged by the efficient photothermal ablation in vitro, we then evaluated the in vivo tumor treatment efficacy induced by the photothermal effect of the 18%Au–M nanocomposite. 4T1 breast tumor-bearing mice were randomly divided into four groups: (I) saline injection, (II) saline injection with NIR laser, (III) 18%Au–M dispersion injection, and (IV) 18%Au–M dispersion injection with NIR laser. The mice were firstly anesthetized and then intratumorally injected with saline solution (100 μL) in groups I and II and 18%Au–M dispersion (100 μL, 0.4 g L−1) in groups III and IV. After 30 min, groups II and IV were irradiated with a 808 nm laser (1.0 W cm−2) for 10 min, and the thermal images of the mice and the temperature were recorded using an IR thermal camera. Before irradiation (at 0 s) with the 808 nm laser, the thermal images of the mice (groups II and IV) exhibited a well-distributed vermilion color, illustrating a relatively uniform temperature distribution in the two mice (Fig. 9c and Fig. S11, ESI†). When the saline-injected mice (group II) were exposed to the 808 nm laser, the tumor exhibited a negligible temperature elevation from 34.3 °C to 36.0 °C (Fig. 9c), showing a slight color change in the thermal images and low photothermal effect. In contrast, for the Au–M dispersion-injected mice (group IV), the tumor surface temperature increased rapidly from ∼34.2 °C to ∼52.0 °C at 120 s, and finally stabilized at ∼54.5 °C in a period of 120–600 s (Fig. 9c and Fig. S11, ESI†), indicating rapid temperature elevation in the tumor. This rapid elevation is attributed to the outstanding photothermal effect of 18%Au–M within the tumor.
To further evaluate the long-term tumor treatment efficacy, the mice in all groups were observed for 14 days. The relative tumor volumes of the mice were measured and plotted as a function of observation time (Fig. 10a). Obviously, the tumor volumes in groups I, II, and III at day 14 increased rapidly and by more than 10 times, as demonstrated vividly in the photos of the mice (Fig. S12, ESI†). The tumors at day 14 became quite large and then the mice were sacrificed to harvest their tumors (Fig. 10b). The 12 tumors in groups I II, and III exhibited a relatively large volume, indicating that NIR laser irradiation or 18%Au–M alone cannot kill cancer cells to induce apparent tumor inhibition. On the contrary, the curve of the tumor volumes in group IV decreased rapidly. Especially, at day 14, the tumors in groups IV were almost eradicated, leaving a scar at the initial site (Fig. S12, ESI†). When the mice were sacrificed to remove the tumors, the volume of the tumors in group IV was reduced remarkably in comparison to that in groups I, II, and III, revealing the distinct tumor suppression by the combination of 18%Au–M and NIR laser irradiation. Besides, the body weight of the mice was also measured. The body weights in the four groups (I–IV) increased slightly (Fig. 10c), suggesting that the mice were in a good state during the observation time. To further assess the histological changes in the tumors after the different treatments, the mice were sacrificed according to the animal protocol to achieve the tumors at 24 h post-treatment, and the tumors were stained with the haematoxylin and eosin (H&E) assay. Obviously, the images of groups I, II, and III exhibited no obvious differences in cell size and shape, nuclear modifications, and necrosis after irradiation with the 808 nm laser (Fig. 10d). This illustrates that the mono-therapy with only a 808 nm laser or only 18%Au–M treatment is insufficient to ablate cancer cells. Significantly, thermal cell necrosis signs were observed in the image of group IV, including cancer cell shrinkage, loss of contact, eosinophilic cytoplasm, and nuclear damage. This remarkable contrast verifies that in vivo cancer cells can be effectively ablated through the hyperthermia (∼52 °C) arising from the outstanding photothermal effect of 18%Au–M. Therefore, the 18%Au–M nanocomposite can be expected to be a novel and satisfactory photothermal agent for cancer treatment.
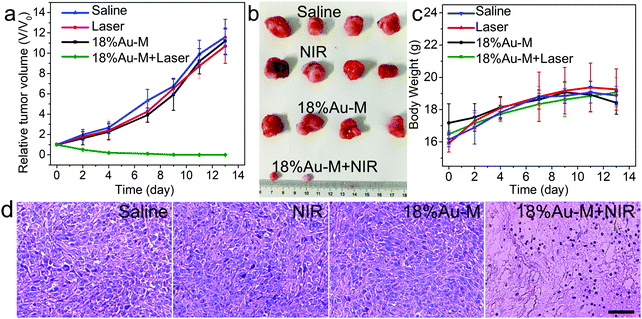 | ||
| Fig. 10 Relative tumor volume (a), tumor photos (b) and body weight (c) of the mice from different groups. (d) Histological images from the tumor at 24 h post-treatment. Scale bars: 50 μm. | ||
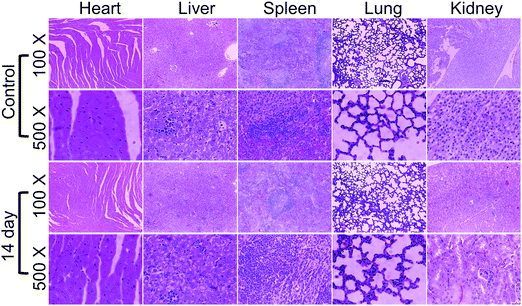
To investigate the in vivo toxicity of the 18%Au–M nanocomposite, the hemolysis assay was firstly applied. The results showed that negligible hemolysis was observed with the 18%Au–M nanocomposite in the concentration investigated (0.025–0.8 g L−1), demonstrating its outstanding blood compatibility (Fig. S13, ESI†). Subsequently, the H&E-stained images of the main organs (heart, liver, spleen, lung, and kidney) from the different groups were also observed (Fig. 11). There was no necrosis or apoptosis of cells or any damage in the organs and tissues in the heart, liver, spleen, lung and kidney, illustrating that the 18%Au–M nanocomposite has excellent long-term biosafety. These results sufficiently verify that the combination of 18%Au–M and 808 nm laser irradiation can effectively ablate tumor cells in vivo without toxicity and adverse effects in mice at the given doses. Therefore, the 18%Au–M nanocomposite show excellent photothermal effects for cancer cells in vivo with illumination from an 808-laser without unpleasant side-effects at the given doses.
4. Conclusions
In summary, the in situ growth of Au nanoparticles on natural melanin was realized by mixing HAuCl4 and melanin solution at room temperature for 14 h. The resulting Au–M nanocomposites exhibited excellent strong NIR absorbance, high photothermal conversion efficiency (42.3%) and biocompatibility. When the nanocomposites were injected into tumor-bearing mice, the tumors could be detected by CT, PA and thermal imaging. Furthermore, cancer cells could be ablated with the illumination of an 808 nm laser, resulting in the elimination of tumors in mice. Therefore, the Au–M nanocomposites can be used as a novel and multifunctional theranostic nanoagent for simultaneous tumor CT/PA/thermal imaging and PTT. Importantly, this work not only developed natural melanin–Au nanocomposites as a new theranostic nanoagent, but also provides some insight into the enhancement of the performance of natural materials for multi-imaging guided therapy.Conflicts of interest
There are no conflicts to declare.Acknowledgements
This work was financially supported by the National Natural Science Foundation of China (Grant No. 51473033, 51773036), Program for Innovative Research Team in University of Ministry of Education of China (Grant No. IRT_16R13), Science and Technology Commission of Shanghai Municipality (Grant No. 16JC1400700), Natural Science Foundation of Shanghai (18ZR1401700), Innovation Program of Shanghai Municipal Education Commission (Grant No. 2017-01-07-00-03-E00055), the Fundamental Research Funds for the Central Universities, and DHU Distinguished Young Professor Program.References
- R. L. Siegel, K. D. Miller and A. Jemal, Ca-Cancer J. Clin., 2018, 68, 7–30 CrossRef.
- L. Cheng, C. Wang, L. Z. Feng, K. Yang and Z. Liu, Chem. Rev., 2014, 114, 10869–10939 CrossRef CAS.
- H. K. Moon, S. H. Lee and H. C. Choi, ACS Nano, 2009, 3, 3707–3713 CrossRef CAS.
- K. Yang, S. Zhang, G. Zhang, X. Sun, S.-T. Lee and Z. Liu, Nano Lett., 2010, 10, 3318–3323 CrossRef CAS.
- Y. B. Li, W. Lu, Q. A. Huang, M. A. Huang, C. Li and W. Chen, Nanomedicine, 2010, 5, 1161–1171 CrossRef CAS PubMed.
- D. D. Wang, H. F. Dong, M. Li, Y. Cao, F. Yang, K. Zhang, W. H. Dai, C. T. Wang and X. J. Zhang, ACS Nano, 2018, 12, 5241–5252 CrossRef CAS.
- L. Wen, L. Chen, S. Zheng, J. Zeng, G. Duan, Y. Wang, G. Wang, Z. Chai, Z. Li and M. Gao, Adv. Mater., 2016, 28, 5072–5079 CrossRef CAS.
- E. C. Dreaden, M. A. Mackey, X. H. Huang, B. Kang and M. A. El-Sayed, Chem. Soc. Rev., 2011, 40, 3391–3404 RSC.
- G. Wang, Z. Li, X. Luo, R. Yue, Y. Shen and N. Ma, Nanoscale, 2018, 10, 16508–16520 RSC.
- X. Huang, S. Tang, J. Yang, Y. Tan and N. Zheng, J. Am. Chem. Soc., 2011, 133, 15946–15949 CrossRef CAS.
- J. Yang, J. Choi, D. Bang, E. Kim, E. K. Lim, H. Park, J. S. Suh, K. Lee, K. H. Yoo, E. K. Kim, Y. M. Huh and S. Haam, Angew. Chem., Int. Ed., 2011, 50, 441–444 CrossRef CAS.
- Z. B. Zha, X. L. Yue, Q. S. Ren and Z. F. Dai, Adv. Mater., 2013, 25, 777–782 CrossRef CAS.
- Q. W. Tian, F. R. Jiang, R. J. Zou, Q. Liu, Z. G. Chen, M. F. Zhu, S. P. Yang, J. L. Wang, J. H. Wang and J. Q. Hu, ACS Nano, 2011, 5, 9761–9771 CrossRef CAS.
- Q. W. Tian, M. H. Tang, Y. G. Sun, R. J. Zou, Z. G. Chen, M. F. Zhu, S. P. Yang, J. L. Wang, J. H. Wang and J. Q. Hu, Adv. Mater., 2011, 23, 3542–3547 CrossRef CAS.
- Z. Meng, F. Wei, R. Wang, M. Xia, Z. Chen, H. Wang and M. Zhu, Adv. Mater., 2016, 28, 245–253 CrossRef CAS PubMed.
- Z. G. Chen, Q. Wang, H. L. Wang, L. S. Zhang, G. S. Song, L. L. Song, J. Q. Hu, H. Z. Wang, J. S. Liu, M. F. Zhu and D. Y. Zhao, Adv. Mater., 2013, 25, 2095–2100 CrossRef CAS.
- M. Chu, H. Li, Q. Wu, F. Wo and D. Shi, Biomaterials, 2014, 35, 8357–8373 CrossRef CAS.
- C. Xu, Y. Wang, H. Yu, H. Tian and X. Chen, ACS Nano, 2018, 12, 8255–8265 CrossRef CAS PubMed.
- M. Q. Chu, W. X. Hai, Z. Y. Zhang, F. J. Wo, Q. Wu, Z. F. Zhang, Y. X. Shao, D. Zhang, L. Jin and D. L. Shi, Biomaterials, 2016, 91, 182–199 CrossRef CAS PubMed.
- Q. Jiang, Z. M. Luo, Y. Z. Men, P. Yang, H. B. Peng, R. R. Guo, Y. Tian, Z. Q. Pang and W. L. Yang, Biomaterials, 2017, 143, 29–45 CrossRef CAS.
- D. W. Zheng, S. Hong, L. Xu, C. X. Li, K. Li, S. X. Cheng and X. Z. Zhang, Adv. Mater., 2018, 30, 1800836 CrossRef.
- G. Song, C. Liang, H. Gong, M. Li, X. Zheng, L. Cheng, K. Yang, X. Jiang and Z. Liu, Adv. Mater., 2015, 27, 6110–6117 CrossRef CAS.
- G. Yang, H. Gong, T. Liu, X. Sun, L. Cheng and Z. Liu, Biomaterials, 2015, 60, 62–71 CrossRef CAS.
- Y. Cao, X. D. Meng, D. D. Wang, K. Zhang, W. H. Dai, H. F. Dong and X. J. Zhang, ACS Appl. Mater. Interfaces, 2018, 10, 17732–17741 CrossRef CAS.
- Q. Tian, J. Hu, Y. Zhu, R. Zou, Z. Chen, S. Yang, R. Li, Q. Su, Y. Han and X. Liu, J. Am. Chem. Soc., 2013, 135, 8571–8577 CrossRef CAS.
- Z. Q. Meng, F. Wei, W. J. Ma, N. Yu, P. L. Wei, Z. J. Wang, Y. Q. Tang, Z. G. Chen, H. P. Wang and M. F. Zhu, Adv. Funct. Mater., 2016, 26, 8231–8242 CrossRef CAS.
- N. Yu, C. Peng, Z. J. Wang, Z. X. Liu, B. Zhu, Z. G. Yi, M. F. Zhu, X. G. Liu and Z. G. Chen, Nanoscale, 2018, 10, 2542–2554 RSC.
- N. Yu, Z. Wang, J. Zhang, Z. Liu, B. Zhu, J. Yu, M. Zhu, C. Peng and Z. Chen, Biomaterials, 2018, 161, 279–291 CrossRef CAS.
- J. B. Cui, R. Jiang, C. Guo, X. L. Bai, S. Y. Xu and L. Y. Wang, J. Am. Chem. Soc., 2018, 140, 5890–5894 CrossRef CAS.
- Y. Liu, X. L. Lv, H. Liu, Z. J. Zhou, J. P. Huang, S. L. Lei, S. H. Cai, Z. Chen, Y. L. Guo, Z. W. Chen, X. Zhou and L. M. Nie, Nanoscale, 2018, 10, 3631–3638 RSC.
- G. Prota, Med. Res. Rev., 1988, 8, 525–556 CrossRef CAS.
- M. Rozanowska, T. Sarna, E. J. Land and T. G. Truscott, Free Radical Biol. Med., 1999, 26, 518–525 CrossRef CAS.
- Z. Y. Huo, C. K. Tsung, W. Y. Huang, X. F. Zhang and P. D. Yang, Nano Lett., 2008, 8, 2041–2044 CrossRef CAS PubMed.
- J. D. S. Newman and G. J. Blanchard, Langmuir, 2006, 22, 5882–5887 CrossRef CAS PubMed.
- T. F. Wu and J. D. Hong, Biomacromolecules, 2015, 16, 660–666 CrossRef CAS PubMed.
- R. A. Zangmeister, T. A. Morris and M. J. Tarlov, Langmuir, 2013, 29, 8619–8628 CrossRef CAS.
- Y. L. Chang, Z. X. Liu, X. F. Shen, B. Zhu, D. K. Macharia, Z. G. Chen and L. S. Zhang, J. Hazard. Mater., 2018, 344, 1188–1197 CrossRef CAS.
- C. Xin, J. H. Ma, C. J. Tan, Z. Yang, F. Ye, C. Long, S. Ye and D. B. Hou, J. Biosci. Bioeng., 2015, 119, 446–454 CrossRef CAS PubMed.
- Z. Movasaghi, S. Rehman and I. U. Rehman, Appl. Spectrosc. Rev., 2008, 43, 134–179 CrossRef CAS.
- J. Q. Wang, H. Liu, Y. Liu, C. C. Chu, Y. Y. Yang, Y. Zeng, W. G. Zhang and G. Liu, Biomater. Sci., 2018, 6, 586–595 RSC.
- M. L. Roldán, S. A. Centeno and A. Rizzo, J. Raman Spectrosc., 2014, 45, 1160–1171 CrossRef.
- D. K. Roper, W. Ahn and M. Hoepfner, J. Phys. Chem. C, 2007, 111, 3636–3641 CrossRef CAS PubMed.
- M. Chen, X. Fang, S. Tang and N. Zheng, Chem. Commun., 2012, 48, 8934–8936 RSC.
- H. H. Xie, Z. B. Li, Z. B. Sun, J. D. Shao, X. F. Yu, Z. N. Guo, J. H. Wang, Q. L. Xiao, H. Y. Wang, Q. Q. Wang, H. Zhang and P. K. Chu, Small, 2016, 12, 4136–4145 CrossRef CAS PubMed.
- L. Cheng, J. J. Liu, X. Gu, H. Gong, X. Z. Shi, T. Liu, C. Wang, X. Y. Wang, G. Liu, H. Y. Xing, W. B. Bu, B. Q. Sun and Z. Liu, Adv. Mater., 2014, 26, 1886–1893 CrossRef CAS PubMed.
- A. Grinvald, E. Lieke, R. D. Frostig, C. D. Gilbert and T. N. Wiesel, Nature, 1986, 324, 361–364 CrossRef CAS PubMed.
- M. H. Xu and L. H. V. Wang, Rev. Sci. Instrum., 2006, 77, 041101 CrossRef.
Footnote |
| † Electronic supplementary information (ESI) available. See DOI: 10.1039/c8tb02724b |
| This journal is © The Royal Society of Chemistry 2019 |

