 Open Access Article
Creative Commons Attribution 3.0 Unported Licence
Scalable synthesis of dispersible iron carbide (Fe3C) nanoparticles by ‘nanocasting’†
D. C.
Fletcher
a,
R.
Hunter
a,
W.
Xia
b,
G. J.
Smales
 c,
B. R.
Pauw
 c,
E.
Blackburn
d,
A.
Kulak
e,
Huolin
Xin
 f and
Z.
Schnepp
 *a
*a
aSchool of Chemistry, University of Birmingham, Birmingham, B152TT, UK. E-mail: z.schnepp@bham.ac.uk
bCenter for Functional Nanomaterials, Brookhaven National Laboratory, Upton, NY11973-5000, USA
cBundesanstalt für Materialforschung und prüfung (BAM), Unter den Eichen 87, Berlin 12205, Germany
dSchool of Physics and Astronomy, University of Birmingham, Birmingham B152TT, UK
eSchool of Chemistry, University of Leeds, Leeds, LS29JT, UK
fSchool of Physical Sciences, University of California, Irvine, CA92697, USA
First published on 5th August 2019
Abstract
Metal carbides have shown great promise in a wide range of applications due to their unique catalytic, electrocatalytic and magnetic properties. However, the scalable production of dispersible metal carbide nanoparticles remains a challenge. Here, we report a simple and scalable route to dispersible iron carbide (Fe3C) nanoparticles. This uses MgO nanoparticles as a removable ‘cast’ to synthesize Fe3C nanoparticles from Prussian blue (KFeIII[FeII(CN)6]). Electron tomography demonstrates how nanoparticles of the MgO cast encase the Fe3C nanoparticles to prevent sintering and agglomeration during the high-temperature synthesis. The MgO cast is readily removed with ethylenediaminetetraacetic acid (EDTA) to generate Fe3C nanoparticles that can be used to produce a colloidal ferrofluid or dispersed on a support material.
Introduction
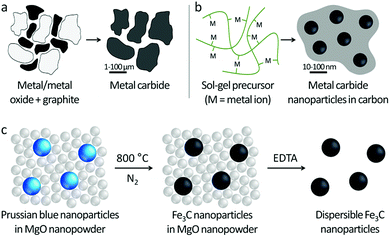
Transition metal carbides have historically been valued for their hardness and chemical resistance. However, more recently they are being investigated for their unique catalytic,1 electrocatalytic2 and magnetic properties,3 particularly at the nanoscale. For example, iron carbide (Fe2.2C and Fe5C2) nanoparticles are applied in magnetic hyperthermia for cancer treatment4 and also Fischer–Tropsch synthesis of liquid hydrocarbons.5 Fe3C (cementite) nanostructures are also being developed for fuel cell reactions such as oxygen reduction6 and hydrogen evolution,7 where they have the potential to replace noble metals. A major factor inhibiting the development of carbides for all of these technologies is the lack of simple, scalable synthetic routes to metal carbide nanoparticles. Many of the potential applications of carbides also require dispersible nanoparticles,8 for example in the production of colloidal dispersions or for combining catalysts with a cocatalyst or support.The scalable synthesis of dispersible transition metal carbides is challenging due to the ceramic nature of carbides. The industrial manufacture of carbides generally relies on direct heating of metal or metal oxide powders with carbon at high temperature, often >1000 °C, which leads to powders of large (1–100 μm) agglomerated particles with low surface area (Fig. 1a). Sol–gel chemistry has provided some useful advances in the synthesis of some iron carbides, including Fe3C. Here, an iron salt is combined in solution with an organic precursor, then heated in an inert atmosphere (Fig. 1b). The organic precursor decomposes to form carbon, which drives formation of Fe3C nanoparticles.9,10 However, while sol–gel chemistry offers good control over Fe3C crystallite size, the resulting nanoparticles are embedded within a matrix of carbon. Dispersing these nanoparticles in solution relies on physical or chemical methods to break individual nanoparticles away from the carbon matrix11 and can result in discarding significant portions of the material.12
In this study, we address the challenge of producing dispersible iron carbide (Fe3C) nanoparticles by synthesizing the nanoparticles within a nanostructured ‘cast’ (Fig. 1c). Iron carbide nanoparticles are prepared by thermal decomposition of nanoparticles of Prussian blue (KFeIII[FeII(CN)6]) within a magnesium oxide nanopowder. Electron tomography demonstrates this proof of concept, showing individual Fe3C nanoparticles ‘wrapped’ in the MgO matrix. The MgO cast is easily removed using aqueous ethylenediaminetetraacetic acid (EDTA) and the resulting Fe3C nanopowder is used to make a ferrofluid, demonstrating the dispersible nature of the Fe3C particles. One of the major advantages of this method is that it is simple and scalable.
Results and discussion
Synthesis and characterization of dispersible Fe3C nanoparticles
Prussian blue nanoparticles protected with polyvinylpyrrolidone were synthesized in a method modified from Uemura et al.13 It is already known that bulk Prussian blue will decompose to Fe3C on heating in an inert atmosphere.14 A MgO/Fe3C nanocomposite was prepared by vigorously mixing the as-synthesized Prussian blue nanoparticles with commercial MgO nanopowder (1![[thin space (1/6-em)]](https://www.rsc.org/images/entities/char_2009.gif) :
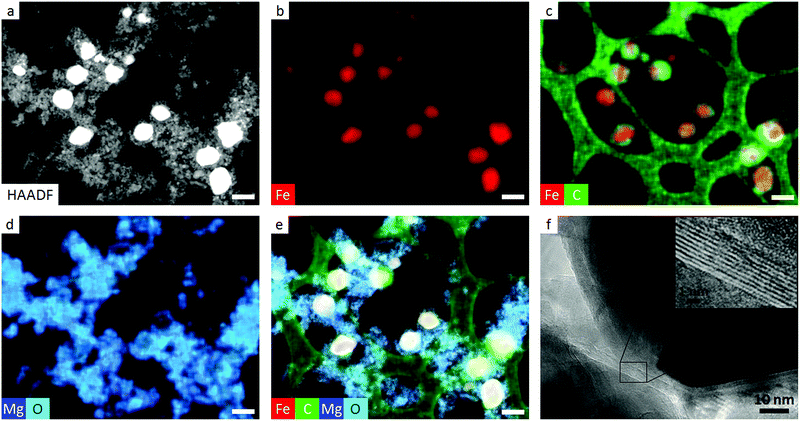
:![[thin space (1/6-em)]](https://www.rsc.org/images/entities/char_2009.gif) 1 ratio by mass) as a slurry in methanol, drying and then calcining the pale blue powder to 800 °C under N2. X-ray diffraction (XRD) patterns of the resulting grey powder showed characteristic peaks for MgO and Fe3C (Fig. 2). High-angle annular dark field (HAADF) transmission electron microscopy (TEM) images (Fig. 3a) show the Fe3C particles as bright spots within a matrix of smaller MgO particles, which have protected the Fe3C nanoparticles from agglomerating or sintering. The separate phases are clearly identified by energy dispersive X-ray (EDX) maps (Fig. 3b–e), with red, blue and turquoise highlighting the position of Fe, Mg and O in the sample, respectively. Green in the EDX map corresponds to carbon and shows both the lacey carbon film of the TEM grid and the presence of carbon shells around many of the Fe3C nanoparticles. This is a common feature of Fe3C synthesis,15 as iron is able to catalyze the conversion of amorphous carbon to graphitic carbon, the carbon in this case coming from the polyvinylpyrrolidone. The presence of the carbon shell is beneficial as it offers protection for the Fe3C nanoparticles against oxidation. High-resolution TEM images confirm the presence of thin graphitic carbon shells around the Fe3C particles, with the fringe spacing of 0.34 nm corresponding to the (002) d-spacing of graphite (Fig. 3f). As a control, a sample of Prussian blue was heated in a furnace without MgO. The TEM image (Fig. S1†) of the resulting sample shows a dense network of Fe3C particles that appear to be sintered together.
1 ratio by mass) as a slurry in methanol, drying and then calcining the pale blue powder to 800 °C under N2. X-ray diffraction (XRD) patterns of the resulting grey powder showed characteristic peaks for MgO and Fe3C (Fig. 2). High-angle annular dark field (HAADF) transmission electron microscopy (TEM) images (Fig. 3a) show the Fe3C particles as bright spots within a matrix of smaller MgO particles, which have protected the Fe3C nanoparticles from agglomerating or sintering. The separate phases are clearly identified by energy dispersive X-ray (EDX) maps (Fig. 3b–e), with red, blue and turquoise highlighting the position of Fe, Mg and O in the sample, respectively. Green in the EDX map corresponds to carbon and shows both the lacey carbon film of the TEM grid and the presence of carbon shells around many of the Fe3C nanoparticles. This is a common feature of Fe3C synthesis,15 as iron is able to catalyze the conversion of amorphous carbon to graphitic carbon, the carbon in this case coming from the polyvinylpyrrolidone. The presence of the carbon shell is beneficial as it offers protection for the Fe3C nanoparticles against oxidation. High-resolution TEM images confirm the presence of thin graphitic carbon shells around the Fe3C particles, with the fringe spacing of 0.34 nm corresponding to the (002) d-spacing of graphite (Fig. 3f). As a control, a sample of Prussian blue was heated in a furnace without MgO. The TEM image (Fig. S1†) of the resulting sample shows a dense network of Fe3C particles that appear to be sintered together.
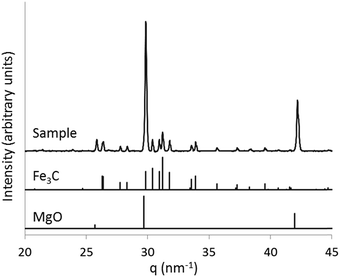 | ||
| Fig. 2 X-ray diffraction pattern of Fe3C/MgO prepared by decomposing a Prussian blue/MgO mixture under N2 (q = 2π/d, where d = d-spacing). | ||
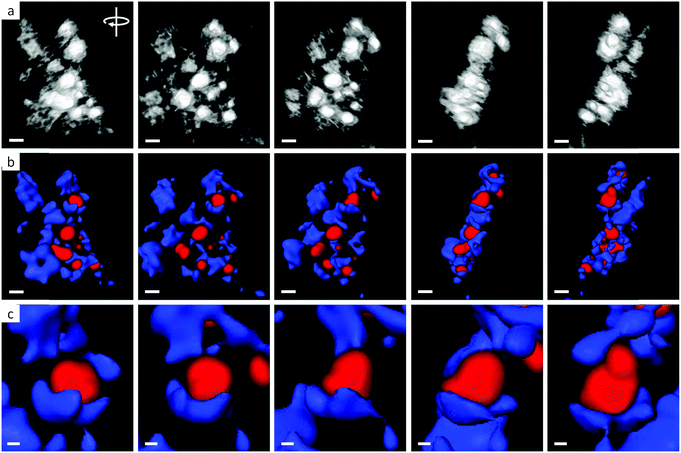
Further evidence for the dispersion of Fe3C nanoparticles within the MgO matrix comes from electron tomography. Fig. 4a shows screenshots from a HAADF tomographic video (ESI Video 1†) produced by processing a series of images of a representative section of sample at 2° tilt intervals through 180°. The bright particles of Fe3C can be seen dispersed within the matrix of smaller MgO nanoparticles. Fig. 4b shows the screenshots from a corresponding EDX tomographic video (ESI Video 2†), showing Fe-rich particles (red) dispersed within a Mg-rich (blue) matrix. A magnified portion of the sample shows how the MgO matrix is able to partially encapsulate the Fe3C nanoparticles (Fig. 4c), demonstrating the ‘cast’ concept.
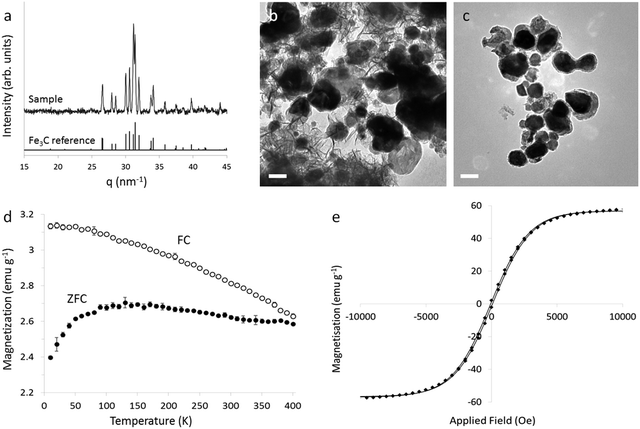
To isolate dispersible Fe3C nanoparticles, aqueous ethylenediaminetetraacetic acid (EDTA) was used to dissolve the MgO cast. Washing with EDTA, rinsing with water then ethanol and drying in air produces a black solid with characteristic XRD peaks for Fe3C (Fig. 5a) with all characteristic peaks for crystalline MgO removed. Elemental analysis (by Flame Atomic Absorption Spectroscopy) also indicated that 98% of the Mg had been removed by EDTA washing (ESI Section 1.2†). TEM images of the EDTA-washed sample show particles of Fe3C alongside material with a rumpled sheet or fibre-like appearance (Fig. 5b). This is attributed to amorphous carbon as elemental analysis of the sample shows 17.5% carbon (by mass) compared to 6.7% in pure Fe3C, due to excess carbon from the polyvinylpyrrolidone. The amorphous carbon can be removed by washing the sample with dilute H2O2 (as reported by Schliehe et al., details in ESI†)11 leaving only a graphitic carbon shell around each Fe3C nanoparticle (Fig. 5c) and without oxidizing the Fe3C (Fig. S2†).
Magnetic properties
The magnetic properties of the Fe3C powder were studied using a superconducting quantum interference device (SQUID). It should be noted that analysis of the magnetic properties of this system is complicated by the polydispersity of the particles and the presence of graphitic shells.16Fig. 5d shows the temperature dependence of the zero-field-cooled (ZFC) and field-cooled (FC) magnetization of a packed powder of Fe3C from 10–400 K under an applied field of 100 Oe. The data indicate superparamagnetic behaviour in at least part of the sample. The ZFC curve exhibits a broad maximum with the peak at 130 K. This is the average blocking temperature (TB); below this point particle moments are not free to thermally fluctuate. Below TB, the ZFC decreases sharply, whereas the FC curve increases gradually, a characteristic of non-interacting or weakly-interacting nanoparticles.17 The ZFC and FC magnetization curves do not converge below 400 K. The point of convergence is the irreversibility temperature (Tirr), and corresponds to the blocking temperature of the largest particles in the sample. As samples are cooled, the particle moments are blocked progressively, since larger particles have a higher energy barrier to thermal fluctuation. The difference between TB and Tirr therefore gives a measure of the distribution of energies, which in turn gives an indication of polydispersity. The large gap between TB and Tirr in this sample indicates a large particle size distribution. This is consistent with the observed polydispersity (resulting from a large size distribution in the Prussian blue precursor). Fig. 5e and S3† show plots of the field dependence of the isothermal magnetization at 400 K and 300 K respectively. At 400 K, the coercivity is 140 Oe and remanence is 2.7 emu g−1 and at 300 K the coercivity is 300 Oe and the remanence is 7 emu g−1, consistent with other reports of Fe3C nanoparticles.18 The saturation magnetization (66 emu g−1 at 300 K) is slightly lower than other reports, possibly due to the presence of defects in the Fe3C structure, or the presence of carbon in the product.Particle size distribution
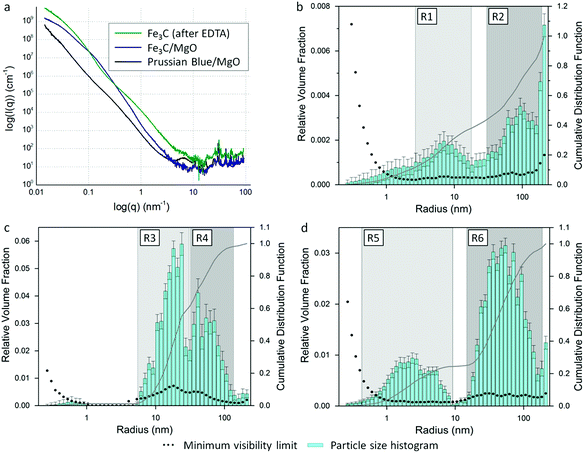
Characterization of the particle size distribution was achieved using small-angle X-ray scattering (SAXS). Fig. 6a shows the SAXS and WAXS (wide-angle X-ray scattering) data fit for a Prussian blue/MgO mixture before pyrolysis, compared to the same sample after pyrolysis (Fe3C/MgO) and after washing with EDTA (Fe3C). The peaks in the high q (WAXS) region correspond to the crystalline phases observed in X-ray diffraction analysis (Fig. S4†). SAXS derives from an interaction between the incident X-ray radiation and regions of contiguous electron density within a sample, which here are nanoparticles (Prussian blue, MgO and Fe3C) and residual carbon. The SAXS data was analysed using a Monte Carlo method to extract form-free size distributions.19 The resulting radius histograms, scaled by relative volume fraction, for samples of Prussian blue/MgO, Fe3C/MgO and Fe3C (after EDTA washing) are shown on a log10 scale in Fig. 6b–d respectively. For the sample of Prussian blue nanoparticles in a MgO matrix, there are two main regions of interest. The first, R1 (∼2–20 nm) corresponds to the MgO nanopowder and is consistent with observations of the MgO in TEM images. R2 (∼30–160 nm) represents the radius distribution of the larger Prussian blue nanoparticles, again consistent with observations from TEM. The tail in the data below 3 nm corresponds to surface roughness and is most like a result of scattering from the polyvinylpyrrolidone that is present on the surface of the Prussian blue nanoparticles from the synthesis method. The same data is plotted on a linear scale in Fig. S5a† and shows that ∼40% (by volume) of the scattering objects are less than 15 nm in radius, representing the MgO nanoparticles and polyvinylpyrrolidone residue. The cumulative distribution function rises steadily after this point, indicating a large size distribution in the Prussian blue.The size distribution data for the Fe3C/MgO mixture also shows a bimodal distribution (Fig. 6c), but with the peaks closer together than the parent Prussian blue/MgO. Region R3 (radii of ∼5–30 nm) represents the MgO particles, with the slightly larger particle radii probably caused by sintering of the MgO during the 800 °C synthesis. The distribution of radii for the Fe3C particles (∼30–120 nm) indicates a contraction of the particles during the Prussian blue to Fe3C transformation (region R4). Given the mass loss the Prussian blue is likely to experience on transforming to Fe3C, a reduction in the particle size is expected. The overall reduction in particle size during the Prussian blue to Fe3C transformation is clearer in the linear plot of the same data (Fig. S5b†), where 80% of the cumulative distribution function represents particles <60 nm in radius. Fig. 6d is the size distribution data for Fe3C (after MgO removal with EDTA). Region R6 (radii of ∼15–160 nm) corresponds to the Fe3C nanoparticles. Region R5 (1–8 nm) is probably a result of scattering from pores and surface roughness of the residual carbon. Scattering features like this have been observed before in templated carbons, where the carbon–air interface produces significant scattering.15 Given that this scattering feature is not present in Fig. 6c, it seems likely that the scattering results from pores created by the removal of MgO. This would suggest that carbon encases some of the MgO particles, possibly resulting from some mixing of MgO with the polyvinylpyrrolidone during precursor synthesis. After treatment with H2O2, the peak of this scattering feature shifts to a smaller radius (∼1.3 nm from ∼3 nm, Fig. S6b†). This is consistent with the removal of amorphous carbon, leaving behind graphitic carbon where scattering occurs due to surface roughness in the sample.
Producing a ferrofluid
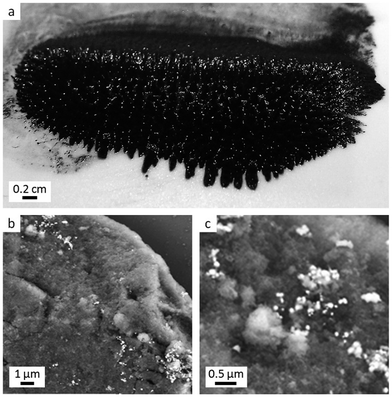
A measure of whether the Fe3C nanoparticles are dispersible is the ability to produce a ferrofluid. Ferrofluids are colloidal dispersions of single-domain magnetic particles in a carrier fluid. They show properties of magnetic materials and fluids.20 In order to produce enough Fe3C for a ferrofluid, a commercial Prussian blue powder was ground in a pestle and mortar with MgO nanopowder. The mixture was pyrolyzed under N2 and washed with aqueous EDTA to generate dispersible Fe3C nanoparticles (full details in ESI†). TEM images (Fig. S7†) show that the scaled-up synthesis does not affect the formation of nanoparticles. SAXS data shows a very similar scattering pattern for the scaled-up sample compared to the sample prepared with as-synthesized Prussian blue (Fig. S8†). The particle size distribution for the scaled-up synthesis no longer shows a bimodal distribution, indicating that the Fe3C and MgO nanoparticles are closer in size (Fig. S8c†), suggesting the commercial sample is more homogeneous. A ferrofluid was prepared by sonicating the Fe3C nanoparticle powder in DI water and oleic acid for 1 hour. The black powder collected in the oleic acid layer, which was separated using a SmCo26 magnet and washed with ethanol/kerosene. Images of the resulting ferrofluid are shown in Fig. 7, with characteristic ‘peaks’ from the dispersed Fe3C particles following the lines of the applied magnetic field. XRD of the magnetic fluid confirmed that Fe3C had been retained (Fig. S9†).Dispersion of particles on a support
A final demonstration of the dispersibility of the Fe3C nanoparticles was to combine them with a support material. Since metal carbides are promising catalysts, it is important to be able to disperse them on standard support materials. Fe3C nanoparticles prepared from as-synthesized Prussian blue nanoparticles were dispersed by sonication in water with cetyltrimethylammonium bromide (CTAB) surfactant to aid dispersion. The resulting solution was then sonicated with silica (kindly provided by Johnson-Matthey) then dried at room temperature. SEM images, taken with a backscattered electron detector, are shown in Fig. 7b and c. The Fe3C nanoparticles can be seen as bright particles dispersed on the darker grey surface of the silica support.Experimental
Prussian blue was prepared by dissolving FeCl2·4H2O (0.6 g) and polyvinylpyrrolidone (1![[thin space (1/6-em)]](https://www.rsc.org/images/entities/char_2009.gif) :
:![[thin space (1/6-em)]](https://www.rsc.org/images/entities/char_2009.gif) 1 molar ratio) in deionised (DI) water (240 ml). Separately, K3[Fe(CN)6] (0.99 g) was dissolved in DI water (60 ml) and the resulting solution added dropwise to the FeCl2 solution. Acetone (300 ml) was added to induce agglomeration of the Prussian blue particles. The particles were washed 3× with acetone and the dark blue solid transferred into methanol (300 ml). MgO nanopowder was added and the mixture stirred thoroughly before drying. To prepare MgO/Fe3C nanoparticle composites, the Prussian blue/MgO mixture was heated at 5 °C min−1 to 800 °C under N2 in a tube furnace. To isolate dispersible Fe3C nanoparticles, the MgO was removed from MgO/Fe3C samples by stirring overnight in 0.2 M aqueous EDTA followed by washing 3× with DI water and ethanol then drying. Full experimental details can be found in the ESI.†
1 molar ratio) in deionised (DI) water (240 ml). Separately, K3[Fe(CN)6] (0.99 g) was dissolved in DI water (60 ml) and the resulting solution added dropwise to the FeCl2 solution. Acetone (300 ml) was added to induce agglomeration of the Prussian blue particles. The particles were washed 3× with acetone and the dark blue solid transferred into methanol (300 ml). MgO nanopowder was added and the mixture stirred thoroughly before drying. To prepare MgO/Fe3C nanoparticle composites, the Prussian blue/MgO mixture was heated at 5 °C min−1 to 800 °C under N2 in a tube furnace. To isolate dispersible Fe3C nanoparticles, the MgO was removed from MgO/Fe3C samples by stirring overnight in 0.2 M aqueous EDTA followed by washing 3× with DI water and ethanol then drying. Full experimental details can be found in the ESI.†
Conclusions
In summary, we have demonstrated the synthesis of dispersible iron carbide nanoparticles by ‘casting’ Prussian blue nanoparticles within a matrix of MgO nanoparticles. The MgO matrix surrounds the Prussian blue particles as they decompose to Fe3C, preventing sintering and agglomeration of the Fe3C. The MgO matrix can easily be removed using EDTA to leave dispersible Fe3C nanoparticles. We have demonstrated the scalability of this process (up to 15 g batches). The resulting Fe3C powder can be dispersed in oleic acid to produce a ferrofluid, or dispersed on a SiO2 support. The Fe3C nanoparticles are quite polydisperse, but it should be possible to improve this by using alternative routes to Prussian blue as well as experimenting with the type of MgO cast and the MgO![[thin space (1/6-em)]](https://www.rsc.org/images/entities/char_2009.gif) :
:![[thin space (1/6-em)]](https://www.rsc.org/images/entities/char_2009.gif) Prussian blue ratio. While this proof of concept focusses on the synthesis of Fe3C, it should be possible to apply this method more generally, e.g. by using Prussian blue analogues or metal organic framework nanoparticles as metal/carbon sources within the same MgO ‘cast’. The importance of this method is that it is simple and scalable and relies on well-established ceramics processing technology, which should enable large-scale manufacture of dispersible metal carbide nanoparticles.
Prussian blue ratio. While this proof of concept focusses on the synthesis of Fe3C, it should be possible to apply this method more generally, e.g. by using Prussian blue analogues or metal organic framework nanoparticles as metal/carbon sources within the same MgO ‘cast’. The importance of this method is that it is simple and scalable and relies on well-established ceramics processing technology, which should enable large-scale manufacture of dispersible metal carbide nanoparticles.
Conflicts of interest
There are no conflicts to declare.Acknowledgements
The authors are grateful to the University of Birmingham for funding (DF PhD studentship) and to the Center for Functional Nanomaterials at Brookhaven National Laboratory for electron microscopy access (Proposal number 35768).References
-
J. S. J. Hargreaves, in Alternative Catalytic Materials, ed. J. S. J. Hargreaves, A. R. McFarlane and S. Laassiri, Royal Society of Chemistry, 2018, p. 71 Search PubMed
.
- D. Li, J. Shi and C. Li, Small, 2018, 14, 1704179 CrossRef PubMed
.
- E. P. Sajitha, V. Prasad, S. V. Subramanyam, A. K. Mishra, S. Sarkar and C. Bansal, J. Phys.: Condens. Matter, 2007, 19, 046214 CrossRef
.
- A. Bordet, R. F. Landis, Y. Lee, G. Y. Tonga, J. M. Asensio, C.-H. Li, P.-F. Fazzini, K. Soulantica, V. M. Rotello and B. Chaudret, ACS Nano, 2019, 13, 2870 CrossRef CAS PubMed
.
- T. A. Wezendonk, X. Sun, A. I. Dugulan, A. J. F. van Hoof, E. J. M. Hensen, F. Kapteijn and J. Gascon, J. Catal., 2018, 362, 106 CrossRef CAS
.
- W.-J. Jiang, L. Gu, L. Li, Y. Zhang, X. Zhang, L.-J. Zhang, J.-Q. Wang, J.-S. Hu, Z. Wei and L.-J. Wan, J. Am. Chem. Soc., 2016, 138, 3570 CrossRef CAS PubMed
.
- H. Lin, W. Zhang, Z. Shi, M. Che, X. Yu, Y. Tang and Q. Gao, ChemSusChem, 2017, 10, 2597 CrossRef CAS PubMed
.
- J. Kim, C. Rong, J. P. Liu and S. Sun, Adv. Mater., 2009, 21, 906 CrossRef CAS
.
- Z. Schnepp, S. C. Wimbush, M. Antonietti and C. Giordano, Chem. Mater., 2010, 22, 5340 CrossRef CAS
.
- C. Giordano and M. Antonietti, Nano Today, 2011, 6, 366 CrossRef CAS
.
- C. Schliehe, J. Yuan, S. Glatzel, K. Siemensmeyer, K. Kiefer and C. Giordano, Chem. Mater., 2012, 24, 2716 CrossRef CAS
.
- V. Khare, A. Kraupner, A. Mantion, A. Jeličić, A. F. Thünemann, C. Giordano and A. Taubert, Langmuir, 2010, 26, 10600 CrossRef CAS PubMed
.
- T. Uemura and S. Kitagawa, J. Am. Chem. Soc., 2003, 125, 7814 CrossRef CAS PubMed
.
- C. Aparaicio, L. Machala and Z. Marusak, J. Therm. Anal. Calorim., 2012, 110, 661 CrossRef
.
- Z. Schnepp, Y. Zhang, M. J. Hollamby, B. R. Pauw, M. Tanaka, Y. Matsushita and Y. Sakka, J. Mater. Chem. A, 2013, 1, 13576 RSC
.
- M. A. Willard, L. K. Kurihara, E. E. Carpenter, S. Calvin and V. G. Harris, Int. Mater. Rev., 2004, 49, 125 CrossRef CAS
.
- R. D. Zysler, M. Vasquez Mansilla and D. Fiorani, Eur. Phys. J. B, 2004, 41, 171 CrossRef CAS
.
- E. P. Sajitha, V. Prasad, S. V. Subramanyam, A. K. Mishra, S. Sarkar and C. Bansal, J. Phys.: Condens. Matter, 2007, 19, 046214 CrossRef
.
- I. Bressler, B. R. Pauw and A. F. Thünemann, J. Appl. Crystallogr., 2015, 48, 962 CrossRef CAS PubMed
.
- V. Amendola, P. Riello and M. Meneghetti, J. Phys. Chem. C, 2011, 115, 5140 CrossRef CAS
.
Footnote |
| † Electronic supplementary information (ESI) available. See DOI: 10.1039/c9ta06876g |
| This journal is © The Royal Society of Chemistry 2019 |

