
 Open Access Article
 This Open Access Article is licensed under a Creative Commons Attribution-Non Commercial 3.0 Unported Licence
Transition metal electrocatalysts encapsulated into N-doped carbon nanotubes on reduced graphene oxide nanosheets: efficient water splitting through synergistic effects†
Wenchao
Wan
a,
Shiqian
Wei
b,
Jingguo
Li
a,
Carlos A.
Triana
a,
Ying
Zhou
 b and
Greta R.
Patzke
*a
b and
Greta R.
Patzke
*a
aDepartment of Chemistry, University of Zurich, Winterthurerstrasse 190, CH-8057 Zurich, Switzerland. E-mail: greta.patzke@chem.uzh.ch
bThe Center of New Energy Materials and Technology, School of Materials Science and Engineering, Southwest Petroleum University, Chengdu 610500, China
First published on 10th June 2019
Abstract
The development of efficient noble-metal free electrocatalysts is crucial for clean hydrogen production through water splitting. As carbon-based supports are expected to play a major role in low cost electrocatalysis, improved synthetic methods and a deeper understanding of their mechanisms of action are now required. To this end, we synthesized transition metal catalysts for overall water splitting encapsulated into nitrogen-doped carbon nanotubes (M–N-CNTs, M = Ni, Co, Fe) through a direct and convenient pyrolysis of bulk g-C3N4. Furthermore, the addition of reduced graphene oxide (rGO) leads to a significant dispersion of the catalytic N-CNTs. Among the obtained catalyst series, NiFe–N-CNT with rGO (NiFe–N-CNT–rGO) exhibits extremely low overpotential of 270 mV (on glassy carbon) for the oxygen evolution reaction (OER) at a current density of 10 mA cm−2. This performance is superior to most of the previously reported noble metal-free catalysts for OER. Our comprehensive study unravels that the growth of CNTs follows a “reduction–nucleation–growth” process. The thermally reduced metallic nanoparticles (NPs) serve as nucleation sites of carbon species on their surface to further promote N-CNT growth. Density functional theory (DFT) calculations reveal that the CNT walls and N-dopants in the catalysts modify the electronic structure and adjust the free energy toward the adsorption of intermediates. The one-step hydrogen evolution reaction (HER) process is influenced more strongly by N-centers when compared to the four-electron transfer OER process. The scalable and straightforward synthesis together with excellent electrocatalytic performance renders the NiFe–N-CNT–rGO hybrid catalyst quite promising for large-scale water splitting applications.
Introduction
Electrocatalytic water splitting is a powerful pathway for energy storage and conversion via oxygen and hydrogen evolution reactions (OER and HER). The current primary goal of electrocatalytic water splitting is the development of highly active catalysts to decrease the overpotential that is required to expedite the sluggish kinetics of both half reactions, especially of the OER.1–5 Although great progress was achieved in the performance enhancement of various electrocatalysts for water splitting,1,6,7 the noble metals and their metal oxides, such as Pt/C and Ir/C or RuO2, remain the current leading catalyst types.8,9 However, their large-scale applications are greatly limited by high costs and metal scarcity.10 Therefore, the development of efficient, robust and low-cost noble metal-free electrocatalysts is a challenging and urgent task in clean energy research. Along these lines, heterogeneous earth abundant transition metal-based electrocatalysts, such as of Fe, Co, or Ni, have been reported as the most promising candidates for water splitting due to their relatively low costs, robustness and flexible tuning options of electronic structure and chemical states.8,11 Most studies on such transition metals are focused on their oxides,12–14 sulfides,15 carbides,16 nitrides,17 phosphides18,19 and related compounds.20,21 However, without protective layers, many of them may undergo irreversible changes in their chemical compositions after electrocatalytic reactions. This can affect their stability and renders the underlying catalytic mechanisms even more difficult to understand. Moreover, metals in their oxidized forms display lower conductivity and electron transfer efficiency, which is unfavorable for their catalytic activity.22Recently, novel carbon encapsulated metals have been introduced as an innovative electrocatalyst type that overcomes many of these current performance issues.23 We here present a convenient strategy to enhance the catalytic properties of low-cost metal alloys through their encapsulation into N-doped carbon nanotubes (N-CNTs) supported on rGO sheets as economic performance boosters. In such encapsulated architectures, electrons of the transition metals can penetrate through the carbon shell to the surface of the external carbon layer, where they promote catalytic reactions. In turn, the carbon atoms can completely prevent direct contact between electrolyte molecules and encapsulated metal NPs, thereby offering active sites on the carbon surface.24,25 It is well established that metal ions can only serve as active oxygen evolution sites in their host lattices after their demanding oxidation to high valent states.26–29 Consequently, the lower valent carbon encapsulated metal catalysts can excel through higher reactivity in water oxidation.6,23,30 Furthermore, the difference in work functions between the carbon materials and metals can promote the mobility of electrons from metals to the carbon surface, leading to a decrease in the local work function and an increase in the density of states (DOS) in the vicinity of the Fermi level on the carbon shell. This can significantly change its bonding characteristics towards intermediates and thus enhance the overall catalytic activity.23,31 Typical carbon encapsulated catalysts fall into two general morphological categories, namely catalyst nanoparticles embedded either into graphene nanosheets or into CNTs. The former are generally synthesized via C–N organometallic precursors,32,33 whose C–N architectures around the metal ions are converted into the carbon shell covering the surface of the metal. However, this strategy renders the tuning of the electronic structure via the addition of excess metal elements into the graphene shell difficult. Furthermore, such interconnected nanospheres without any support are more likely to undergo aggregation. As for CNT encapsulated catalysts, metal salts are first coordinated with carbon and nitrogen containing molecules in solution, such as dicyandiamide and melamine. The final products are then obtained through well-known pyrolysis routes.26,34,35 This method permits a more flexible doping of external metal elements into the CNT cage by simply mixing the corresponding metal salts with the C/N-containing precursors, thus providing an efficient approach to optimize the electronic structure.24,36
However, the molecular reaction of C/N-precursors and metal salts unavoidably leads to side processes, such as implanting of metal atoms into the carbon lattice or residual metal clusters and NPs outside the carbon layers during the high temperature pyrolysis.37,38 This renders follow-up studies on active sites and mechanisms more complicated. Unfortunately, this issue is rarely taken into account by most current studies.37 Additionally, the precise water splitting functionalities of nitrogen atoms doped into the carbon shell are still ambiguous, especially with respect to the different conditions applied during HER and OER processes.
In this study, we thus developed a more convenient and direct strategy for the synthesis of CNT encapsulated metal catalysts employing pre-fabricated g-C3N4 and transition metal salts as precursors via a straightforward “reduction–nucleation–growth” process. This reaction mechanism can avoid the insertion of metal atoms or clusters into the carbon lattices and leftover NPs out of the carbon shell. The follow-up coupling with rGO nanosheets produces electrocatalysts with high specific surface areas and remarkable water splitting performance.
The emerging hybrid NiFe-based catalysts exhibit extremely low overpotentials of 270 and 230 mV, respectively, for OER and HER at a current density of 10 mA cm−2 in alkaline electrolyte. X-ray absorption spectroscopy (XAS) further confirmed that the transition metals are incorporated into the N-CNT as an alloy. We demonstrate that the encapsulated architecture offers at least three advantages, namely increased surface area, high porosity, and optimized electronic structure of the catalysts. Density functional theory (DFT) calculations reveal that the “M–N–C” moieties are the active sites, while the influence of the carbon shell and the N dopants on the electronic structure changed the adsorption energy of intermediates. In the following, we introduce a facile strategy to fabricate low cost and high performance carbon based catalysts for electrocatalytic overall water splitting.
Results and discussion
Synthesis and structural/morphological characterizations
The synthetic route leading to the growth of metal nanoparticles within the N-doped CNTs is illustrated in Fig. 1. First, g-C3N4 powder was electrostatically coordinated to Ni2+ and Fe3+ ions under aqueous conditions through ultrasonic treatment and robust mechanical stirring. The prepared dispersion was then freeze-dried, leading to uniform anchoring of Ni2+ and Fe3+ on the surface of g-C3N4. The final product (NiFe–N-CNT) was achieved via pyrolysis at 900 °C under nitrogen atmosphere. Similarly, NiFe–N-CNT–rGO was prepared via the above route with moderate addition of graphene oxide (GO) solution into the dispersion during stirring and ultrasonic treatment (for all details cf. ESI†). All catalysts were investigated with powder X-ray diffraction (PXRD), and similar diffraction patterns (Fig. 2a) were recorded for NiFe, NiFe–N-CNT and NiFe–N-CNT–rGO with four distinct diffraction peaks around 2θ = 20, 23, 33 and 39°, corresponding to the (111), (200), (220) and (311) reflections of cubic nickel (PDF no. 04-0850). Peak shifts to lower 2θ values were observed for all catalysts containing NiFe alloys, confirming Fe substitution into the cubic Ni structure (Fig. S1†). PXRD patterns of bare rGO and C3N4–GO do not display distinct peaks (Fig. S2†), probably due to poor crystallinity or defect-rich structures.39 Raman spectra of NiFe–N-CNT, NiFe–N-CNT–rGO and bare rGO display the characteristic D and G bands at 1344 cm−1 and 1685 cm−1, respectively, which further confirms the presence of both CNTs and rGO in the composites (Fig. 2b). The weak 2D band at 2700 cm−1 attributed to two phonon lattice vibrations in the graphitic structure only appeared in bare rGO, probably due to the prevailing disordered CNT structures in the other samples. To further investigate the reduction of GO in the samples, Raman spectra and PXRD patterns were recorded (Fig. S3†). In the Raman spectrum, the D type bands relate to the defects and disorder in sp2-hybridized carbon materials and the G type band represents the E2g mode in graphite, reflecting the symmetry and the degree of the crystallinity of the graphitic materials. The observed increase of the ID/IG ratio can be attributed to the increase of defects and disorders in the rGO layers, indicating structural changes after pyrolysis. This can arise from removal of functional groups going hand in hand with carbon loss from GO as carbon oxides. Furthermore, the value of ID/IG is also related to the average distance between defects.40 The change of the interlayer spacing during the reduction is evident from the PXRD pattern. All in all, both the Raman spectra and the PXRD pattern after reductive treatment indicate that the structure of GO has been changed after the reduction process.40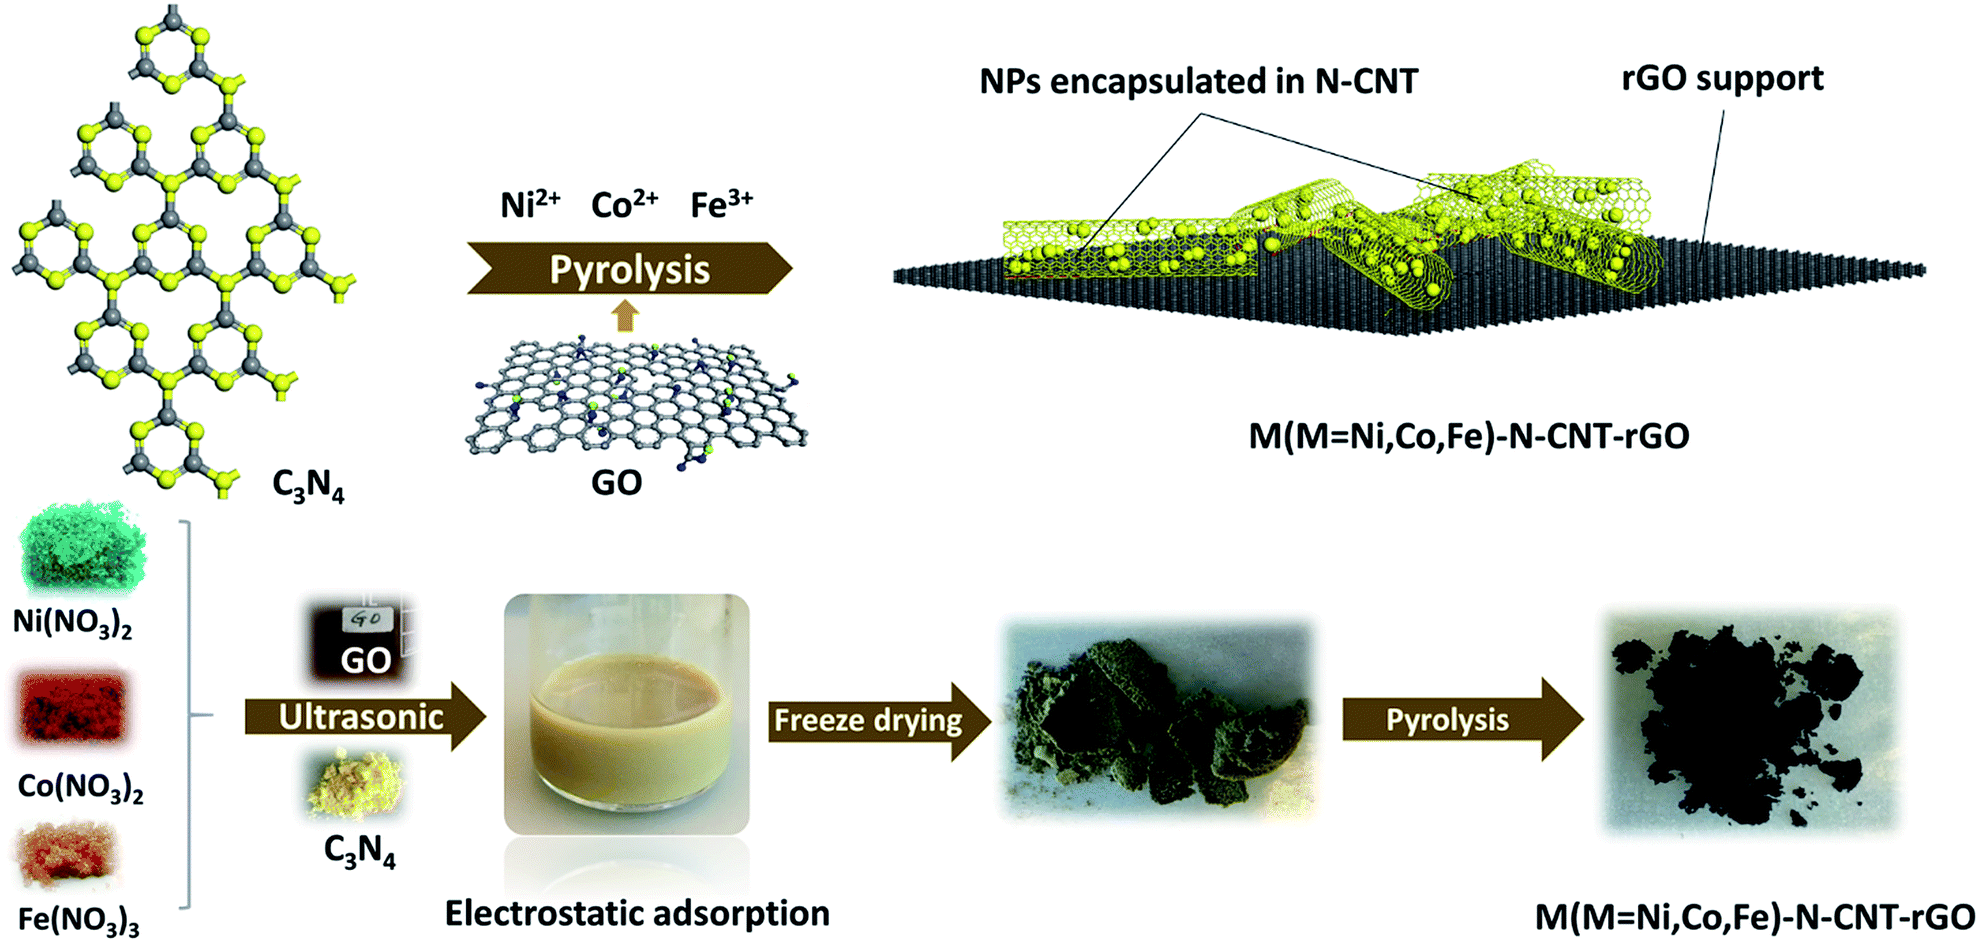 | ||
| Fig. 1 Schematic synthesis workflow for metallic Ni, Fe and Co NPs and their alloys encapsulated into N-doped CNTs dispersed on rGO layers. | ||
 | ||
| Fig. 2 (a) PXRD patterns of as-prepared NiFe–N-CNT, NiFe–N-CNT–rGO, bare NiFe and rGO. (b) Raman spectra of as-prepared NiFe–N-CNT, NiFe–N-CNT–rGO and bare rGO. (c and d) Representative SEM images of NiFe–N-CNT–rGO and NiFe–N-CNT (scale bar = 300 nm). (e and f) Representative TEM images of NiFe–N-CNT–rGO and NiFe–N-CNT. (g) HRTEM image of NiFe–N-CNT–rGO. | ||
The catalysts were morphologically characterized by scanning electron microscopy (SEM) and high-resolution transmission electron microscopy (HRTEM). The NiFe alloys with a size distribution of 10–30 nm are encapsulated into the bamboo-type CNTs (Fig. 2e and f). However, the bare CNT-encapsulated NiFe alloys in the absence of rGO supports are notably aggregated (Fig. 2f and S4†). In comparison, CNTs in NiFe–N-CNT–rGO show very good dispersion on rGO layers (Fig. 2c and e). Bare NiFe alloys prepared without g-C3N4 and GO display random aggregation (Fig. S5†), indicating a different growth process. HRTEM images further suggest that the NiFe alloys are completely encapsulated into the CNTs and covered by CNT walls (Fig. 2g and S6†). The NiFe alloy exhibits d-spacings of 0.21 nm and 0.175 nm, corresponding to the (111) and (200) crystal planes, in agreement with the PXRD data. The thickness of the CNT wall is around 2.5 nm (Fig. 2g), corresponding to approximately 8 carbon layers. Previous studies proved that electrons of the encapsulated metal cores could penetrate through several carbon layers to promote the catalytic reactivity and stability.36,41,42 Therefore, such a “core–shell” structure is generally assumed to improve the electrocatalytic performance.
Formation pathway of CNT-encapsulated nanoparticle alloys
To investigate the growth mechanism of the encapsulated structure, bare g-C3N4, NiFe and C3N4–GO were synthesized in reference experiments under the same conditions. However, neither material displayed the characteristic encapsulated structure (Fig. S5 and S7†). Notably, bare g-C3N4 without Ni2+ and Fe3+ was totally decomposed at the applied pyrolysis temperature. We thus propose that the formation of N-doped CNTs arises from the direct interaction between transition metal cations and g-C3N4. To further understand the formation mechanism, a series of NiFe–N-CNT catalysts were prepared at different temperatures from 500 to 800 °C. As shown in the SEM images (Fig. S8†), bulk g-C3N4 retained its initial morphology when the temperature is lower than 600 °C. Matchstick-type nanorods are formed with the temperature approaching 600 °C. When increasing the temperature further, typical CNT morphologies gradually emerged (Fig. S8†), indicating that the main reaction was initiated on the NiFe NPs at around 600 °C. The result is in agreement with thermogravimetric analysis (TGA) results, where significant weight loss occurs between 550 and 720 °C (Fig. S9†). Similar trends emerged from ex situ PXRD patterns and Raman spectra (Fig. S10†). Both analytical methods show that the complete patterns of NiFe alloy and CNT only appeared when the temperature exceeded 600 °C. Moreover, the short nanorods were growing longer upon increasing the temperature to 700 °C and finally to 800 °C. TGA results also show a much higher final mass of the product (1.41 mg) compared to the initially added nominal net mass of NiFe alloy (0.53 mg). This indicates the presence of CNTs after pyrolysis, resulting in a calculated mass fraction of NiFe alloy of ca. 37.4 wt% (Fig. S9†). Although the mass ratio of NiFe was impressively increased after the pyrolysis, the atomic ratio is only around 11 at%, leading to very fluffy and voluminous macroscopic features of the sample. These results suggest that the formation of N-doped CNT encapsulated structures probably follows a “reduction–nucleation–growth” mechanism, starting with the reduction of the transition metal cations into metallic NPs. At higher temperatures and upon release of N atoms, the ionic carbon is adsorbed on the surface of these NPs and starts to nucleate, while the as formed metallic NPs subsequently act as catalysts for CNT growth. The diameters of the final CNTs are dominated to a large extent by the size of the NPs.43,44 In addition to NiFe, we also investigated other transition metals including Co, Ni, Fe and their alloys for the growth of CNT encapsulated structures (Fig. S11 and S12†). As expected, typical CNT structures were found in most samples, with the exception of the sample containing only Fe3+, which is in line with previous reports.45,46 The reason that Fe3+ cannot convert g-C3N4 into CNTs may be linked to the formation of larger Fe NPs during high temperature pyrolysis, which hinders the nucleation process. Given the well-known outstanding performance of NiFe compounds in water splitting,47,48 we exclusively focus on the NiFe–N-CNT catalyst in the following.Analytical characterization of NiFe–N-CNT and NiFe–N-CNT–rGO
X-ray photoelectron spectroscopy (XPS) analyses confirm the presence of C, Ni, Fe, N and slight amounts of O in both NiFe–N-CNT and NiFe–N-CNT–rGO (Fig. S13†). The N contents of 5.7 at% and 5.1 at% in NiFe–N-CNT and NiFe–N-CNT–rGO (Table S7†), respectively, indicate a slight decrease with the addition of rGO. The signals for Ni and Fe are very weak compared to C and N due to the limited penetration depth of XPS towards the core structure of the materials.49 However, the atomic ratios of Ni/Fe are still close to the initial 3![[thin space (1/6-em)]](https://www.rsc.org/images/entities/char_2009.gif) :2 (Table S7†) ratio in the starting materials. High-resolution XPS spectra of C, N, Ni and Fe (calibrated with carbon) show the presence of similar chemical states in NiFe–N-CNT and NiFe–N-CNT–rGO (Fig. 3a–d and S14†).49 The C 1s signal can be deconvoluted into three peaks located at around 284.5, 285.7, and 286.6 eV, which are attributed to C
:2 (Table S7†) ratio in the starting materials. High-resolution XPS spectra of C, N, Ni and Fe (calibrated with carbon) show the presence of similar chemical states in NiFe–N-CNT and NiFe–N-CNT–rGO (Fig. 3a–d and S14†).49 The C 1s signal can be deconvoluted into three peaks located at around 284.5, 285.7, and 286.6 eV, which are attributed to C![[double bond, length as m-dash]](https://www.rsc.org/images/entities/char_e001.gif) C/C–C, CN and C–O/C–N, respectively (Fig. 3a).34 The slight C–O signal may arise from the initial g-C3N4 precursor, which was synthesized under atmospheric conditions. The deconvoluted N 1s signal is attributed to pyridinic-N (398.7 eV) and graphitic-N (401.4 eV).34 The appearance of the N signal confirms that the obtained CNTs were indeed doped with nitrogen during pyrolysis. Previous studies have clearly demonstrated that the conductivity of carbon materials is enhanced through N-doping, along with the introduction of active sites on the carbon based materials.50–52 However, the precise mechanism behind the effect of N atoms on the activity of such catalysts is still under debate, especially for water splitting. The deconvolution of the Ni 2p and Fe 2p spectra (Fig. 3c and d) suggests the presence of diverse chemically distinct species, namely the metallic states of Ni (853.2 and 870.8 eV) and Fe (707.3 and 720.2 eV), the oxidized states of Ni (854.7 and 872.2 eV), Fe2+ (710.6 and 723.4 eV), Fe3+ (713.3 and 726.2 eV), as well as the satellite peaks of Ni (860.3 and 879.2 eV) and Fe (715.3 and 731.3 eV).49 The oxidized states suggest that the surfaces of some alloys are slightly oxidized, probably by the adsorbed O2 species, as observed in other alloys encapsulated into graphene.53 The above-mentioned low signal strength of the Ni and Fe peaks provides further evidence that the NiFe alloys are completely encapsulated by CNTs. Moreover, energy dispersive X-ray spectroscopy (EDX) mapping indicates that NiFe signals only arise from the NiFe NPs and provided no clear signals on the surface of CNTs (Fig. 3e), further supporting the complete encapsulation of the NiFe alloys. Nitrogen EDX mapping of NiFe–N-CNT without rGO further demonstrates the good dispersion of N dopants on the CNTs (Fig. S15†).
C/C–C, CN and C–O/C–N, respectively (Fig. 3a).34 The slight C–O signal may arise from the initial g-C3N4 precursor, which was synthesized under atmospheric conditions. The deconvoluted N 1s signal is attributed to pyridinic-N (398.7 eV) and graphitic-N (401.4 eV).34 The appearance of the N signal confirms that the obtained CNTs were indeed doped with nitrogen during pyrolysis. Previous studies have clearly demonstrated that the conductivity of carbon materials is enhanced through N-doping, along with the introduction of active sites on the carbon based materials.50–52 However, the precise mechanism behind the effect of N atoms on the activity of such catalysts is still under debate, especially for water splitting. The deconvolution of the Ni 2p and Fe 2p spectra (Fig. 3c and d) suggests the presence of diverse chemically distinct species, namely the metallic states of Ni (853.2 and 870.8 eV) and Fe (707.3 and 720.2 eV), the oxidized states of Ni (854.7 and 872.2 eV), Fe2+ (710.6 and 723.4 eV), Fe3+ (713.3 and 726.2 eV), as well as the satellite peaks of Ni (860.3 and 879.2 eV) and Fe (715.3 and 731.3 eV).49 The oxidized states suggest that the surfaces of some alloys are slightly oxidized, probably by the adsorbed O2 species, as observed in other alloys encapsulated into graphene.53 The above-mentioned low signal strength of the Ni and Fe peaks provides further evidence that the NiFe alloys are completely encapsulated by CNTs. Moreover, energy dispersive X-ray spectroscopy (EDX) mapping indicates that NiFe signals only arise from the NiFe NPs and provided no clear signals on the surface of CNTs (Fig. 3e), further supporting the complete encapsulation of the NiFe alloys. Nitrogen EDX mapping of NiFe–N-CNT without rGO further demonstrates the good dispersion of N dopants on the CNTs (Fig. S15†).
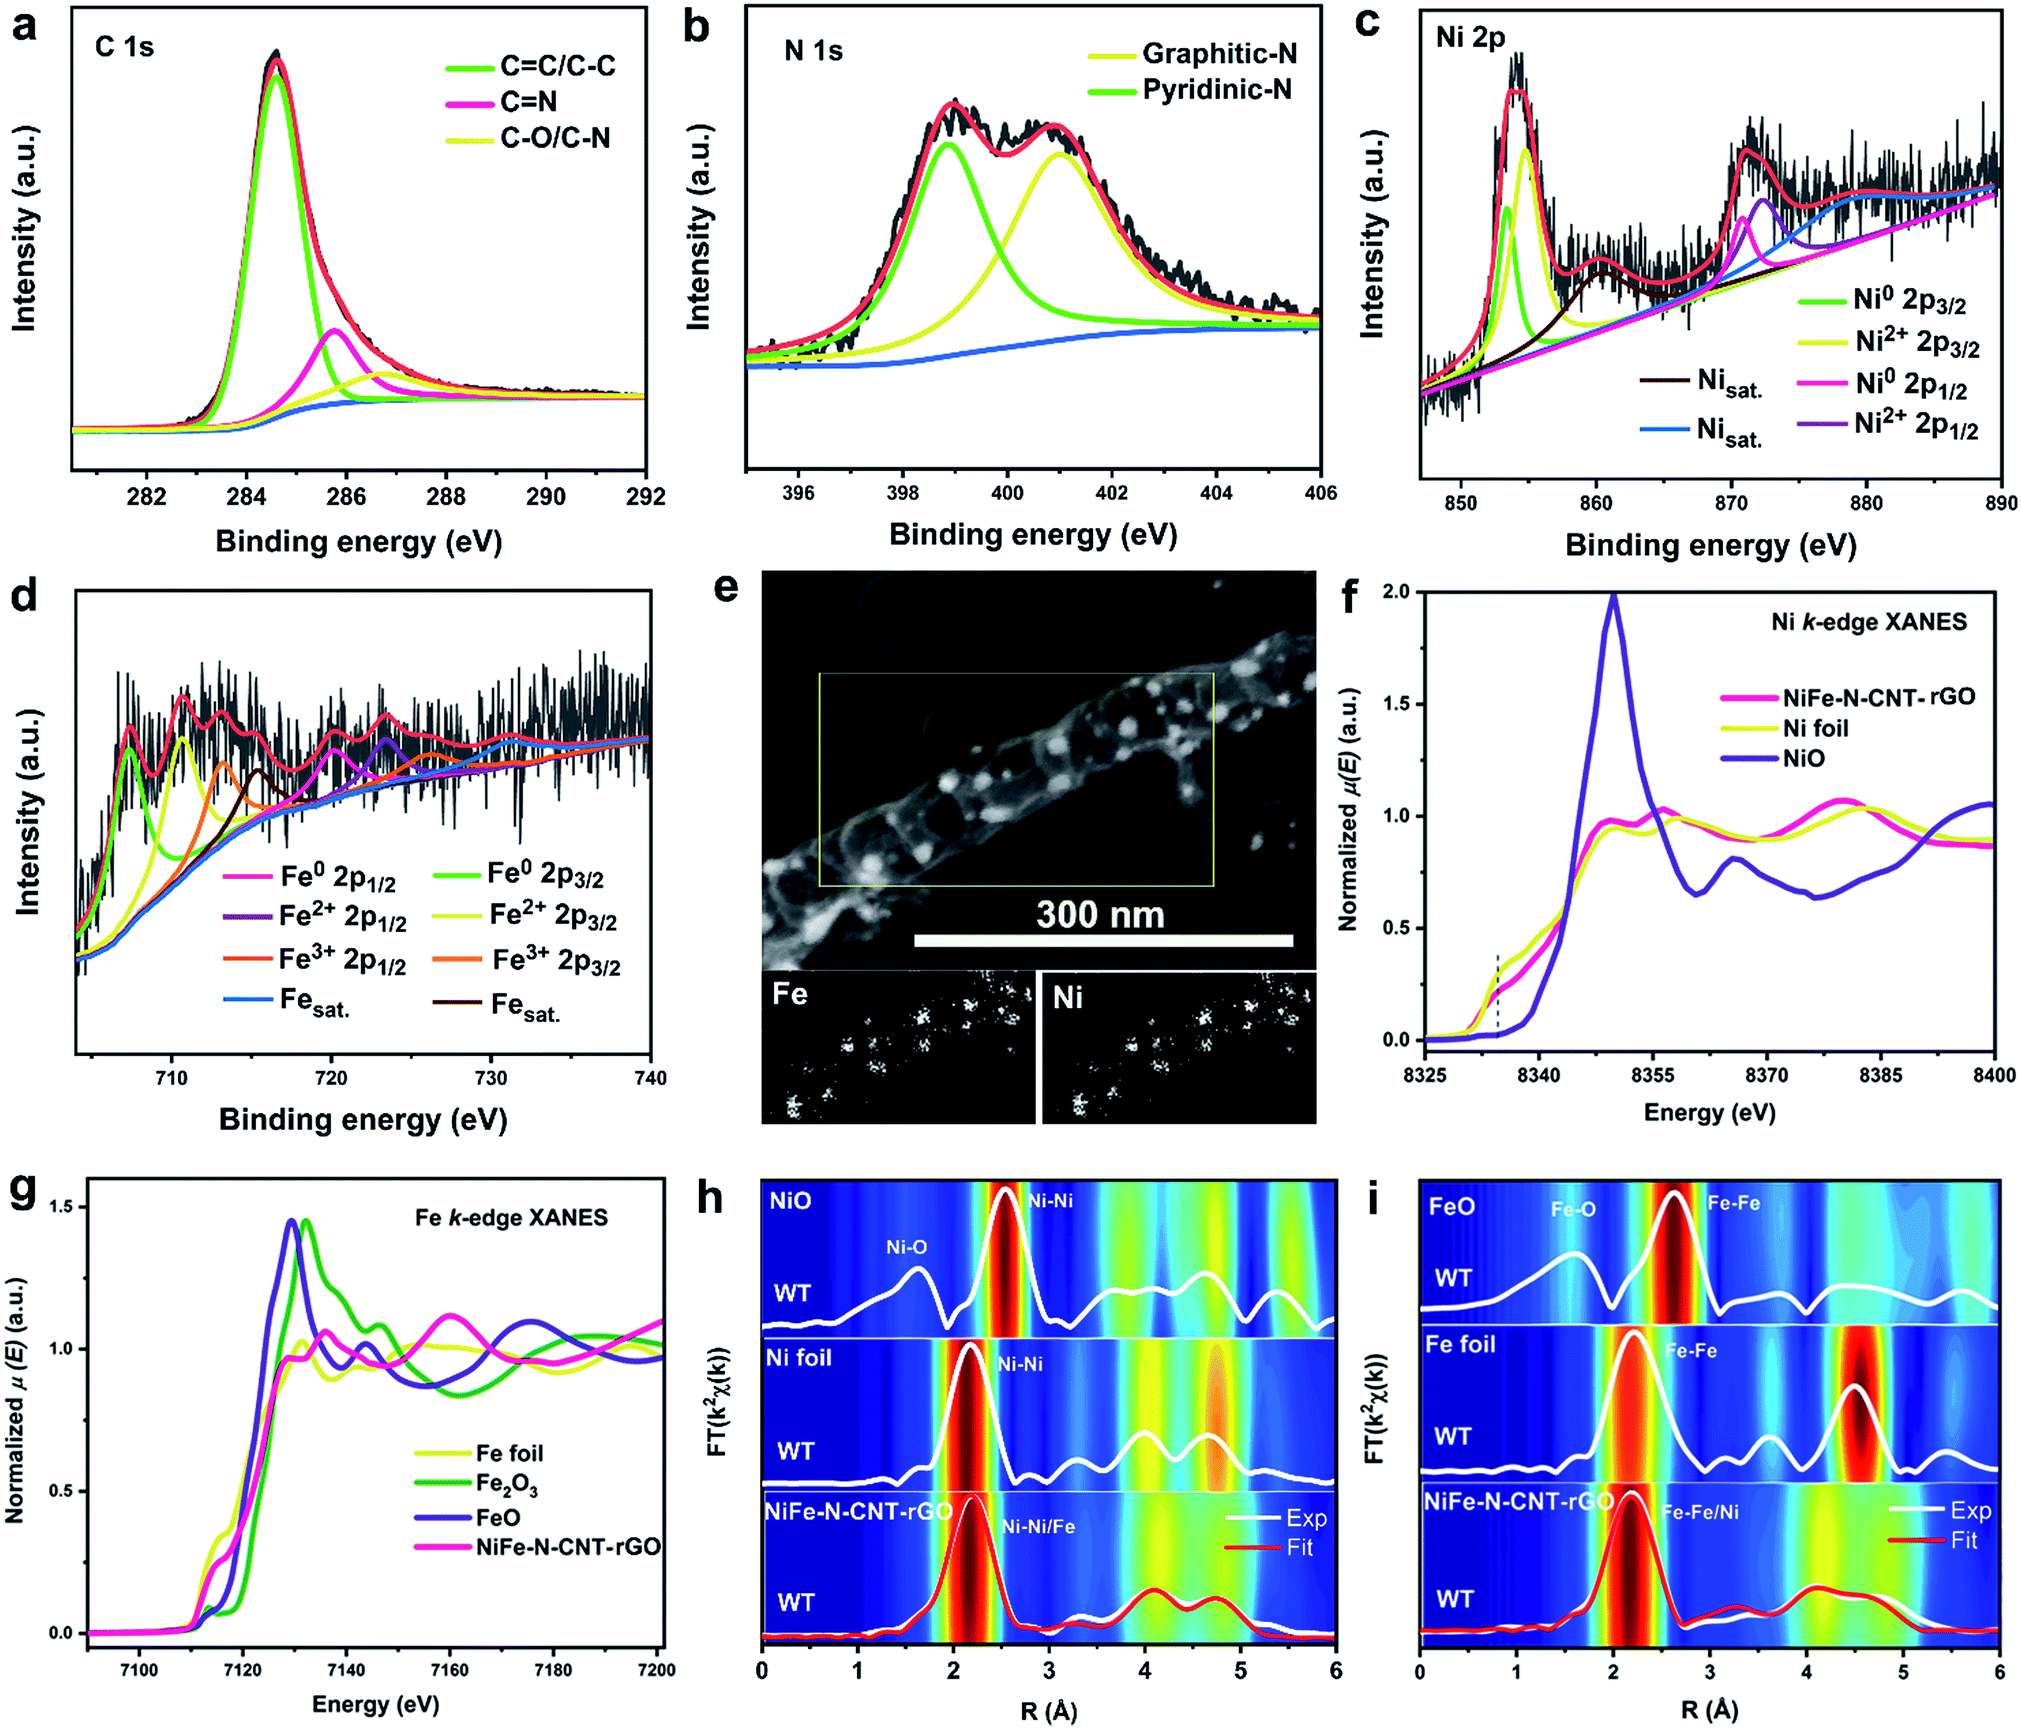 | ||
| Fig. 3 High-resolution XPS spectra of NiFe–N-CNT–rGO: (a) C 1s, (b) N 1s, (c) Ni 2p, and (d) Fe 2p. (e) Representative STEM image and EDX mappings of NiFe–N-CNT–rGO. (f and g) Ni and Fe K-edge XANES spectra of NiFe–N-CNT–rGO and reference samples. (h and i) Ni and Fe K-edge EXAFS spectra FT|k2χ(k)| of NiFe–N-CNT–rGO and reference samples. Fittings of the FT|k2χ(k)| spectra of NiFe–N-CNT–rGO are shown in red. The 2D contour plot in the background is the Wavelet-Transform (WT) of the EXAFS spectra k2χ(k) of NiFe–N-CNT–rGO and reference samples. | ||
X-ray absorption spectroscopy (XAS) was used to further evaluate the electronic and atomic-range structures of NiFe–N-CNT–rGO. As shown in Fig. 3f, the intensity of the pre-edge peak (at 8337.5 eV) in the Ni K-edge XANES spectra of NiFe–N-CNT–rGO decreases while the white line intensity (at 8350 eV) increases relative to the Ni foil, suggesting electronic hybridization between Ni and Fe.54 Moreover, both the XANES edge absorption energies, for the Ni-K-edge (at 8333 eV) and the Fe-K-edge (at 7112 eV), align with the same energy of Ni and Fe foils, which proves that most of Ni and Fe in NiFe–N-CNT–rGO are present in bulk metallic states (Fig. 3f and g). The absorption edges are slightly shifted toward higher energies compared to those of Ni and Fe foils. This is most likely due to the interaction between metal centers and CNTs, which is well in line with the border charge analysis in the following DFT calculations.
Further analyses of the Fourier- (FT) and Wavelet-Transforms (WT) of the Ni and Fe K-edge EXAFS spectra (Fig. 3h and i) show the oxide-free character of NiFe–N-CNT–rGO when compared to NiO and FeO references. The atomic-range structure is close to the structure of Ni foil. Nonlinear least-squares fitting of EXAFS spectra FT|k2χ(k)| yield calculated interatomic distances of Ni–Ni = 2.508(2) Å, Fe–Ni = 2.512(8) Å and Fe–Fe = 2.525(4) Å with Debye–Waller factors σNi–Ni2 = 0.008(1) Å2, σNi–Fe2 = 0.010(1) Å2 and σFe–Fe2 = 0.010(8) Å2, respectively. The broad feature in the FT|k2χ(k)| spectra between R = 2.9–5.2 Å corresponds to higher Ni(or-Fe)–Ni(or-Fe) core–shell interatomic distances between 3.514(7)–5.064(2) Å, respectively. For those higher core–shells the maxima in the WT spectra of NiFe–N-CNT–rGO (Fig. 3h and i), exhibit a slightly lowered intensity and broadening relative to the WT spectrum of Ni foil, suggesting small structural disorder induced by the insertion of Fe into the Ni lattice.
Electrocatalytic water splitting
The water splitting performance of the catalysts was evaluated using a standard three-electrode setup. (cf. ESI for details†). Bare GC was used as a reference. The influence of the ratio of Ni/Fe on the water splitting activity was investigated with a series of NiFe–N-CNT–rGO catalysts containing different Ni/Fe ratios. The results show that both OER and HER activity are improved with increasing Ni content up to a Ni/Fe ratio of 3:2. Further addition of Ni leads to a sharp decline of the performance (Fig. S16†). Optimization experiments of NiFe alloy and support indicated that the best activities for OER and HER are obtained for 4% wt of NiFe alloy (Fig. S17†). It is of note that the ratios mentioned here correspond to the starting materials of Ni2+, Fe3+, g-C3N4 and GO. The final mass fractions of NiFe determined by inductively coupled plasma mass spectrometry (ICP-MS) are 28.5 wt% and 32 wt% for NiFe–N-CNT–rGO and NiFe–N-CNT, respectively, due to the decomposition of g-C3N4 during pyrolysis (Table S9†). The result for NiFe–N-CNT is quite close to the TGA measurement (37 wt%) discussed above (Fig. S9†).
The influence of CNT and rGO on the water splitting activity was further studied by comparing the performance of bare NiFe alloy, NiFe–N-CNT and NiFe–N-CNT–rGO under the optimized conditions mentioned above (Fig. 4). The results show that both the OER and HER performance of NiFe alloy are significantly improved through its encapsulation into N-doped CNTs. Further addition of rGO sheets enhances the OER performance even more to 270 mV (at 10 mA cm−2) (Fig. 4a), thus rendering NiFe–N-CNT–rGO one of the most active catalysts for OER under comparable conditions as applied in recent reports (Table S11†).34,36,55–57 It is worth mentioning that the noise in the OER curves arise from the produced O2 bubbles that cannot be released quickly enough at higher potential. HER activity on the other hand, slightly decreases with the addition of rGO (Fig. 4d). Activities normalized to the catalyst mass can be found in Fig. S18.† However, both OER and HER activity of the catalyst containing unprotected NiFe NPs outside the CNTs are much lower than for NiFe–N-CNT, thereby providing further evidence that the encapsulated structure significantly improves the overall water splitting performance (Fig. S19†). We further conducted overall water splitting on Ni foam at the constant potential of 1.58 V (with a current density of 10 mA cm−2, Fig. S20 and Video in the ESI†). The data show that the NiFe–CNT–rGO catalyst shows a quite significant overall water splitting performance, indicating a promising scalable application potential.
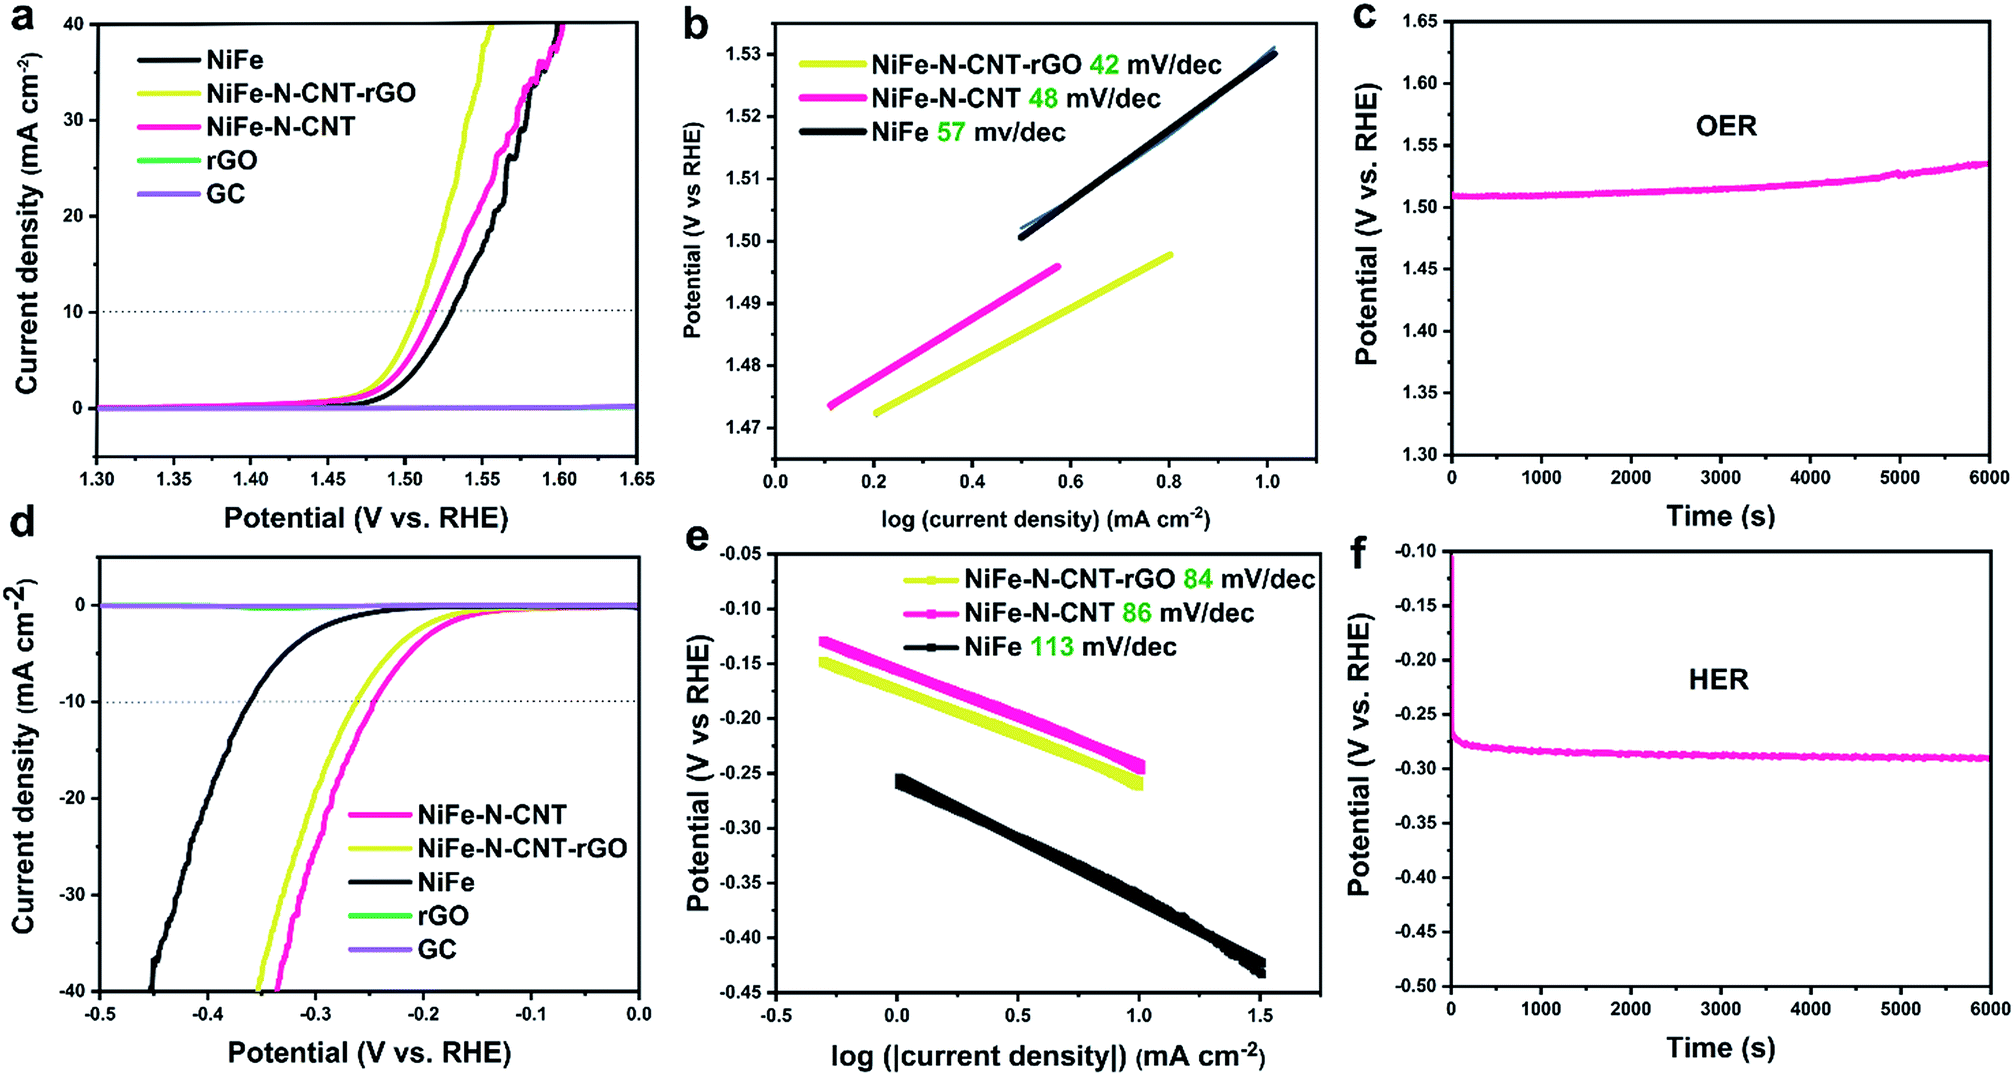 | ||
| Fig. 4 Electrocatalytic water-splitting activity of NiFe, NiFe–N-CNT, NiFe–N-CNT–rGO, bare rGO and GC. (a) LSV polarization curves for the OER. (b) Corresponding Tafel plots for the OER. (c) Chronopotentiometry test of NiFe–N-CNT–rGO for the OER at a current density of 10 mA cm−2. (d) LSV polarization curves for the HER. (e) Tafel plots for the HER. (f) Chronopotentiometry test of NiFe–N-CNT–rGO for the HER at a current density of 10 mA cm−2. | ||
To obtain additional insight into the reaction dynamics, the linear sections of Tafel plots were recorded at low potential. The Tafel slopes of the OER exhibit a similar trend compared to the LSV overpotentials. Most importantly, the value of 42 mV dec−1 for NiFe–N-CNT–rGO is much lower than those of most recently reported electrocatalysts,32,34,36,58,59 indicating the high ability of the encapsulated composite to drive the OER process. Tafel slopes of NiFe–N-CNT and NiFe–N-CNT–rGO for the HER are very similar (around 84 mV dec−1), but much lower than that of bare NiFe alloy, indicating that the addition of N-CNT and rGO could enhance the HER activity. Chronopotentiometry tests were then performed to evaluate the durability of the new catalysts. NiFe–N-CNT–rGO (OER) and NiFe–N-CNT (HER) could maintain a stable overpotential for 6000 s at an applied current density of 10 mA cm−2. The drop of the OER performance after 6000 s is probably due to the detachment of the catalyst caused by the bubble formation. We further performed long-term measurements on Ni foam as shown in Fig. S21a.† The current remains around 10 mA cm−2 for more than 63000 s under the same overpotential compared to measurements on GC. However, catalyst detachment is difficult to avoid under such high current density, leading to a slight drop of activity (Fig. S21c†).34 LSV curves measured on GC show almost no change before and after 1200 CV cycles, indicating that the catalyst is quite stable (Fig. S21b†). Post-catalytic SEM and TEM measurements (Fig. S22 and S23†) demonstrate that the catalysts still retain their morphology after electrocatalysis. Comparison of XANES spectra before and after catalysis (Fig. S24 and S25†) shows that only the Ni species in the catalyst were slightly oxidized after the OER reaction, while no obvious change was observed for the Fe species. This suggests that the Ni species are more active and probably contribute more strongly to electron transfer during the reaction.60–63
Analysis of further performance parameters
To analyze the beneficial combined influence of CNT, rGO and NiFe nanoparticles on the activity, Brunauer–Emmett–Teller (BET) surface area measurements were performed (Table S8†). The results show that the surface area of NiFe alloy (30 m2 g−1) is significantly increased upon encapsulation into N-doped CNT (129.9 m2 g−1). The addition of 2D rGO sheets further raises the surface area to 160.1 m2 g−1. The corresponding adsorption–desorption isotherms are presented in Fig. S26.† All samples exhibit type IV isotherms with H3 hysteresis loops, indicating the presence of mesoporous materials. This significant increase in surface area is clearly due to the special morphologies of 1D CNTs and 2D rGO. Furthermore, we analyzed the electrode kinetics of the three catalysts by electrochemical impedance spectroscopy (EIS) measurements (Fig. 7). The charge-transfer resistance values (Rct) that were determined from the semicircle recorded at low frequencies (high Z′) show that the hybrid catalysts combined with CNT and rGO display higher charge transport efficiency compared to bare rGO and NiFe alloy.Computational study of synergistic effects
To gain insights into the electronic structure of CNT–NiFe and NiFe–N-CNT, Bader charge population as well as charge density difference maps were analyzed through DFT calculations (cf. ESI for the details†). According to the Bader charge population analyses, there are −1.54e electrons transferring from NiFe to CNT, which results in the charge redistribution at the interface as shown in Fig. 5a. The free energies of the intermediates in each reaction step were simulated (Fig. 5b–e and S27†). For the HER reaction, the free energy of H* (ΔGH*) is generally considered as an effective descriptor to evaluate the HER activity, and smaller absolute values of ΔGH* correspond to better HER systems.32 The OER proceeds via a four-electron transfer process and the reaction barriers can be described by free energies of the intermediates on the active site.64–66 We here compared bare NiFe, CNT and NiFe–CNT to investigate the synergistic effect of CNT and NiFe nanoparticles. The results show that the adsorption energy of NiFe–CNT towards OH* and H* is located between bare CNT and NiFe, which indicates that the redistributed electronic structure of CNT layer can moderately modify the adsorption energy during water splitting. The calculated overpotentials of bare NiFe (2.64 V) and CNT (1.33 V) were significantly reduced after encapsulation of NiFe (1.08 V) (Fig. 5f, g and S28†). The same trend also applies to HER, where |ΔGH*| was reduced from 1.5 eV (CNT) and 0.5 eV (NiFe) to 0.3 eV (NiFe–CNT) (Fig. 5h). We further calculated the reaction barrier of the Volmer step for water splitting, which involves the dissociation of water (Table S6†).66 The results show that the adsorption energy of water over NiFe–CNT is lowest compared to CNT and NiFe, which agrees well with the descriptor of ΔGH*. Therefore, the improved activities can be attributed to the following two reasons: (i) increase of the specific surface area due to special morphologies, (ii) electron transfer from NiFe to CNT due to the different work functions and the redistributed electronic structure on the CNTs. The latter results in the modification of the adsorption free energies of the intermediates during the reaction.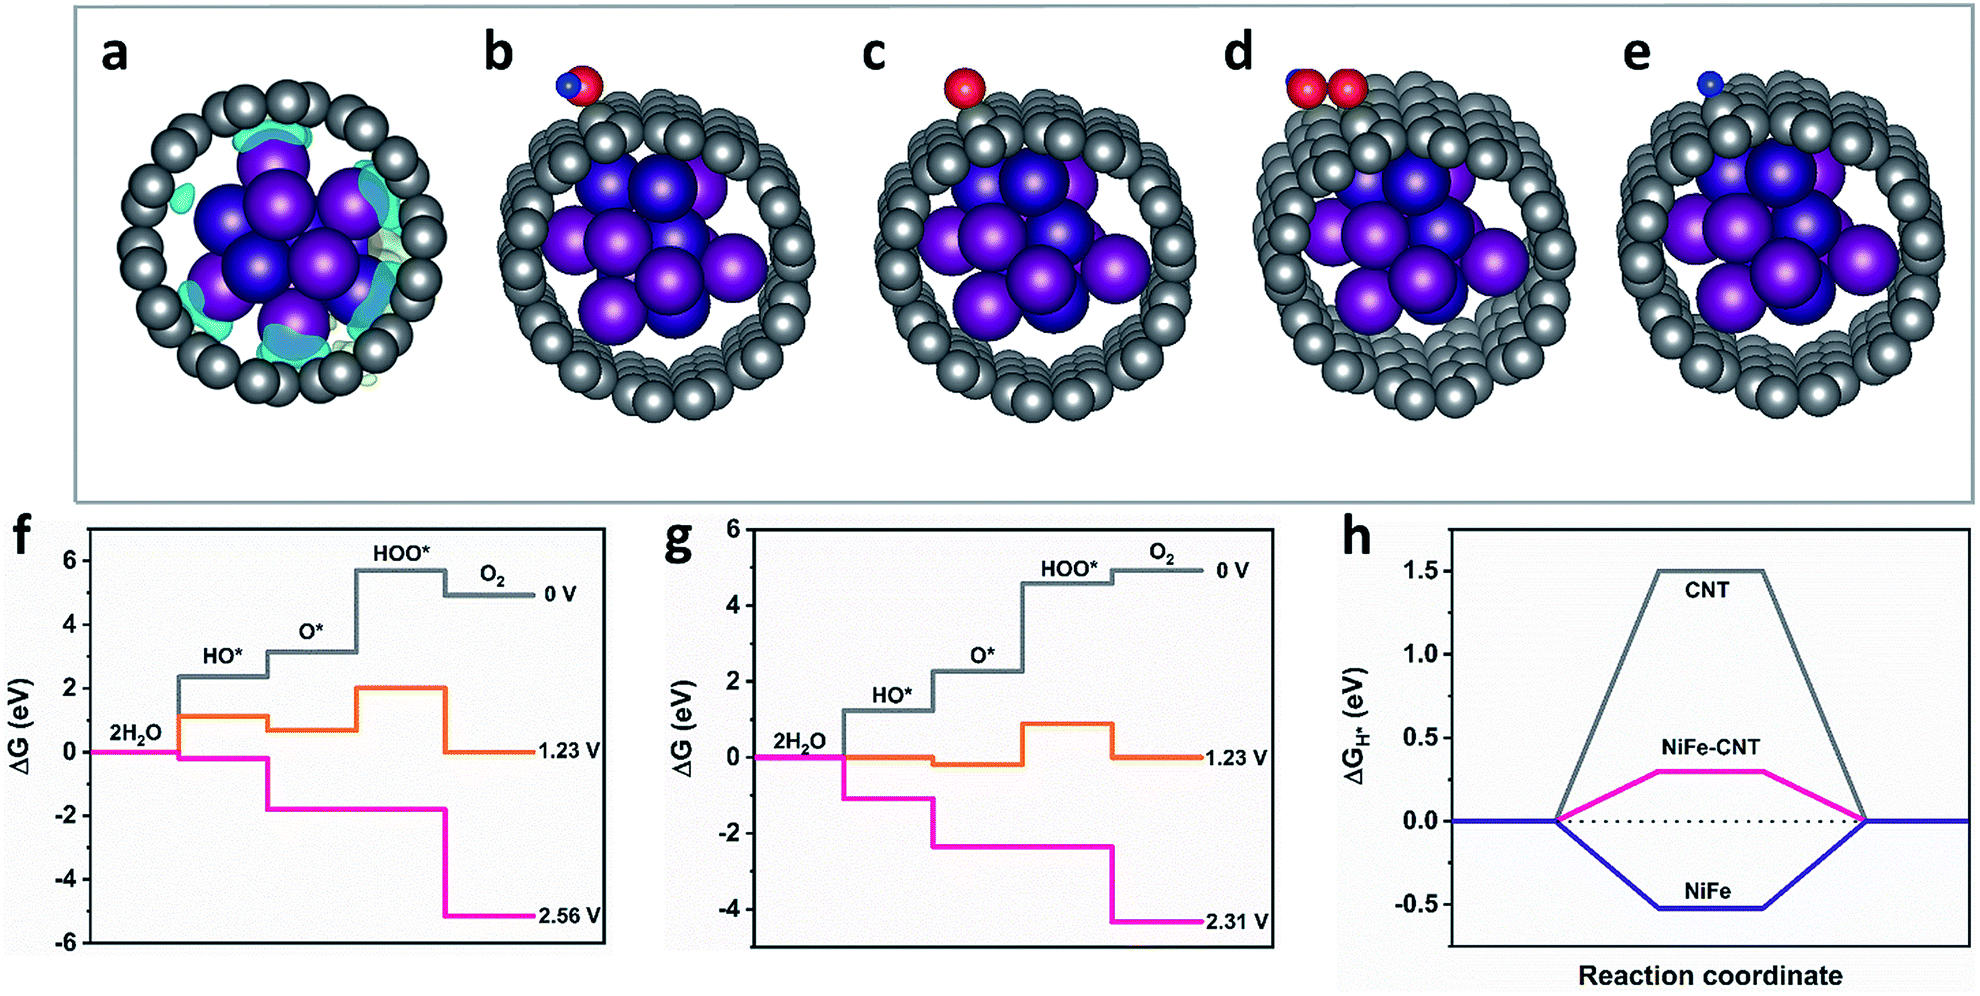 | ||
| Fig. 5 (a) Charge density difference map of CNT–NiFe. The gray, purple, deep purple, blue and red spheres represent C, Ni, Fe, H and O atoms, respectively. The yellow and blue areas represent electron accumulation and depletion with the same isosurface value of 0.002 electrons per Å3, respectively. (b–e) Optimized structures of OH*, O*, HOO* and H* adsorbed on CNT–NiFe. Free energy profiles for the OER over (f) pure CNT, (g) NiFe–CNT at zero potential (U = 0), equilibrium potential for oxygen evolution (U = 1.23 V), and minimal potential where all steps become downhill. (h) Calculated ΔGH* diagram of pure CNT, CNT encapsulated NiFe, and pure NiFe. | ||
Influence of nitrogen dopants on HER and OER activity
DFT calculations shed detailed light on the role of CNT and rGO in both OER and HER activity. However, the HER activity was slightly decreased after coupling with rGO layers, in contrast to their productive influence on the OER. Even though the addition of rGO increased the surface area of the catalyst, the nitrogen-free graphene sheets on the other hand might reduce the effective overall concentration of N dopants which are considered to act as active HER species.26,50,67,68 Therefore, we propose that the difference in HER and OER performance may be linked to the nitrogen atom concentration. To confirm this function of the N atoms, a series of catalysts with different nitrogen contents were obtained from syntheses conducted at 600, 700, 800, 900, 1000 and 1100 °C. Results from elemental analysis (Fig. 6c and Table S10†) clearly show that the N/C in the different samples significantly decreased from 0.37 to 0.015 when the temperature was raised from 600 to 1100 °C. However, the LSV polarization curves for the OER (Fig. 6a) displayed only slight changes for the temperature window between 700 °C and 1100 °C, corresponding to N/C ratios of 0.09 to 0.015. The results indicate that the OER is not sensitive to the N dopants when the N/C ratio is lower than 0.09. On the other hand, the HER overpotentials varied significantly for different N contents (Fig. 6b and d). The optimal N/C for HER is about 0.05 for an overpotential of 230 mV at 10 mA cm−2, which is in line with previous studies.26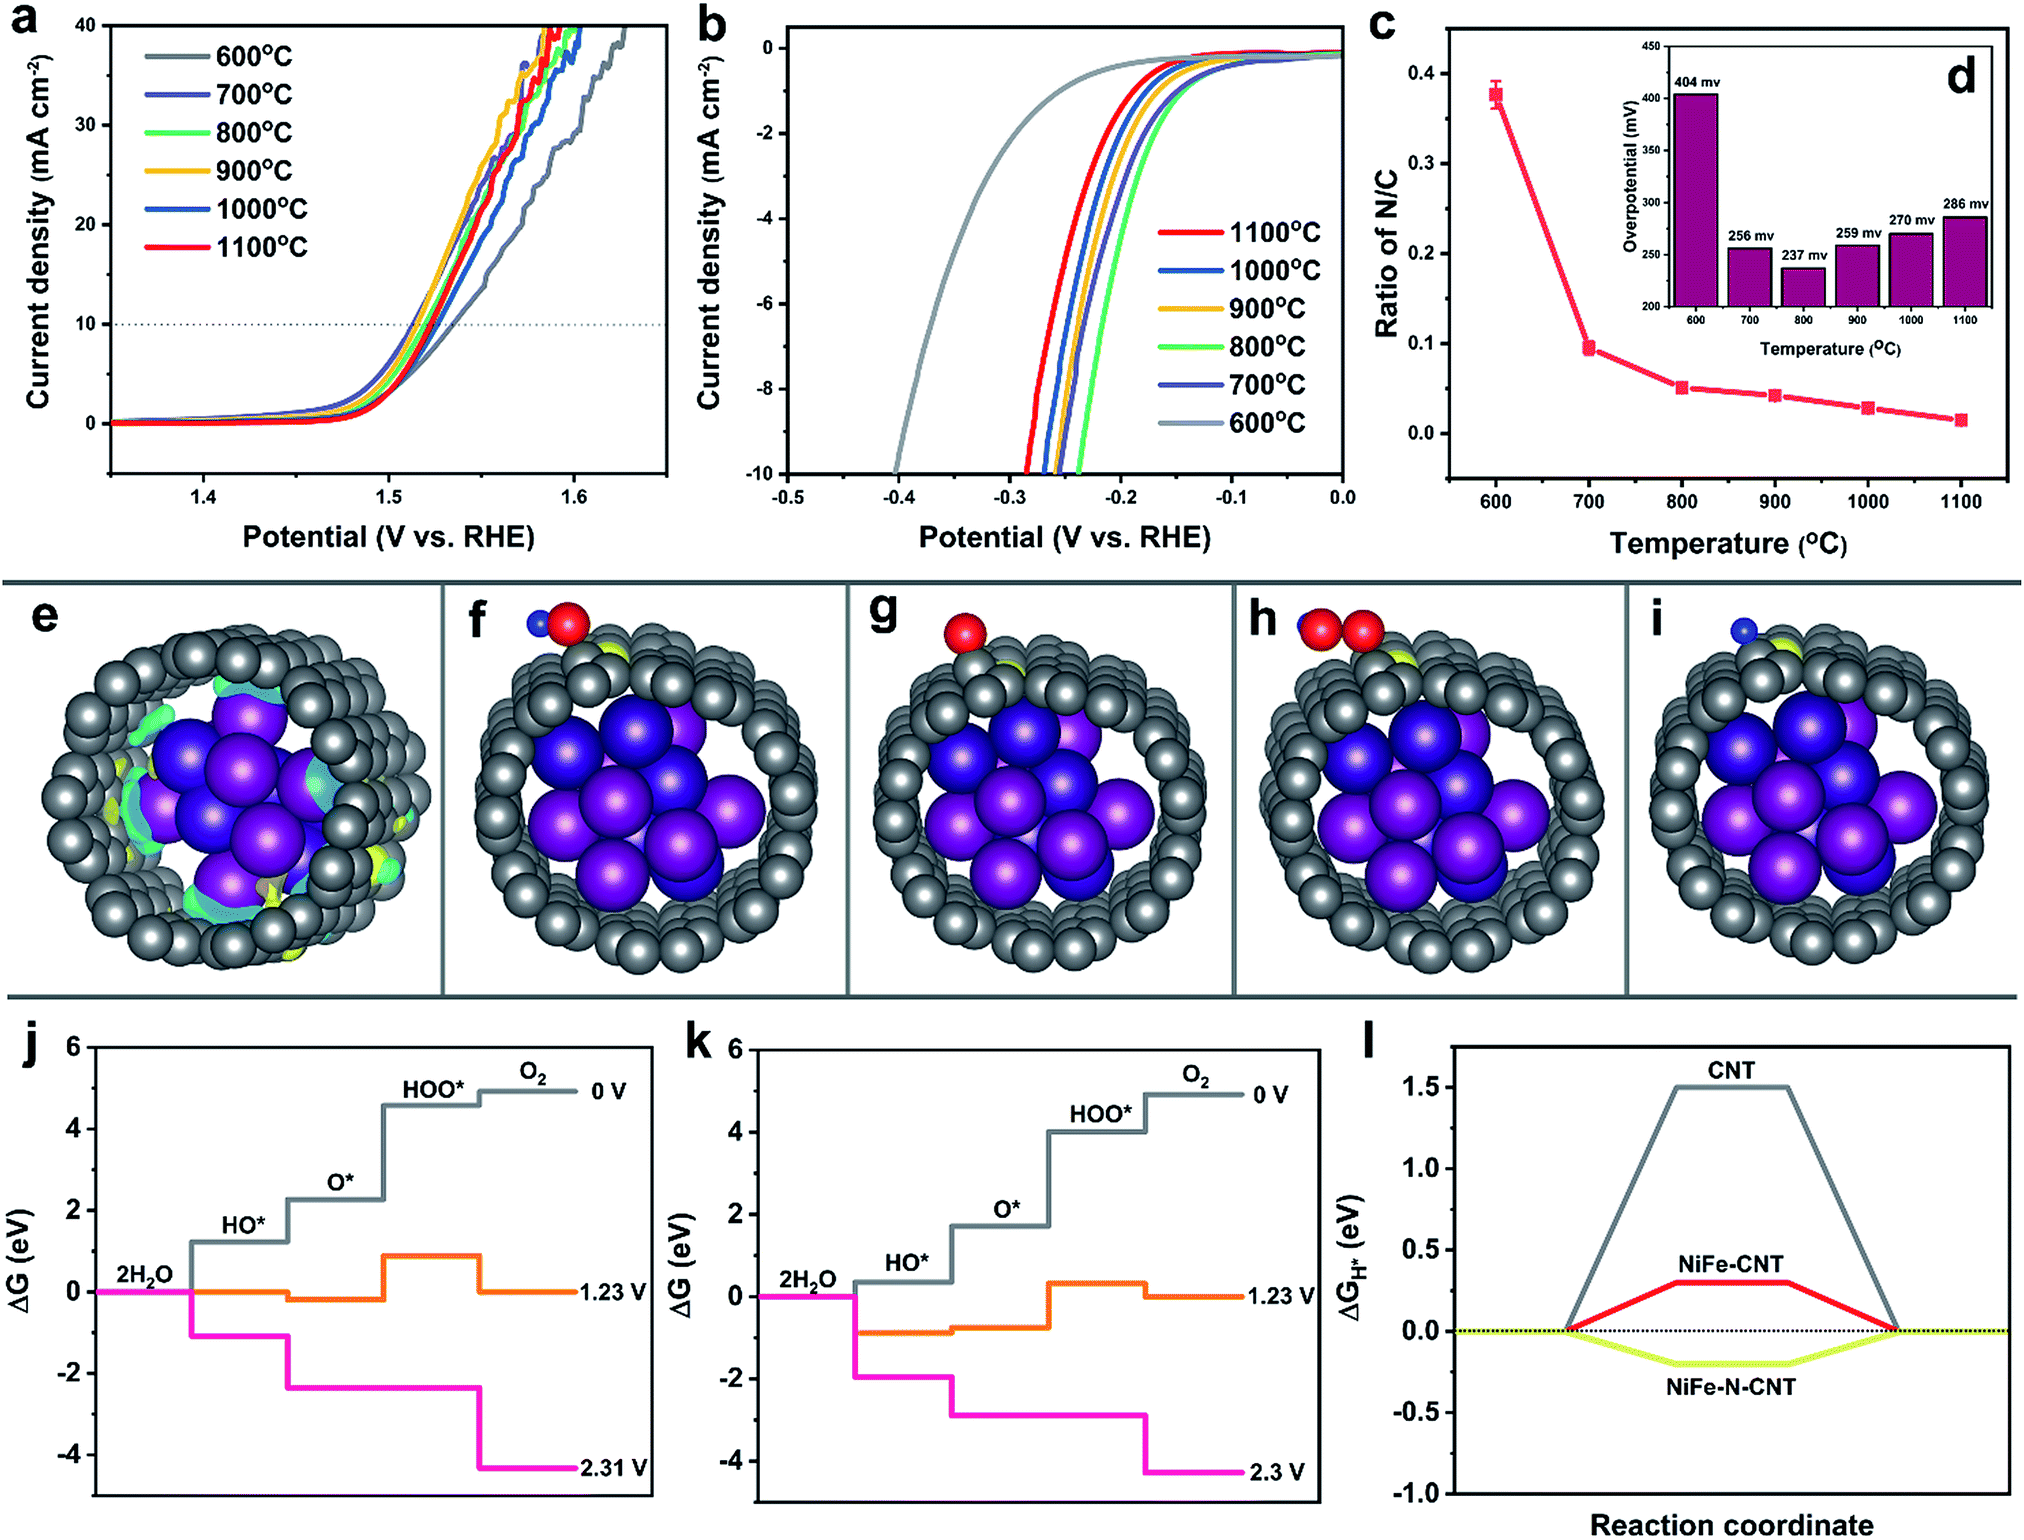 | ||
| Fig. 6 Electrocatalytic water splitting activity of NiFe–N-CNT catalysts with different N contents. (a) LSV polarization curves for the OER. (b) LSV polarization curves for the HER. (c) Corresponding N contents and (d) HER overpotentials for different synthesis temperatures. (e) Charge density difference map of N-doped CNT–NiFe. Optimized structures of (f) OH*, (g) O*, (h) HOO* and (i) H* adsorbed on nitrogen-doped CNT-encapsulated NiFe. (j) Free energy profiles for the OER over pure CNT encapsulated NiFe and (k) N-doped CNT encapsulated NiFe at zero potential (U = 0), equilibrium potential for oxygen evolution (U = 1.23 V), and minimal potential where all steps become downhill. (l) Calculated ΔGH* diagram of pure CNT, pure CNT encapsulated NiFe and N-doped CNT encapsulated NiFe. | ||
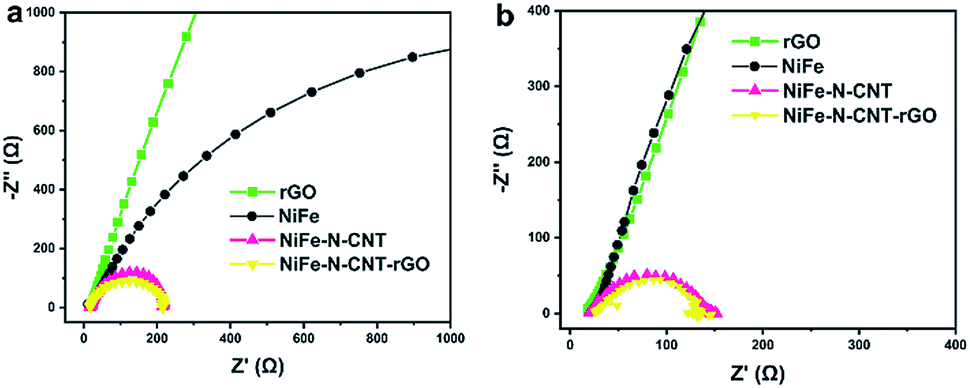 | ||
| Fig. 7 EIS measurements of the different catalysts for (a) OER and (b) HER at the potentials of 1.5 V and −0.3 V vs. RHE, respectively. | ||
To study the influence of N dopants on the activity in more detail, the energy changes on NiFe–CNT and NiFe–N-CNT for both OER and HER were modeled with DFT calculations. Before introducing the intermediates, we first calculated the electron transfer in NiFe–CNT and NiFe–N-CNT (Fig. 6e and S29†). The amount of charge transfer (Δq) is −1.54e and −1.60e for NiFe–CNT and NiFe–N-CNT, respectively, indicating that the residual nitrogen on the surface of the CNTs could indeed increase the interfacial charge transfer. The OER energy diagrams are shown in Fig. 6j and k, where free energies of HO*, O* and HOO* absorbed on neighboring C atoms of the N dopant on CNT were calculated (Fig. 6f and g). The results show that all reaction steps are endothermic at zero potential for both pure NiFe–CNT and N-doped NiFe–N-CNT. At equilibrium potential (1.23 V), some reaction steps become downhill. The overpotential for the OER is determined by all reaction steps becoming downhill in free energy.49,69 Interestingly, all the reaction steps turned downhill for both pure NiFe–CNT and NiFe–N-CNT for an applied potential of around 2.3 V, indicating that the calculated overpotentials for these two hybrid catalysts are quite close (1.07 V). Combined with the calculated overpotential of bare CNT and NiFe nanoparticles, we conclude that the OER is mainly dominated by the interaction of CNT and NiFe nanoparticles rather than by the N-dopants atoms. The resulting conclusion that nitrogen atoms exert less influence on the OER agrees well with previous studies.70
Consequently, the HER on pure CNT, pure NiFe–CNT and N-doped NiFe–N-CNT, respectively, was also simulated. H* was placed around the neighboring C atoms of the N-dopant on CNT, and after geometry optimization (Fig. 6i) ΔGH* was calculated.32,49,71 As shown in Fig. 6l, the ΔGH* of NiFe–CNT is significantly reduced from 1.5 eV to 0.3 eV compared with pure CNT. In addition, the introduction of N atoms further decreased ΔGH* to −0.2 eV in NiFe–N-CNT, demonstrating that N doping significantly reduces the adsorption energy of H*. Interestingly, the water dissociation step was also energetically more favorable with ΔGH2O decreasing from 0.52 eV to 0.13 eV after nitrogen introduction (Table S6†). The calculation results match well with the experiments shown in Fig. 6a and b and previous studies.72 All in all, the different OER and HER activities are caused by the special “M (Ni or Fe)–C–N” moiety. Generally, the electrons can be transferred from the NiFe alloy to the CNT layer to form a negatively charged environment on the surface. This thermodynamically suppresses the absorption of the H* and lone pair electrons of HO* compared to bare NiFe, as evident from previous calculations (Fig. 5f–h and S28†). However, the more electronegative nitrogen atoms doped on the CNT could capture electrons from their adjacent carbon atoms to form an unbalanced electric field between C and N atoms. For the OER, HO* is more likely to be adsorbed on C atoms (positively charged site) via its lone pair electrons. The unbalanced electric field caused by N dopants thus provides more adsorption sites for HO*, leading to a significant reduction of the free energy in the first reaction step compared to pure CNTs (Fig. 6j and k). However, the energy changes for the following reaction steps, especially from O* to HOO*, are less significant.73 Interestingly, the energy for the formation of O2 in the last step is even higher compared to pure NiFe–CNT, i.e. the strong adsorption also leads to more difficult desorption,73 so that the net influence on the final products is very limited. As the adsorption of H* is the only barrier for the HER, the influence of dopants on the adsorption of H* affects the final products much more strongly.
Conclusion
We successfully developed a direct and flexible strategy to fabricate NiFe catalysts encapsulated within a CNT architecture using readily available carbon nitride as precursor. Our study revealed the growth mechanism of the encapsulated composites and paved the way to the straightforward synthesis of other carbon-supported alloy catalysts. In particular, the oxygen production performance of NiFe alloy encapsulated into N-doped CNTs is very high at an overpotential of only 270 mV at 10 mA cm−2 when coupled with reduced graphene oxide. This is superior to most of the reported noble metal-free OER catalysts. A wide range of analytical techniques (e.g. XPS, XAS and EIS measurements) together with DFT calculations further demonstrated that the enhanced performance arises from the cooperative effects of increased surface area and efficient electron transport, along with the optimized electronic structure of the composites. N atoms doped on the CNT surface were shown to influence the adsorption of the intermediates in water splitting, with the most productive impact on the water reduction process. In summary, our results provide comprehensive and new strategies for both convenient fabrication and targeted design of economic high-performance water splitting catalysts.Conflicts of interest
There are no conflicts to declare.Acknowledgements
This work has been supported by the University of Zurich, the University Research Priority Program (URPP) for Solar Light to Chemical Energy Conversion (LightChEC) and by the Swiss National Science Foundation (Sinergia Grant No. CRSII2_160801/1). W. Wan thanks the China Scholarship Council (CSC) for his PhD fellowship. We thank Ms Viviane Grange (UZH) for elemental analysis measurements and Dr Hermann Emerich (ESRF Grenoble) for beamline support.References
- N.-T. Suen, S.-F. Hung, Q. Quan, N. Zhang, Y.-J. Xu and H. M. Chen, Chem. Soc. Rev., 2017, 46, 337 RSC.
- X. Zheng, B. Zhang, P. de Luna, Y. Liang, R. Comin, O. Voznyy, L. Han, F. P. García de Arquer, M. Liu, C. T. Dinh, T. Regier, J. J. Dynes, S. He, H. L. Xin, H. Peng, D. Prendergast, X. Du and E. H. Sargent, Nat. Chem., 2018, 10, 149 CrossRef CAS.
- Y. Zhao, X. Zhang, X. Jia, G. I. N. Waterhouse, R. Shi, X. Zhang, F. Zhan, Y. Tao, L.-Z. Wu, C.-H. Tung, D. O'Hare and T. Zhang, Adv. Energy Mater., 2018, 8, 1703585 CrossRef.
- P. W. Menezes, C. Panda, S. Loos, F. Bunschei-Bruns, C. Walter, M. Schwarze, X. Deng, H. Dau and M. Driess, Energy Environ. Sci., 2018, 11, 1287 RSC.
- J. Li, R. Güttinger, R. Moré, F. Song, W. Wan and G. R. Patzke, Chem. Soc. Rev., 2017, 46, 6124 RSC.
- K. Liu, H. Zhong, F. Meng, X. Zhang, J. Yan and Q. Jiang, Mater. Chem. Front., 2017, 1, 2155 RSC.
- F. Yu, H. Zhou, Y. Huang, J. Sun, F. Qin, J. Bao, W. A. Goddard, S. Chen and Z. Ren, Nat. Commun., 2018, 9, 2551 CrossRef PubMed.
- I. Roger, M. A. Shipman and M. D. Symes, Nat. Rev. Chem., 2017, 1, 3 CrossRef CAS.
- L. Duan, F. Bozoglian, S. Mandal, B. Stewart, T. Privalov, A. Llobet and L. Sun, Nat. Chem., 2012, 4, 41 CrossRef.
- J. Wang, W. Cui, Q. Liu, Z. Xing, A. M. Asiri and X. Sun, Adv. Mater., 2016, 28, 215 CrossRef CAS PubMed.
- S. Anantharaj, S. R. Ede, K. Sakthikumar, K. Karthick, S. Mishra and S. Kundu, ACS Catal., 2016, 6, 8069 CrossRef CAS.
- L. Reith, K. Lienau, D. S. Cook, R. Moré, R. I. Walton and G. R. Patzke, Chem.–Eur. J., 2018, 24, 18424 CrossRef CAS.
- J. Yang, K. Walczak, E. Anzenberg, F. M. Toma, G. Yuan, J. Beeman, A. Schwartzberg, Y. Lin, M. Hettick, A. Javey, J. W. Ager, J. Yano, H. Frei and I. D. Sharp, J. Am. Chem. Soc., 2014, 136, 6191–6194 CrossRef CAS PubMed.
- N. Shi, W. Cheng, H. Zhou, T. Fan and M. Niederberger, Chem. Commun., 2015, 51, 1338 RSC.
- K. Fan, H. Zou, Y. Lu, H. Chen, F. Li, J. Liu, L. Sun, L. Tong, M. F. Toney, M. Sui and J. Yu, ACS Nano, 2018, 12, 12369 CrossRef CAS.
- R. J. Müller, J. Lan, K. Lienau, R. Moré, C. A. Triana, M. Iannuzzi and G. R. Patzke, Dalton Trans., 2018, 47, 10759 RSC.
- C. Ray, S. C. Lee, B. Jin, A. Kundu, J. H. Park and S. Chan Jun, J. Mater. Chem. A, 2018, 6, 4466 RSC.
- I. K. Mishra, H. Zhou, J. Sun, F. Qin, K. Dahal, J. Bao, S. Chen and Z. Ren, Energy Environ. Sci., 2018, 11, 2246 RSC.
- C. Tang, R. Zhang, W. Lu, L. He, X. Jiang, A. M. Asiri and X. Sun, Adv. Mater., 2017, 29, 1602441 CrossRef PubMed.
- X. Zou and Y. Zhang, Chem. Soc. Rev., 2015, 44, 5148 RSC.
- G.-F. Chen, T. Y. Ma, Z.-Q. Liu, N. Li, Y.-Z. Su, K. Davey and S.-Z. Qiao, Adv. Funct. Mater., 2016, 26, 3314 CrossRef CAS.
- L. Han, S. Dong and E. Wang, Adv. Mater., 2016, 28, 9266 CrossRef CAS PubMed.
- J. Deng, D. Deng and X. Bao, Adv. Mater., 2017, 29, 1606967 CrossRef PubMed.
- Y. Liu, H. Jiang, Y. Zhu, X. Yang and C. Li, J. Mater. Chem. A, 2016, 4, 1694 RSC.
- L. Yang, Y. Lv and D. Cao, J. Mater. Chem. A, 2018, 6, 3926 RSC.
- X. Zou, X. Huang, A. Goswami, R. Silva, B. R. Sathe, E. Mikmeková and T. Asefa, Angew. Chem., Int. Ed., 2014, 126, 4461 CrossRef.
- M. Tavakkoli, T. Kallio, O. Reynaud, A. G. Nasibulin, C. Johans, J. Sainio, H. Jiang, E. I. Kauppinen and K. Laasonen, Angew. Chem., Int. Ed., 2015, 127, 4618 CrossRef.
- J. Y. C. Chen, L. Dang, H. Liang, W. Bi, J. B. Gerken, S. Jin, E. E. Alp and S. S. Stahl, J. Am. Chem. Soc., 2015, 137, 15090 CrossRef CAS.
- M. Görlin, J. Ferreira de Araújo, H. Schmies, D. Bernsmeier, S. Dresp, M. Gliech, Z. Jusys, P. Chernev, R. Kraehnert, H. Dau and P. Strasser, J. Am. Chem. Soc., 2017, 139, 2070 CrossRef PubMed.
- Y. Shen, Y. Zhou, D. Wang, X. Wu, J. Li and J. Xi, Adv. Energy Mater., 2018, 8, 1701759 CrossRef.
- D. Deng, L. Yu, X. Chen, G. Wang, L. Jin, X. Pan, J. Deng, G. Sun and X. Bao, Angew. Chem., Int. Ed., 2013, 52, 371 CrossRef CAS PubMed.
- X. Zhang, C. Li, T. Si, H. Lei, C. Wei, Y. Sun, T. Zhan, Q. Liu and J. Guo, ACS Sustainable Chem. Eng., 2018, 6, 8266 CrossRef CAS.
- (a) Y. Xu, W. Tu, B. Zhang, S. Yin, Y. Huang, M. Kraft and R. Xu, Adv. Mater., 2017, 29, 1605957 CrossRef PubMed; (b) J. Su, Y. Yang, G. Xia, J. Chen, P. Jiang and Q. Chen, Nat. Commun., 2017, 8, 14969 CrossRef.
- X. Zhang, H. Xu, X. Li, Y. Li, T. Yang and Y. Liang, ACS Catal., 2016, 6, 580 CrossRef CAS.
- Y. Pan, K. Sun, S. Liu, X. Cao, K. Wu, W.-C. Cheong, Z. Chen, Y. Wang, Y. Li, Y. Liu, D. Wang, Q. Peng, C. Chen and Y. Li, J. Am. Chem. Soc., 2018, 140, 2610 CrossRef CAS PubMed.
- X. Cui, P. Ren, D. Deng, J. Deng and X. Bao, Energy Environ. Sci., 2016, 9, 123 RSC.
- X. Li, X. Huang, S. Xi, S. Miao, J. Ding, W. Cai, S. Liu, X. Yang, H. Yang, J. Gao, J. Wang, Y. Huang, T. Zhang and B. Liu, J. Am. Chem. Soc., 2018, 140, 12469 CrossRef CAS PubMed.
- X. Li, W. Bi, M. Chen, Y. Sun, H. Ju, W. Yan, J. Zhu, X. Wu, W. Chu, C. Wu and Y. Xie, J. Am. Chem. Soc., 2017, 139, 14889 CrossRef CAS PubMed.
- (a) S. Yin, W. Tu, Y. Sheng, Y. Du, M. Kraft, A. Borgna and R. Xu, Adv. Mater., 2018, 30, 1705106 CrossRef PubMed; (b) Y. Jia, L. Zhang, G. Gao, H. Chen, B. Wang, J. Zhou, M. T. Soo, M. Hong, X. Yan, G. Qian, J. Zou, A. Du and X. Yao, Adv. Mater., 2017, 29, 1700017 CrossRef PubMed.
- (a) S. Pei and H. Cheng, Carbon, 2012, 50, 3210 CrossRef CAS; (b) W. Wan, R. Zhang, W. Li, H. Liu, Y. Lin, L. Li and Y. Zhou, Environ. Sci.: Nano, 2016, 3, 107 RSC; (c) W. Wan, F. Zhang, S. Yu, R. Zhang and Y. Zhou, New J. Chem., 2016, 40, 3040 RSC.
- M. Tavakkoli, T. Kallio, O. Reynaud, A. G. Nasibulin, C. Johans, J. Sainio, H. Jiang, E. I. Kauppinen and K. Laasonen, Angew. Chem., Int. Ed., 2015, 127, 4618 CrossRef.
- Y. Yang, Z. Lun, G. Xia, F. Zheng, M. He and Q. Chen, Energy Environ. Sci., 2015, 8, 3563 RSC.
- N. S. Kim, Y. T. Lee, J. Park, J. B. Han, Y. S. Choi, S. Y. Choi, J. Choo and G. H. Lee, J. Phys. Chem. B, 2003, 107, 9249 CrossRef CAS.
- N. S. Kim, Y. T. Lee, J. Park, H. Ryu, H. J. Lee, S. Y. Choi and J. Choo, J. Phys. Chem. B, 2002, 106, 9286 CrossRef CAS.
- E. Hu, X.-Y. Yu, F. Chen, Y. Wu, Y. Hu and X. W. D. Lou, Adv. Energy Mater., 2018, 8, 1702476 CrossRef.
- L. Yang, D. Cheng, H. Xu, X. Zeng, X. Wan, J. Shui, Z. Xiang and D. Cao, Proc. Natl. Acad. Sci. U. S. A., 2018, 115, 6626 CrossRef CAS PubMed.
- X. Zhao, P. Pachfule, S. Li, J. R. J. Simke, J. Schmidt and A. Thomas, Angew. Chem., Int. Ed., 2018, 57, 8921 CrossRef CAS PubMed.
- Y. Yang, L. Dang, M. J. Shearer, H. Sheng, W. Li, J. Chen, P. Xiao, Y. Zhang, R. J. Hamers and S. Jin, Adv. Energy Mater., 2018, 8, 1703189 CrossRef.
- Y. Yang, Z. Lin, S. Gao, J. Su, Z. Lun, G. Xia, J. Chen, R. Zhang and Q. Chen, ACS Catal., 2016, 7, 469 CrossRef.
- Y. Hou, Z. Wen, S. Cui, S. Ci, S. Mao and J. Chen, Adv. Funct. Mater., 2015, 25, 872 CrossRef CAS.
- J. Liang, Y. Jiao, M. Jaroniec and S. Z. Qiao, Angew. Chem., Int. Ed., 2012, 51, 11496 CrossRef CAS PubMed.
- J. Zhang and L. Dai, Angew. Chem., Int. Ed., 2016, 128, 13490 CrossRef.
- D. Bin, B. Yang, C. Li, Y. Liu, X. Zhang, Y. Wang and Y. Xia, ACS Appl. Mater. Interfaces, 2018, 10, 26178 CrossRef CAS.
- L. Du, L. Luo, Z. Feng, M. Engelhard, X. Xie, B. Han, J. Sun, J. Zhang, G. Yin, C. Wang, Y. Wang and Y. Shao, Nano Energy, 2017, 39, 245 CrossRef CAS.
- S. Zhao, M. Li, M. Han, D. Xu, J. Yang, Y. Lin, N.-E. Shi, Y. Lu, R. Yang, B. Liu, Z. Dai and J. Bao, Adv. Funct. Mater., 2017, 44, 1706018 Search PubMed.
- C. Tang, H.-S. Wang, H.-F. Wang, Q. Zhang, G.-L. Tian, J.-Q. Nie and F. Wei, Adv. Mater., 2015, 27, 4516 CrossRef CAS.
- Y. Fan, S. Ida, A. Staykov, T. Akbay, H. Hagiwara, J. Matsuda, K. Kaneko and T. Ishihara, Small, 2017, 13, 1700099 CrossRef PubMed.
- S. Ci, S. Mao, Y. Hou, S. Cui, H. Kim, R. Ren, Z. Wen and J. Chen, J. Mater. Chem. A, 2015, 3, 7986 RSC.
- M. Gong and H. Dai, Nano Res., 2015, 8, 23 CrossRef CAS.
- X. Su, Y. Wang, J. Zhou, S. Gu, J. Li and S. Zhang, J. Am. Chem. Soc., 2018, 140, 11286 CrossRef CAS PubMed.
- J. Zhang, J. Liu, L. Xi, Y. Yu, N. Chen, S. Sun, W. Wang, K. M. Lange and B. Zhang, J. Am. Chem. Soc., 2018, 140, 3876 CrossRef CAS PubMed.
- S. Klaus, Y. Cai, M. W. Louie, L. Trotochaud and A. T. Bell, J. Phys. Chem. C, 2015, 119, 7243 CrossRef CAS.
- D. Friebel, M. W. Louie, M. Bajdich, K. E. Sanwald, Y. Cai, A. M. Wise, M.-J. Cheng, D. Sokaras, T.-C. Weng, R. Alonso-Mori, R. C. Davis, J. R. Bargar, J. K. Nørskov, A. Nilsson and A. T. Bell, J. Am. Chem. Soc., 2015, 137, 1305 CrossRef CAS PubMed.
- J. K. Nørskov, J. Rossmeisl, A. Logadottir, L. Lindqvist, J. R. Kitchin, T. Bligaard and H. Jónsson, J. Phys. Chem. B, 2004, 108, 17886 CrossRef.
- L.-L. Feng, G. Yu, Y. Wu, G.-D. Li, H. Li, Y. Sun, T. Asefa, W. Chen and X. Zou, J. Am. Chem. Soc., 2015, 137, 14023 CrossRef CAS PubMed.
- (a) J. Huang, Y. Sun, Y. Zhang, G. Zou, C. Yan, S. Cong, T. Lei, X. Dai, J. Guo, R. Lu, Y. Li and J. Xiong, Adv. Mater., 2018, 30, 1705045 CrossRef PubMed; (b) J. Zhang, T. Wang, P. Liu, S. Liu, R. Dong, X. Zhuang, M. Chen and X. Feng, Energy Environ. Sci., 2016, 9, 2789 RSC.
- W. Zhou, J. Zhou, Y. Zhou, J. Lu, K. Zhou, L. Yang, Z. Tang, L. Li and S. Chen, Chem. Mater., 2015, 27, 2026 CrossRef CAS.
- C. H. Choi, H.-K. Lim, M. W. Chung, J. C. Park, H. Shin, H. Kim and S. I. Woo, J. Am. Chem. Soc., 2014, 136, 9070 CrossRef CAS PubMed.
- Á. Valdés, Z.-W. Qu, G.-J. Kroes, J. Rossmeisl and J. K. Nørskov, J. Phys. Chem. C, 2008, 112, 9872 CrossRef.
- Y. Liang, Y. Li, H. Wang, J. Zhou, J. Wang, T. Regier and H. Dai, Nat. Mater., 2011, 10, 780 CrossRef CAS PubMed.
- J. Deng, P. Ren, D. Deng and X. Bao, Angew. Chem., Int. Ed., 2015, 54, 2100 CrossRef CAS PubMed.
- H. Fei, J. Dong, M. J. Arellano-Jiménez, G. Ye, N. Dong Kim, E. L. G. Samuel, Z. Peng, Z. Zhu, F. Qin, J. Bao, M. J. Yacaman, P. M. Ajayan, D. Chen and J. M. Tour, Nat. Commun., 2015, 6, 8668 CrossRef CAS PubMed.
- F. Razmjooei, K. P. Singh, D.-S. Yang, W. Cui, Y. H. Jang and J.-S. Yu, ACS Catal., 2017, 7, 2381 CrossRef CAS.
Footnote |
| † Electronic supplementary information (ESI) available. See DOI: 10.1039/c9ta03213d |
| This journal is © The Royal Society of Chemistry 2019 |