
Correlating lattice distortions, ion migration barriers, and stability in solid electrolytes†
Kwangnam
Kim
 a and
Donald J.
Siegel
*abcd
a and
Donald J.
Siegel
*abcd
aMechanical Engineering Department, University of Michigan, Ann Arbor, Michigan 48109-2125, USA. E-mail: djsiege@umich.edu; Tel: +1 (734) 764 4808
bMaterials Science & Engineering, University of Michigan, Ann Arbor, Michigan 48109-2125, USA
cApplied Physics Program, University of Michigan, Ann Arbor, Michigan 48109-2125, USA
dUniversity of Michigan Energy Institute, University of Michigan, Ann Arbor, Michigan 48109-2125, USA
First published on 15th January 2019
Abstract
The emergence of solid electrolytes with ionic conductivities comparable to that of liquids has improved the prospects for realizing solid-state batteries. Although a small number of ionically-conducting solids are now known, most exhibit shortcomings such as limited interfacial stability and susceptibility to dendrite penetration. Consequently, the discovery of alternative solid electrolytes remains an important goal. This search has been slowed, however, by incomplete understanding of the elementary chemical and structural features that give rise to high ionic mobility. Here we characterize the atomic-scale connections between mobility, thermodynamic stability, and lattice distortions. The degree of lattice distortion, described by the tolerance factor, t, was systematically varied via isovalent composition variation across a series of model anti-perovskite ion conductors. Larger distortions are observed to correlate strongly with lower energy barriers for percolating ion migration: distortions suppress corrugations of the potential energy surface by widening a subset of migration channels and by destabilizing equilibrium configurations. As larger distortions also correlate with reduced stability, realizing high ionic mobility in this class of conductors requires balancing a mobility/stability tradeoff. Na3SI is identified as one such balanced material.
Introduction
Li-ion batteries are widely used in portable devices due to their higher energy densities relative to competing battery chemistries. Nevertheless, additional improvements in the performance of these batteries are being driven by emerging applications such as electric vehicles, which place greater demands upon the performance of the energy storage system.1Enhanced safety is one of the most sought-after performance improvements. Safety limitations in Li-ion batteries can originate from the use of liquid electrolytes. These electrolytes have high ionic conductivity, yet are volatile and flammable; moreover, they are amenable to dendrite formation, resulting in internal short-circuiting.2,3 In principle, the use of a solid electrolyte (SE) can circumvent these problems.1,4–6 Furthermore, SEs present the possibility of using metallic Li as the anode, in place of intercalated carbon.7 This substitution is projected to significantly increase energy density.5
Historically, the ionic conductivity of solids has been insufficient to supplant liquid electrolytes. Very recently, however, a small-but-growing number of solids with ionic conductivities comparable to that of liquids have been identified (Li7La3Zr2O12, Li10GeP2S12, etc.).8–14 The discovery of these fast ion conductors has advanced the prospects for realizing solid-state batteries.3,15 Nevertheless, additional study of these materials has, in essentially all cases, unearthed other shortcomings (stability, Li penetration, etc.), suggesting that the discovery of alternative SE remains an important pursuit.
A fundamental question in the identification of new SEs is ‘what chemical, mechanical, and/or structural features promote high ion mobility?’16–19 Here we hypothesize that distortions of a solid's crystal structure are one such feature. These distortions include tilting/rotations of a crystal's polyhedral building blocks (octahedra, tetrahedra, etc.), variations in the length of the bonds that comprise these units, and a lowering of the crystalline (space group) symmetry, such as a distortion from cubic to orthorhombic symmetry.
The anti-perovskite (AP) family of compounds presents an ideal venue to explore the impact of lattice distortions on ion mobility.11 The degree of lattice distortion in the APs can be systematically tuned via atom substitution,20,21 yet the relative simplicity of the structure allows for a comprehensive characterization of ion mobility. Moreover, since the extent of lattice distortions present in a compound can correlate with its thermodynamic stability, the APs also present a vehicle for probing how changes to stability impact the rates of ion migration.
APs adopt the well-known structure of the perovskites, but interchange the positions of the anions and cations.11 APs of interest for SEs adopt the formula X3AB, where X represents a mono-valent cation, and A and B are anions with respective charges of 2− and 1−. Included in these candidates is the so-called ‘Li-rich’ AP, Li3OCl (LOC, Fig. S1†), which exhibits a high ionic conductivity of ∼10−3 S cm−1 at room temperature.11
The degree of lattice distortion in the APs can be controlled through isoelectronic composition variation.20 The AP crystal structure consists of vertex-sharing octahedra, with the cations, X, occupying the octahedron vertices, Fig. 1. Chalcogenide anions, A, reside at the center of the octahedra, while halogen ions, B, sit at the vertices of a cubic framework. The degree of distortion in APs is described by the Goldschmidt tolerance factor, t:21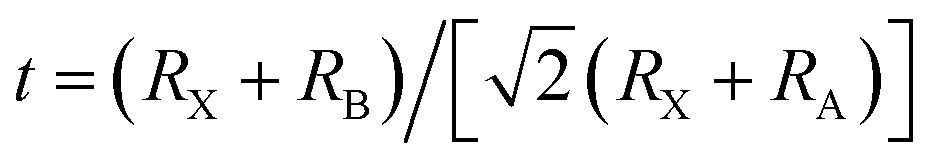 , where RX refers to the atomic radius of the cation (X), RB refers to the radius of the framework halogen (B), and RA is the same quantity for the chalcogenide ion (A) at the octahedron center. When t ∼ 1 the ions fill space nearly perfectly, resulting in a highly symmetric structure with a cubic (or nearly-cubic) unit cell. To date, the APs that have been examined as SEs generally fall into this category.11,22
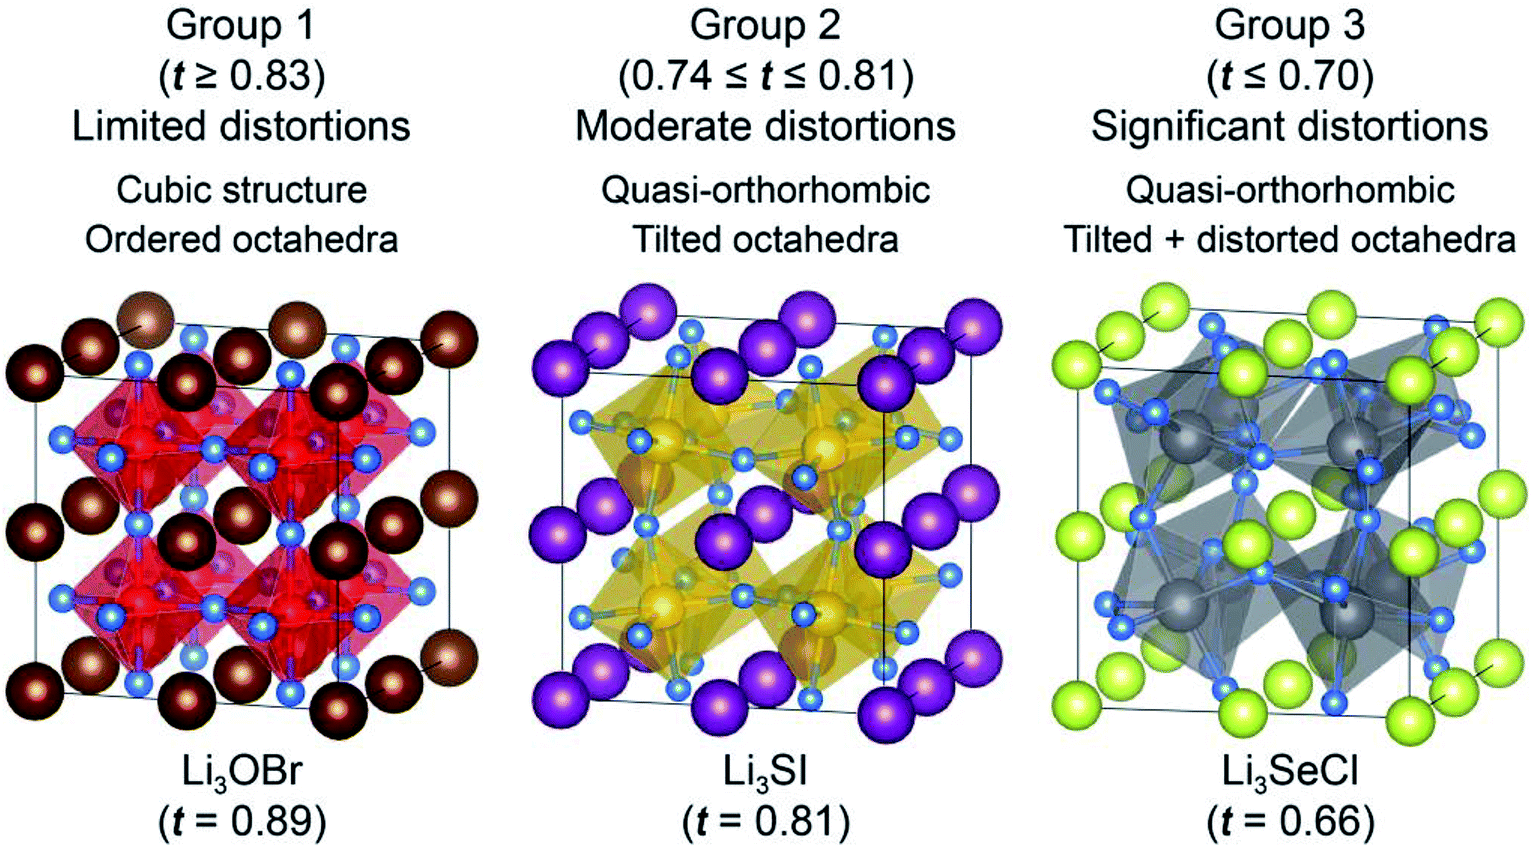 | ||
Fig. 1 Classification scheme for Li- and Na-based anti-perovskite solid electrolytes based on their degree of lattice distortion. Compounds in Group 1 have a high tolerance factor, exhibit highly ordered octahedra, and adopt the cubic Pm![[3 with combining macron]](https://www.rsc.org/images/entities/char_0033_0304.gif) m structure. Groups 2 and 3 have quasi-orthorhombic structures, and are characterized by successively smaller tolerance factors and increasingly larger distortions to the Li/Na-octahedra. Three representative structures (Li3OBr, Li3SI, and Li3SeCl) illustrate the increasing degree of distortion from Group 1 to Group 3. m structure. Groups 2 and 3 have quasi-orthorhombic structures, and are characterized by successively smaller tolerance factors and increasingly larger distortions to the Li/Na-octahedra. Three representative structures (Li3OBr, Li3SI, and Li3SeCl) illustrate the increasing degree of distortion from Group 1 to Group 3. | ||
Lattice distortions in the AP structure emerge for compositions comprised of ions having with mis-matched sizes. For example, in LOC, chalcogens such as S and Se can be substituted for oxygen, while halogens such as F, Br, and I can replace Cl. These compounds exhibit a greater mismatch in atomic sizes, characterized by a decrease in the tolerance factor, t < 1, and an increase in lattice distortions. These distortions manifest as tilting of the cation octahedra, variations in the bond lengths of the octahedra, and deviations from cubic symmetry, Fig. 1.20,23,24 APs with tolerance factors close to unity crystallize with in the cubic Pmm space group. By analogy with the regular perovskites, in the APs as t decreases lower-symmetry space groups are expected to successively emerge (orthorhombic Pnma, hexagonal P63cm, and cubic Ia).25,26 Moreover, t has also been correlated with thermodynamic stability, with smaller t values typically indicating a greater tendency for decomposition.27–29
Previous studies have described two mechanisms for Li-ion transport in LOC.30–35 These include a vacancy mechanism involving Li-ion hopping along the edges of the Li-octahedra, Fig. S2(a),†30 and hopping of a Li interstitial dumbbell, Fig. S2(b).†31 The interstitial process has a barrier that is roughly half that of the vacancy mechanism.31 The relative importance of these mechanisms remains a matter of debate. Mouta et al. suggested that Li vacancies are responsible for the high conductivity in pristine and divalent-metal doped LOC, owing to their higher vacancy concentration compared to Li interstitials.32 On the other hand, interstitials were predicted to dominate in samples synthesized under LiCl-deficient conditions,33 where an elevated concentration of oxygen substitutional defects on Cl-sites  is anticipated. Others have argued, however, that the high binding energy between Li interstitials and
  , will hinder interstitial hopping.34 In addition, Stegmaier et al. have proposed that Li vacancies are present in LOC near the cathode, whereas Li interstitials dominate near the interface with the anode.35
Composition variation has been explored as a means to increase the ionic conductivity of AP SEs. For example, the mixed-halogen phase, Li3OCl0.5Br0.5, exhibits a conductivity that is approximately twice that of LOC at room temperature.11,30 Zhao et al. proposed that this is due to a wider channel for Li-ion migration, which was made possible by an enlarged unit cell.11 Similarly, a computational study reported that Cl–Br substitutional disorder results in a spectrum of activation barriers, with some barriers being lower than those in LOC and LOB.31 Deng et al. predicted Li3OCl0.75Br0.25 to be the optimal mixed phase, with maximum ionic conductivity.36 The sodium analogues of LOC – Na3OCl (NOC), Na3OBr (NOB), Na3OI (NOI), and their respective mixed-halogen phases – have also been synthesized.22 Of these, Na3OBr0.6I0.4 was reported to have a higher conductivity than either NOC or NOB.22 Several other strategies have also been explored to increase the ionic conductivity of the APs.22,37–48
Here, we systematically probe the connection between ionic mobility, thermodynamic stability, and symmetry-lowering lattice distortions across a series of 24 model APs. The degree of lattice distortion, quantified by the tolerance factor, t, is varied via isovalent composition variations involving the cation (X = Li or Na) and anion sublattices (A = O, S, or Se, and B = F, Cl, Br, or I). Density functional theory (DFT) calculations were used to evaluate the energy barriers for all relevant ion migration pathways, assuming both vacancy and interstitial mechanisms.
Our calculations reveal that ‘distortion tuning’ can provide a pathway to higher ionic mobility. More specifically, a strong correlation is observed between the degree of lattice distortion and the minimum energy barrier for percolating ion migration: compounds with the largest lattice distortions exhibit the lowest migration barriers, independent of the migration mechanism. This trend is confirmed by a percolation theory analysis based on the connectivity of cation sites and the distribution of elementary energy barriers. Consistent with earlier studies, the energetic spread between the largest and smallest migration barriers for a given compound increases with the extent of distortion. Thus, lattice distortions slow migration along some pathways, while speeding up others. Fast pathways result from a combination of channel widening and destabilization of the potential energy surface. At the same time, larger distortions also correlate with diminished thermodynamic stability. Therefore, realizing high ionic mobility in this class of conductors requires balancing a tradeoff with stability. The anti-perovskite with composition Na3SI is identified as one such ‘balanced’ material. In total, this work will aid in the design of optimal solid electrolytes by revealing the connections between local lattice structure, mobility, and stability.
Methods
DFT calculations were performed with the Vienna ab initio Simulation Package (VASP).49 The Perdew–Burke–Ernzerhof (PBE)50 exchange–correlation functional was used in combination with the projector augmented wave (PAW) method.51,52 The following valence electron configurations were adopted: 2s1 for Li, 3s1 for Na, 2s22p4 for O, 2s22p5 for F, 3s23p4 for S, 3s23p5 for Cl, 4s24p4 for Se, 4s24p5 for Br and 5s25p5 for I. The plane-wave basis included functions with kinetic energies up to 450 eV. The Brillouin zone was sampled with a Γ-centered k-point mesh, and sampling was performed on grids ranging from 8 × 8 × 8 for the smallest computational cells (alkali-metal halides) to 2 × 2 × 2 for the largest systems (quasi-cubic systems with space group Ia, containing 80 atoms per cell). These sampling densities yielded energy convergence to within 1–2 meV per atom. The energy criterion for convergence of the self-consistency loop was set to 10−5 eV, and the force criterion for the relaxation of geometric degrees of freedom (ion positions and cell geometry) was 0.01 eV Å−1.
The nudged elastic band (NEB) method53,54 was used to evaluate energy barriers for cation migration via vacancy and interstitial ‘dumbbell’ mechanisms. NEB calculations were performed on enlarged supercells based on a 3 × 3 × 3 replication (135 atoms) of the unit cell for cubic Pmm compounds, and a 2 × 2 × 1 replication (80 atoms) for quasi-orthorhombic compounds. K-point sampling was performed at the Γ-point for cubic supercells, and with a Γ-centered 1 × 1 × 2 k-point mesh for the quasi-orthorhombic systems. Three intermediate NEB images were used, and the force convergence criterion was set to 0.03 eV Å−1. It was assumed that the interstitial dumbbells do not rotate during migration, as the barrier for rotation has been reported to be more than twice that for translation.31
Many-body perturbation theory (GW method)55,56 was used to predict the band gaps of the various AP phases. The bandgaps provide an upper bound for the electrochemical window of a given SE.57 Additional details regarding the GW calculations can be found in the ESI.†
The thermodynamic stability of the AP phases was assessed using the convex hull concept.58 The energy relative to the convex hull, EH, was calculated as:
| EH = [EAP − (Echalcogenide + Ehalide)]/N, |
Results and discussion
Structure
LOC, LOB, and their Na analogues – NOC, NOB, and NOI – have been synthesized previously.11,22 These compounds adopt a cubic structure with space group Pmm. Isoelectronic composition variation on the cation (X = Li or Na) and anion sublattices (A = O, S, or Se, and B = F, Cl, Br, or I) results in 19 additional (hypothetical) AP compositions. As discussed above, ion substitution will result in a change to the tolerance factor, and potentially convert the cubic Pmm structure (generally present for 0.9 < t < 1.0) into one of three other structure types: orthorhombic (Pnma, for tolerance factors roughly between 0.75 and 0.9), hexagonal (P63cm, t ≲ 0.75), and cubic (Ia, for tolerance factors beyond the hexagonal regime).25,26 Initial structures adopting the 4 structure types were generated for each of the 24 possible compositions. These structures were based on the following prototypes: Li3OCl11 (Pmm), CaTiO3 (ref. 60) (Pnma), HoMnO3 (ref. 61) (P63cm), and ScFeO3 (ref. 62) (Ia). All structures were fully relaxed, with the resulting energy-volume data fit to the Murnaghan equation of state (EOS).63 Additional details can be found in the ESI.†
In addition to deviations from cubic symmetry, additional distortions in the perovskite can occur via perturbations to the octahedral building blocks. These include: octahedron tilting, displacement of the octahedron's central ion, and distortion of the octahedron shape, resulting in deviations to the octahedron's bond lengths and angles.20,23,24 These distortions can occur independently or simultaneously.23 For example, a previous DFT study predicted that LOC (t = 0.84) (ref. 64) should undergo a minor orthorhombic distortion at T = 0 K.65 However, the tilting angle (<2°) and the energy difference (0.2 meV per atom) relative to the cubic (Pmm) system were extremely small. Thus, the predicted structure is approximately cubic, as observed experimentally at ambient conditions.11
Table S1† lists the tolerance factors and calculated energies (relative to that of the cubic Pmm variant) for all 24 compounds examined. The tolerance factors were evaluated using the reported ionic radii.64 The tolerance factor approaches unity upon substitution of larger halogen ions and smaller chalcogen ions. Conversely, t is generally smallest for substitutions of large chalcogens and small halogens, e.g., Li3SeCl (t = 0.66). In the case of the initially orthorhombic and cubic (Ia) cells, upon relaxation the lattice vectors of these systems exhibit slight distortions from their original orthogonal orientations (deviations are less than 0.1° and 5.3°, respectively); thus, we refer to these structures as ‘quasi-orthorhombic’ and ‘quasi-cubic.’ No distortions to the lattice vector angles were observed in the hexagonal structures. Surprisingly, during relaxation of the F-containing compounds Li3SF, Li3SeF, Na3SF, and Na3SeF, the chalcogen and halogen ions interchanged positions via rearrangement of the Li-ion sublattice (Fig. S3†). This rearrangement positions F at the center of the Li octahedra, and increases the tolerance factor significantly. Additional details regarding these ‘F-centered’ compounds can be found in the ESI.†
The calculations predict that the quasi-orthorhombic structures are generally the lowest in energy, Table S1.† For a few compositions the energy of the quasi-orthorhombic structure is nearly identical to (<5 meV per atom difference) that of the cubic (Pmm) or quasi-cubic (Ia) variants. These cases include LOC, LOB, NOC, NOB and NOI, which, based on experiments, crystallize in the Pmm structure.11,22 Given the computational and experimental preference for the Pmm and quasi-orthorhombic structures, these two systems were adopted for subsequent calculations of migration barriers. The structural parameters, bulk moduli, and band gaps for all low-energy structures are listed in Tables S2 and S3.†
The AP examined here were further classified into three groups based on their tolerance factor and the degree of octahedral distortions. Fig. 1 illustrates this classification. ‘Group 1’ includes cubic Pmm compounds having well-ordered octahedra and tolerance factors t ≥ 0.83. This behavior is similar to that of the cubic perovskite oxides, whose tolerance factors typically fall between 0.9 and 1.0.23 As the tolerance factor decreases, mismatch in atomic radii leads to moderate distortions via tilting of the octahedra, and a change in symmetry to quasi-orthorhombic, Fig. 1, Group 2. Here, 0.74 ≤ t ≤ 0.81, and the degree of octahedron tilting (11.6–19.5°) increases with decreasing t. Finally, in Group 3, t ≤ 0.7, and the system remains quasi-orthorhombic. These systems have significant distortions to the octahedra, including tilting (21.0–27.1°) and X–A–X bond angle distortions (7.3–12.9°).
Migration pathway
Under equilibrium conditions, the formation energies of charge carriers (vacancies or interstitials) can impact mobility and conductivity. Earlier studies have shown that these formation energies can be high.31,32,34,35 However, experiments have shown that the concentrations of these species in the AP ion conductors can be controlled during synthesis by employing non-stoichiometric ratios of the precursors. For example, 6.66% Li vacancies were achieved in Li2.8OCl0.8 by depleting the amount of LiCl during synthesis.11 The ‘baked in’ nature of these concentrations suggests that migration energies, and not the activation energies, are of paramount importance in understanding ionic mobility in the APs. This observation motivates our emphasis on migration barriers. (In addition, we found that the formation energy of neutral cation vacancies is not strongly correlated with the tolerance, and that the presence of a defect increases the magnitude of local distortions.)The simplicity of the AP structure allows for a comprehensive sampling of the activation energies and minimum energy pathways associated with ion migration. NEB calculations were used to evaluate these pathways for both the vacancy and interstitial dumbbell mechanisms. The elementary migration events that comprise these two mechanisms involve ion hopping along the 12 edges of the Li/Na octahedra. Due to the high symmetry of the cubic AP, the 12 pathways in this system are degenerate; it is therefore sufficient to evaluate a single path for each of the two mechanisms. In contrast, in the lower-symmetry quasi-orthorhombic systems the presence of lattice distortions implies that all 12 elementary migration paths are distinct. These quasi-orthorhombic compounds contain four distinct octahedra per unit cell. Nevertheless, these octahedra exhibit very similar structures – the maximum structural deviations between octahedra are in all cases less than 2.4%: X–A bond lengths (<0.2% deviation), X–A–X bond angles (<1.3%), distances between alkali-metal ions (dX–X < 1.0%), and distances between alkali-metal ions and framework anions (dX–B < 2.4%). Due to the near-equivalence of the octahedra, it is sufficient to map out migration mechanisms along the 12 pathways that orbit a single octahedron. This assertion was tested by calculating all 48 barriers for the vacancy mechanism in Li3SI, the AP having the largest structural deviations between octahedra. As expected, the differences between elementary barriers on distinct octahedra (Fig. S4†) were found to be small, less than 1.4%.
Fig. 2 shows the connectivity between octahedra in a representative Group 3 distorted AP structure, Li3SeCl (t = 0.66). Mobile cations are located at the octahedron vertices, which are shared by adjacent octahedra. The cations in each octahedron are labeled 1 through 6; equivalent labels are shown at the shared vertices for selected ions. Using this labeling scheme, a percolating pathway (i.e., one which allows for macroscopic ion migration) can be identified by the numerical sequence of sites visited during the migration process. For example, the arrows in Fig. 2 depict a pathway that starts at the bottom of the bottom-left octahedron and terminates at the top edge of the top-left octahedron: 1 → 6 → 4 (=1) → 6 → 4 (=1).
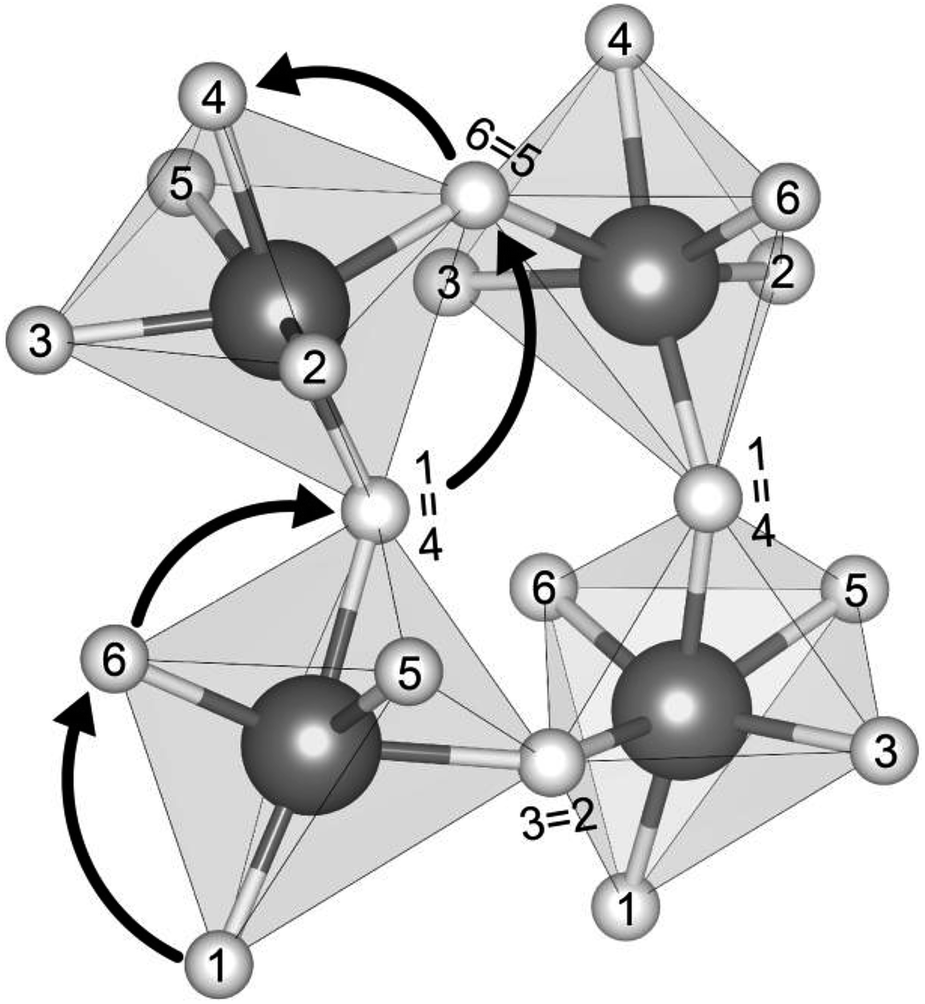 | ||
| Fig. 2 Connectivity between octahedra in distorted anti-perovskites. Atomic sites of mobile ions are numbered; identical sites in different octahedra adopt the same number. (Selected shared vertex sites are indicated with an equals sign.) Arrows illustrate an example of a migration pathway resulting in long-range ion transport. | ||
We aim to find low-energy migration pathways that contribute to long-range (percolating) ion transport. These pathways were identified by combining multiple elementary migration events. Here, an elementary migration event corresponds to the hop of a vacancy or an interstitial dumbbell to an adjacent octahedral site along an octahedron edge. The following procedure was employed to find percolating pathways (see Fig. S5† for an example): (1) one of the six cation sites on an octahedron is selected as the initial position for a vacancy or interstitial. (2) The defect migrates to an adjacent site along the path having the lowest barrier. (3) At the new site, the barriers for the non-reversing paths are compared to those for the discarded paths from the previous step(s). If all barriers out of the current site are larger than the smallest of the previously-discarded barriers, then the search reverts to the previous site and migrates along the discarded pathway with the smallest barrier. Alternatively, the defect continues along the path having the lowest barrier. (4) Step 3 is repeated until a pathway is identified that does not contain closed loops or revisit sites. The pathway should terminate at a site that is crystallographically-equivalent to the initial site. (5) Return to step 1; repeat the process for all possible initial locations of the mobile species. Stitching together multiple elementary migration events will yield a percolating pathway with multiple maxima. The procedure described above identifies the percolating pathway having the smallest maximum migration barrier. We refer to this pathway as the preferred pathway and its associated barrier as the limiting barrier.
Fig. 3 shows the preferred pathways for all 24 AP candidates. The limiting barriers fall within 95–426 meV for the vacancy mechanism, and within 24–165 meV for the interstitial dumbbell. The relatively lower barriers observed for the interstitial mechanism are consistent with prior reports on selected AP SE.31 Importantly, the range of limiting barriers for all-but-one of the compounds fall below the ∼400 meV threshold estimated assuming a SE with 10 μm thickness and C/2 rate.66 Other reports have suggested activation energies in the range of 200–300 meV as being desirable for a viable SE;67 all but 4 of the APs considered here – all operating via vacancy migration – satisfy this criterion. Moreover, a significant fraction of the APs exhibit migration barriers that are smaller than or comparable to those reported in the literature for state-of-the-art solid electrolytes: Li10GeP2S12 (250 meV), Li7La3Zr2O12 (310 meV), Li6PS5Cl (110 meV) and Li2S-P2S5 glass (390 meV).8,10,68,69 (These literature values may, in some cases, refer to activation energies, which can include contributions from formation energies and from defects such as grain boundaries. Consequently, direct comparisons with the migration energies reported in the present study should be undertaken with care.) In total, high ionic conductivity could be possible in these APs if they could be synthesized in a form having high carrier concentrations. Nevertheless, it should be emphasized that a complete assessment of the viability of a solid electrolyte should include factors beyond intrinsic (bulk) migration energies. For example, recent studies have highlighted contributions from grain boundaries48,70 and electrolyte/electrode interfaces71 in the performance of solid electrolytes.
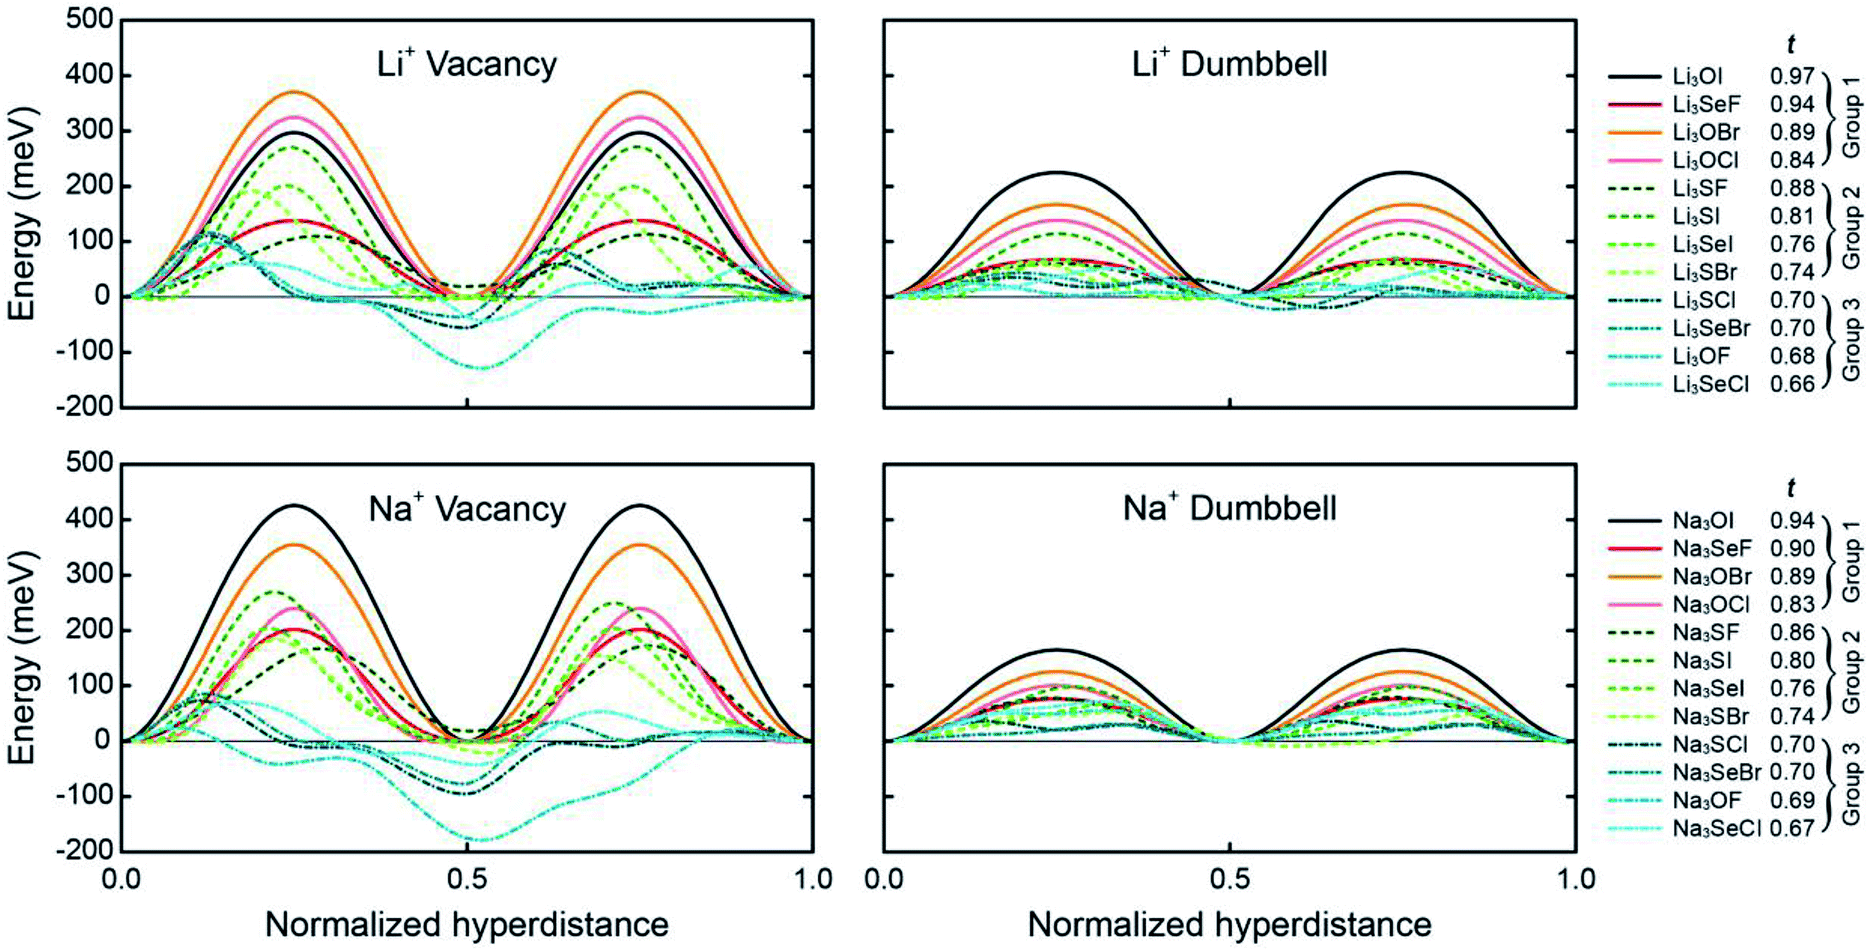 | ||
| Fig. 3 Minimum-energy pathways for vacancy and interstitial-dumbbell migration in Li- and Na-based anti-perovskites. The limiting barrier along each of these pathways is listed in Table 1. (Negative energies appearing in some of the vacancy-mediated mechanisms indicate a preference for locating the vacancy on certain cation sites. The calculated energy barriers account for uphill steps from these positions, i.e., barriers are calculated as the difference between the maximum and minimum energies along a given pathway.) | ||
Can the size of an AP's limiting barrier be related to a fundamental property? Fig. 3 suggests that the more distorted Group 2 and 3 AP have smaller limiting barriers than those for the ordered Group 1 systems. Fig. 4 probes the connection between barrier size and the magnitude of the lattice distortion by plotting the limiting barrier as a function of the tolerance factor; the barriers and t values for all compounds are summarized in Table 1. These data show that the barrier size exhibits a strong linear correlation with the tolerance factor, independent of the migration mechanism (vacancy or dumbbell): larger tolerance factors, indicative of limited distortions, yield higher migration barriers, while smaller values of t (greater distortion) yield lower barriers. Thus, ionic mobility can be maximized by ‘distortion tuning’: substitution of larger chalcogen and smaller halogen ions within the AP structure results in lower limiting barriers. Interestingly, the F-centered compounds do not follow this trend; these compounds have lower barriers than other compounds with similar t.
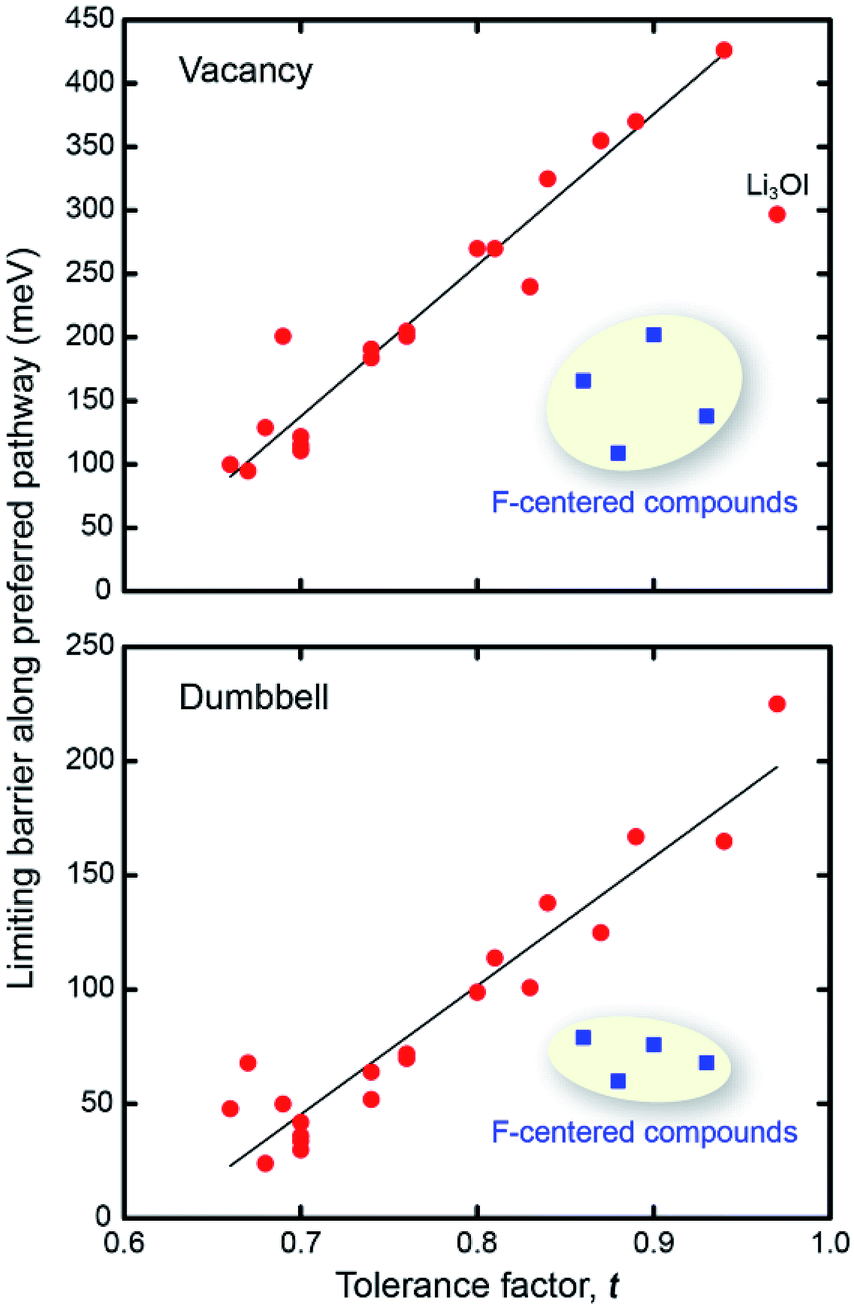 | ||
| Fig. 4 Correlation between tolerance factor, t, and the limiting barrier along the preferred percolating pathway for vacancy (top) and interstitial dumbbell (bottom) migration. Blue squares depict the F-centered compounds. | ||
| Li-based compounds | t (Group) | Vacancy | Interstitial dumbbell | Na-based compounds | t (Group) | Vacancy | Interstitial dumbbell |
|---|---|---|---|---|---|---|---|
| Li3OF | 0.68 (3) | 129 (165) | 24 (23) | Na3OF | 0.69 (3) | 201 (120) | 50 (50) |
| Li3OCl | 0.84 (1) | 325 | 138 | Na3OCl | 0.83 (1) | 240 | 101 |
| Li3OBr | 0.89 (1) | 370 | 167 | Na3OBr | 0.87 (1) | 355 | 125 |
| Li3OI | 0.97 (1) | 297 | 225 | Na3OI | 0.94 (1) | 426 | 165 |
| Li3SF | 0.88 (2) | 109 (101) | 60 (65) | Na3SF | 0.86 (2) | 166 (159) | 79 (75) |
| Li3SCl | 0.70 (3) | 115 (137) | 34 (39) | Na3SCl | 0.70 (3) | 112 (127) | 36 (37) |
| Li3SBr | 0.74 (2) | 191 (196) | 64 (66) | Na3SBr | 0.74 (2) | 184 (186) | 52 (54) |
| Li3SI | 0.81 (2) | 270 (270) | 114 (109) | Na3SI | 0.80 (2) | 270 (256) | 99 (98) |
| Li3SeF | 0.93 (1) | 138 | 68 | Na3SeF | 0.90 (1) | 202 | 76 |
| Li3SeCl | 0.66 (3) | 100 (82) | 48 (39) | Na3SeCl | 0.67 (3) | 95 (91) | 68 (45) |
| Li3SeBr | 0.70 (3) | 122 (134) | 42 (46) | Na3SeBr | 0.70 (3) | 111 (130) | 30 (30) |
| Li3SeI | 0.76 (2) | 201 (208) | 70 (71) | Na3SeI | 0.76 (2) | 205 (198) | 72 (74) |
An earlier study found that substitution of larger, more polarizable chalcogen anions in Li10±1GeP2X12 (via the substitutions X = O → S → Se) lowered activation energies by increasing the width of the cation migration channel.72 This trend is also present in our data, and will be described in more detail below. In yet another example, increasing the polarizability (and size) of the halogen anions in the argyrodites Li6PS5X via the substitutions X = Cl → Br → I resulted in decreasing lattice stiffness, which in turn yielded lower activation energies.73 This trend is absent in the AP systems studied here: activation energies increase with increasing polarizability of the framework halogen anion. This discrepancy could result from a larger impact from distortion-related effects, which could overshadow effects arising from differences in the size and polarizability of the halogens.
Fig. 5 plots the distribution of the energy barriers for all elementary migration paths as a function of the degree of lattice distortion, as measured by the tolerance factor. The barriers are obtained by averaging forward and backward hops. As described above, in the cubic Pmm systems all elementary paths are equivalent, and are therefore described by a single barrier. This degeneracy is broken in the non-cubic compounds, resulting in a widening distribution of energy barriers with increasing distortions, or equivalently, decreasing t. Taking vacancy migration as an example, compounds with moderate tolerance factors, t ∼ 0.8, exhibit a relatively narrow range (<100 meV) of barrier energies. This range increases rapidly with decreasing t, reaching a spread of ∼900 meV for compounds having the smallest tolerance factors. Our results generalize the findings of an earlier study on Li3OCl0.5Br0.5, which found that Cl–Br substitutional disorder results in a spectrum of activation barriers.31 In addition, the largest and smallest barriers vary distinctly with respect to t: the smallest barriers shrink in roughly linear proportion to t, while the largest barriers grow super-linearly. Thus, an increase in lattice distortion facilitates migration along some elementary pathways, while slowing others. If these lower-barrier hops can be connected in a percolating network, as shown in Fig. 3, then ionic mobility can increase.
 | ||
| Fig. 5 Dispersion of elementary migration barriers as a function of the tolerance factor, t, for 24 anti-perovskite solid electrolytes. | ||
Percolation theory analysis
In cases where the distribution of elementary energy barriers is known, percolation theory (PT) can be used to estimate the effective energy barrier, Ep, needed to establish a percolating network for ion migration.74Ep is defined in terms of the probability distribution of elementary energy barriers, F(E), and the bond percolation threshold, p: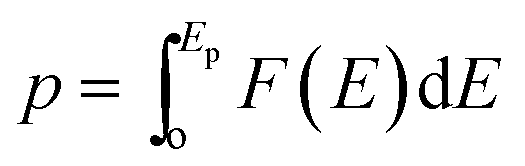 . Thus, Ep is the smallest energy such that at least a fraction p of elementary barriers are less than Ep. In other words, the most likely migration paths will be those from F(E) having the lowest barriers; p determines how ‘high’ one must climb into the distribution of barriers F(E) to achieve percolation, with Ep being the value of F(E) at the pth percentile. Ep is expected to be similar to the limiting barriers evaluated here for APs; nevertheless, we are unaware of a direct comparison between PT and the ‘brute force’ enumeration approach used in the present study to evaluate limiting barriers. Previously, we used PT to estimate Ep for ionic and electronic migration in amorphous Li2O2 from a partial distribution of elementary energy barriers.75 Different from that prior study, in the APs the full distribution of elementary barriers can be evaluated, Fig. 5. Thus, the AP systems present an opportunity to directly compare the predictions of PT with the limiting barriers described above.
Application of PT requires an estimate of the bond percolation threshold, p. The product of p and the coordination number, CN, of a mobile ion (Na or Li) gives the average number of escape paths from a lattice site needed to establish a percolating network. Systems having lower CN will have fewer potential migration pathways and will generally require larger values of p to achieve percolation. Accurate p values have been proposed for several lattices.76 The Li–Li and Na–Na CN's for the majority of APs examined here is equal to 8, with a slightly larger value of 8.67 measured for compounds with smaller t. These CN's are similar to that of a bcc lattice; thus, the percolation threshold for bcc systems, p = 0.18,76 is adopted. The effective barrier can then be obtained by linear interpolation77 to the probability distribution of barriers as:75Ep = Ekb + d(Ek + 1b − Ekb). Here, Ekb is the energy of the kth lowest barrier, where k is an integer, and d is a fraction between zero and one, defined by p(N + 1) = k + d. N is the number of elementary barriers in F(E). Additional details regarding the PT analysis can be found in the ESI (Fig. S6†).74,75Table 1 compares the effective barriers from PT, Ep, with the calculated limiting barriers. In all cases good agreement is obtained: for example, the mean absolute deviation between these two estimates is only 10 meV. In total, the good agreement between the enumeration and PT predictions provides additional validation for our results.
Stability
While our emphasis thus far has been on clarifying the connection between lattice distortions and ionic mobility, the linkage between mobility and thermodynamic stability is also of fundamental interest. Moreover, the observation that several of the compounds examined exhibit low limiting barriers raises the question: can these materials be made? To answer, the thermodynamic stability of the APs was assessed using the convex hull concept.58More specifically, the decomposition energy, Ed, of each AP at zero Kelvin was calculated assuming decomposition into a two-component mixture of alkali chalcogenides and halides. Per literature convention,59 the APs were grouped into three categories based on their decomposition energies: (i) stable, Ed < 0, (ii) metastable, Ed within 0–50 meV per atom, and (iii) unstable, Ed > 50 meV per atom.
Fig. 6 plots the decomposition energy for each AP as a function of its tolerance factor. As expected, the data show a rough correlation between stability and t: compounds having larger lattice distortions (smaller t) tend to be less stable.27–29 We recall from the preceding discussion that larger limiting barriers correlate with larger t; thus, a tradeoff exists between ionic mobility and stability: increasing the degree of lattice distortion enhances mobility, but comes at a cost to stability (Fig. S7†). While it is unlikely a compound such as Li3SeCl with a very low limiting barrier (48 meV) would be stable (Ed = 73 meV per atom), compounds that balance stability with the barrier height could be promising. Na3SI represents one such ‘Goldilocks’ material: it possesses both a moderate decomposition energy of 27 meV per atom and small limiting barrier heights of 99 and 270 meV for the interstitial and vacancy mechanisms, respectively, Table 1. Notably, Ed for Na3SI is similar to that of Li3OBr (22 meV per atom, Table S4†), a compound which has been experimentally synthesized, yet whose barriers are up to 100 meV larger. Consequently, Na3SI is proposed as a target for experimental study. We note that the structure of Na3SI is similar to that of the anti-perovskite mixed conductor β-Ag3SI.78 Four additional compounds – Na3SeF, Na3SeI, Li3SI and Na3SF – might also be worth exploring experimentally, as their stabilities are only slightly less than that of LOC, LOB, and Na3SI. Additional details regarding the stability calculations can be found in the ESI.†
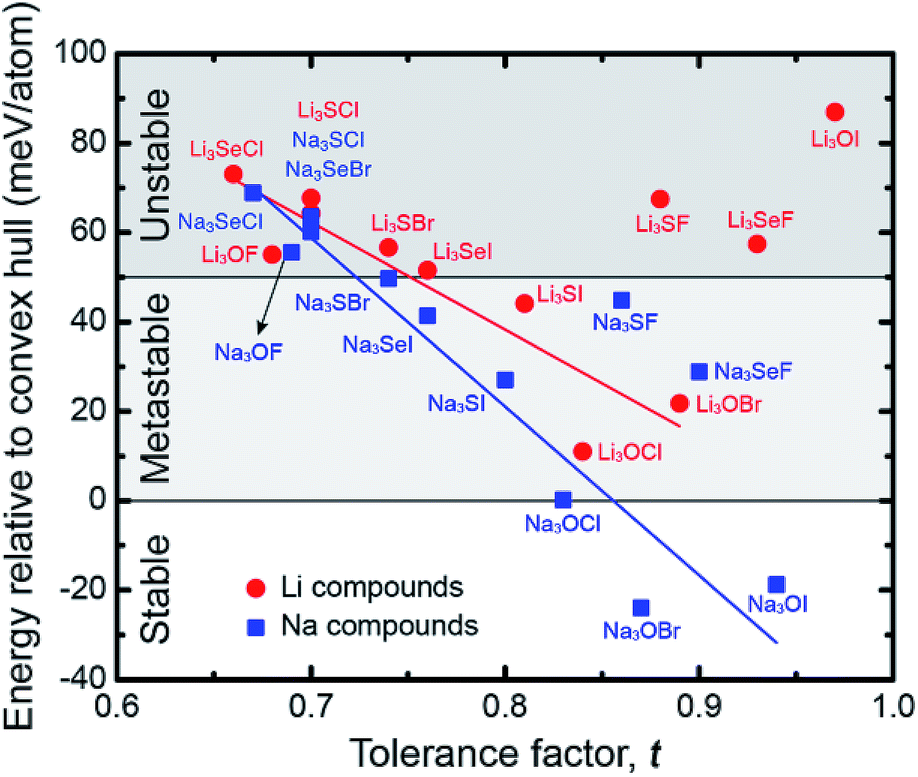 | ||
| Fig. 6 Correlation between the tolerance factor and the energy relative to the convex hull (equivalent to the decomposition energy, Ed) for the anti-perovskites examined in this study. | ||
Mechanisms for increasing mobility
Our calculations indicate that larger lattice distortions correlate with increasing ion mobility in the anti-perovskites. A discussion of the mechanisms underlying these correlations is now presented. Fig. 7 illustrates the connections between distortions and the migration barrier. The migration barrier for an ion hop, Eb, is defined as the difference in energy between the transition state (TS) and the equilibrium state (ES): Eb = ETS − EES. Thus, Eb can be impacted by changes to TS, to ES, or to both. The grey dashed curve in Fig. 7 illustrates these energy levels on a model potential energy surface (PES) from an AP having limited lattice distortions (t ∼ 1). Previously, it was shown (Fig. 6) that larger lattice distortions correlate with reduced thermodynamic stability. The impact of reduced stability on the PES is shown by the blue dashed curve in Fig. 7. In this case the PES is shifted towards higher energies.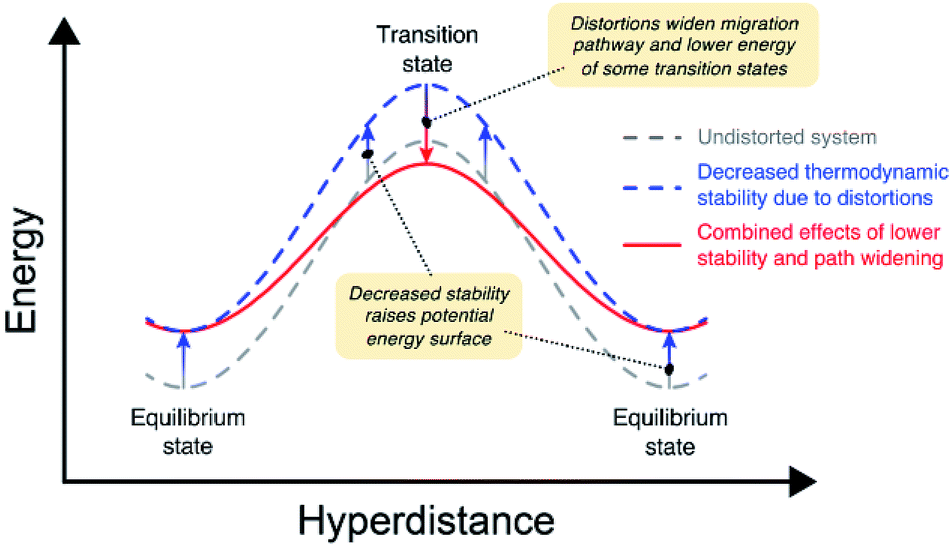 | ||
| Fig. 7 Cartoon depicting the effects of lattice distortions on the energy barrier for ion migration in anti-perovskites. Grey dashed curve: energy profile for migration in an undistorted system. Blue dashed curve: energy profile for a system with reduced thermodynamic stability arising from lattice distortions. Red curve: profile accounting for the combined effects of reduced stability and widening of the migration pathway. | ||
Concomitantly, these same lattice distortions can result in path widening at the transition state, offsetting the increase in energy to ETS arising from lowered stability (red curve in Fig. 7). For example, earlier studies have shown that increasing the width of the cation migration channel can lower Eb by lowering ETS.11,72 Fig. S9 and S10† show the correlation between Eb for elementary hops and the width of the ion migration channel for the vacancy and interstitial mechanisms, respectively. For the vacancy mechanism (Fig. S9†), these data show that in most compounds a wider channel width results in smaller Eb. This correlation is much weaker for the interstitial mechanism (Fig. S10†), most likely because the path-widening effects are subsumed within the formation enthalpy of the interstitial. Thus, lattice distortions can influence ETS (and thus Eb) for the vacancy mechanism by introducing migration pathways with wider channels. In total, the combined effects of lower stability and path widening result in a smaller net migration barrier for a subset of the available migration pathways.
Conclusion
The design of new solid electrolytes will be aided by an understanding of the elementary chemical and structural features that control ionic mobility. The present study demonstrates that lattice distortions are one such feature. The connection between ionic mobility and lattice distortions was assessed across a series of 24 model anti-perovskite solid electrolytes. The degree of these distortions, quantified by the tolerance factor, t, was systematically varied through a sequence of isovalent composition variations. Density functional theory calculations were used to evaluate the energy barriers for all relevant ion migration pathways, assuming both vacancy and interstitial mechanisms.These calculations reveal a strong correlation between the magnitude of lattice distortion and the limiting barrier for percolating ion migration: compounds with larger distortions exhibit smaller migration barriers. This trend was confirmed by a percolation theory analysis based on the coordination of cation sites and the distribution of elementary energy barriers. Consistent with earlier studies, the energetic spread between the largest and smallest migration barriers for a given compound was found to increase with the extent distortion. Hence, lattice distortions slow migration along some pathways, while speeding up others. In the case of the anti-perovskites, these lower-barrier hops can be assembled into a percolating network. Fast pathways result from a combination of channel widening and destabilization of the equilibrium configuration.
In addition, a higher degree of lattice distortion also correlates with diminished thermodynamic stability. Therefore, realizing those compounds having the highest ionic mobility in this class of conductors will require balancing a tradeoff with stability. Na3SI is identified as one such ‘balanced’ material.
While the anti-perovskites represent a specific model system, we anticipate that the trends described here can be generalized to other classes of crystalline solid electrolytes. The present results teach us that perturbations to ion-packing, introduced via iso-valent substitution, leads to lattice distortions and symmetry-breaking. These effects remove the degeneracy of the migration barriers in the non-distorted materials, and can open up ion-migration channels with potentially lower barriers. In principle, this concept could be applied to any crystalline system. Of course, this strategy has some boundaries of applicability, as very large ionic size mismatches could induce transformations to other crystal structures. In total, by clarifying the connections between lattice distortions, mobility, and stability, this work will aid in the design of optimal solid electrolytes.
Conflicts of interest
The authors declare no competing financial interest.Acknowledgements
This work was supported as part of the Joint Center for Energy Storage Research (JCESR), an Energy Innovation Hub funded by the U.S. Department of Energy, Office of Science, Basic Energy Sciences.References
- J. B. Goodenough and Y. Kim, Challenges for Rechargeable Li Batteries, Chem. Mater., 2010, 22(3), 587–603 CrossRef.
- E. P. Roth and C. J. Orendorff, How Electrolytes Influence Battery Safety, Electrochem. Soc. Interface, 2012, 21(2), 45–49 CrossRef CAS.
- J. B. Goodenough and P. Singh, Review—Solid Electrolytes in Rechargeable Electrochemical Cells, J. Electrochem. Soc., 2015, 162(14), A2387–A2392 CrossRef CAS.
- C. Monroe and J. Newman, The Impact of Elastic Deformation on Deposition Kinetics at Lithium/Polymer Interfaces, J. Electrochem. Soc., 2005, 152(2), A396–A404 CrossRef CAS.
- S. Yu, R. D. Schmidt, R. Garcia-Mendez, E. Herbert, N. J. Dudney, J. B. Wolfenstine, J. Sakamoto and D. J. Siegel, Elastic Properties of the Solid Electrolyte Li7La3Zr2O12 (LLZO), Chem. Mater., 2016, 28(1), 197–206 CrossRef CAS.
- Y.-S. Hu, Batteries: Getting Solid, Nat. Energy, 2016, 1(4), 16042 CrossRef CAS.
- P. Albertus, S. Babinec, S. Litzelman and A. Newman, Status and Challenges in Enabling the Lithium Metal Electrode for High-Energy and Low-Cost Rechargeable Batteries, Nat. Energy, 2018, 3(1), 16–21 CrossRef CAS.
- R. Murugan, V. Thangadurai and W. Weppner, Fast Lithium Ion Conduction in Garnet-Type Li7La3Zr2O12, Angew. Chem., Int. Ed., 2007, 46(41), 7778–7781 CrossRef CAS PubMed.
- H.-J. Deiseroth, S. T. Kong, H. Eckert, J. Vannahme, C. Reiner, T. Zaiß and M. Schlosser, Li6PS5X: A Class of Crystalline Li-Rich Solids with an Unusually High Li+ Mobility, Angew. Chem., Int. Ed., 2008, 47(4), 755–758 CrossRef CAS PubMed.
- N. Kamaya, K. Homma, Y. Yamakawa, M. Hirayama, R. Kanno, M. Yonemura, T. Kamiyama, Y. Kato, S. Hama and K. Kawamoto, et al., A Lithium Superionic Conductor, Nat. Mater., 2011, 10(9), 682–686 CrossRef CAS PubMed.
- Y. Zhao and L. L. Daemen, Superionic Conductivity in Lithium-Rich Anti-Perovskites, J. Am. Chem. Soc., 2012, 134(36), 15042–15047 CrossRef CAS PubMed.
- W. D. Richards, T. Tsujimura, L. J. Miara, Y. Wang, J. C. Kim, S. P. Ong, I. Uechi, N. Suzuki and G. Ceder, Design and Synthesis of the Superionic Conductor Na10SnP2S12, Nat. Commun., 2016, 7, 11009 CrossRef CAS PubMed.
- Y. Kato, S. Hori, T. Saito, K. Suzuki, M. Hirayama, A. Mitsui, M. Yonemura, H. Iba and R. Kanno, High-Power All-Solid-State Batteries Using Sulfide Superionic Conductors, Nat. Energy, 2016, 1(4), 16030 CrossRef CAS.
- W. D. Richards, Y. Wang, L. J. Miara, J. C. Kim and G. Ceder, Design of Li1+2xZn1−xPS4, a New Lithium Ion Conductor, Energy Environ. Sci., 2016, 9(10), 3272–3278 RSC.
- J. C. Bachman, S. Muy, A. Grimaud, H. H. Chang, N. Pour, S. F. Lux, O. Paschos, F. Maglia, S. Lupart and P. Lamp, et al., Inorganic Solid-State Electrolytes for Lithium Batteries: Mechanisms and Properties Governing Ion Conduction, Chem. Rev., 2016, 116(1), 140–162 CrossRef CAS PubMed.
- Y. Wang, W. D. Richards, S. P. Ong, L. J. Miara, J. C. Kim, Y. Mo and G. Ceder, Design Principles for Solid-State Lithium Superionic Conductors, Nat. Mater., 2015, 14(10), 1026–1031 CrossRef CAS PubMed.
- A. D. Sendek, Q. Yang, E. D. Cubuk, K.-A. N. Duerloo, Y. Cui and E. J. Reed, Holistic Computational Structure Screening of More than 12
![[thin space (1/6-em)]](https://www.rsc.org/images/entities/char_2009.gif) 000 Candidates for Solid Lithium-Ion Conductor Materials, Energy Environ. Sci., 2017, 10(1), 306–320 RSC.
000 Candidates for Solid Lithium-Ion Conductor Materials, Energy Environ. Sci., 2017, 10(1), 306–320 RSC. - P. Canepa, S. H. Bo, G. Sai Gautam, B. Key, W. D. Richards, T. Shi, Y. Tian, Y. Wang, J. Li and G. Ceder, High Magnesium Mobility in Ternary Spinel Chalcogenides, Nat. Commun., 2017, 8, 1759 CrossRef PubMed.
- W. Liu, S. W. Lee, D. Lin, F. Shi, S. Wang, A. D. Sendek and Y. Cui, Enhancing Ionic Conductivity in Composite Polymer Electrolytes with Well-Aligned Ceramic Nanowires, Nat. Energy, 2017, 2(5), 1–7 Search PubMed.
- M. R. Levy, R. W. Grimes and K. E. Sickafus, Disorder Processes in A3+B3+O3 Compounds: Implications for Radiation Tolerance, Philos. Mag., 2004, 84(6), 533–545 CrossRef CAS.
- V. M. Goldschmidt, Die Gesetze Der Krystallochemie, Naturwissenschaften, 1926, 14(21), 477–485 CrossRef CAS.
- Y. Wang, Q. Wang, Z. Liu, Z. Zhou, S. Li, J. Zhu, R. Zou, Y. Wang, J. Lin and Y. Zhao, Structural Manipulation Approaches towards Enhanced Sodium Ionic Conductivity in Na-Rich Antiperovskites, J. Power Sources, 2015, 293, 735–740 CrossRef CAS.
- R. J. D. Tilley, Perovskites: Structure–Property Relationships, John Wiley & Sons, Chichester, West Sussex, 2016 Search PubMed.
- M. W. Lufaso, Perovskite Synthesis and Analysis Using Structure-Prediction Diagnostic Software, PhD thesis, Ohio State University, Columbus, OH, 2002 Search PubMed.
- R. I. Hines, Atomistic Simulation and Ab-Initio Studies of Polar Solids, PhD thesis, University of Bristol, Bristol, UK, 1997 Search PubMed.
- M. R. Levy, Crystal Structure and Defect Property Predictions in Ceramic Materials. PhD thesis, University of London, London, UK, 2005 Search PubMed.
- H. Yokokawa, N. Sakai, T. Kawada and M. Dokiya, Thermodynamic Stabilities of Perovskite Oxides for Electrodes and Other Electrochemical Materials, Solid State Ionics, 1992, 52(1–3), 43–56 CrossRef CAS.
- K. D. Kreuer, On the Development of Proton Conducting Materials for Technological Applications, Solid State Ionics, 1997, 97(1–4), 1–15 CrossRef CAS.
- G. P. Nagabhushana, R. Shivaramaiah and A. Navrotsky, Direct Calorimetric Verification of Thermodynamic Instability of Lead Halide Hybrid Perovskites, Proc. Natl. Acad. Sci. U. S. A., 2016, 113(28), 7717–7721 CrossRef CAS PubMed.
- Y. Zhang, Y. Zhao and C. Chen, Ab Initio Study of the Stabilities of and Mechanism of Superionic Transport in Lithium-Rich Antiperovskites, Phys. Rev. B: Condens. Matter Mater. Phys., 2013, 87(13), 134303 CrossRef.
- A. Emly, E. Kioupakis and A. Van der Ven, Phase Stability and Transport Mechanisms in Antiperovskite Li3OCl and Li3OBr Superionic Conductors, Chem. Mater., 2013, 25(23), 4663–4670 CrossRef CAS.
- R. Mouta, M. Á. B. Melo, E. M. Diniz and C. W. A. Paschoal, Concentration of Charge Carriers, Migration, and Stability in Li3OCl Solid Electrolytes, Chem. Mater., 2014, 26(24), 7137–7144 CrossRef CAS.
- R. Mouta, E. M. Diniz and C. W. A. Paschoal, Li+ Interstitials as the Charge Carriers in Superionic Lithium-Rich Anti-Perovskites, J. Mater. Chem. A, 2015, 4(5), 1–3 Search PubMed.
- Z. Lu, C. Chen, Z. M. Baiyee, X. Chen, C. Niu and F. Ciucci, Defect Chemistry and Lithium Transport in Li3OCl Anti-Perovskite Superionic Conductors, Phys. Chem. Chem. Phys., 2015, 17(48), 32547–32555 RSC.
- S. Stegmaier, J. Voss, K. Reuter and A. C. Luntz, Li+ Defects in a Solid-State Li Ion Battery: Theoretical Insights with a Li3OCl Electrolyte, Chem. Mater., 2017, 29(10), 4330–4340 CrossRef CAS.
- Z. Deng, B. Radhakrishnan and S. P. Ong, Rational Composition Optimization of the Lithium-Rich Li3OCl1−xBrx Anti-Perovskite Superionic Conductors, Chem. Mater., 2015, 27(10), 3749–3755 CrossRef CAS.
- M. H. Braga, A. J. Murchison, J. A. Ferreira, P. Singh and J. B. Goodenough, Glass-Amorphous Alkali-Ion Solid Electrolytes and Their Performance in Symmetrical Cells, Energy Environ. Sci., 2016, 9(3), 948–954 RSC.
- T. H. Wan, Z. Lu and F. Ciucci, A First Principle Study of the Phase Stability, Ion Transport and Substitution Strategy for Highly Ionic Conductive Sodium Antipervoskite as Solid Electrolyte for Sodium Ion Batteries, J. Power Sources, 2018, 390, 61–70 CrossRef CAS.
- J. A. Dawson, T. Attari, H. Chen, S. Emge, K. E. Johnston and S. Islam, Elucidating Lithium-Ion and Proton Dynamics in Anti-Perovskite Solid Electrolytes, Energy Environ. Sci., 2018, 11(10), 2993–3002 RSC.
- Y. Yu, Z. Wang and G. Shao, Theoretical Design of Double Anti-Perovskite Na6SOI2 as Super-Fast Ionic Conductor for Solid Na+ Ion Batteries, J. Mater. Chem. A, 2018, 6(40), 19843–19852 RSC.
- J. Zhu, S. Li, Y. Zhang, J. W. Howard, X. Lü, Y. Li, Y. Wang, R. S. Kumar, L. Wang and Y. Zhao, Enhanced Ionic Conductivity with Li7O2Br3 Phase in Li3OBr Anti-Perovskite Solid Electrolyte, Appl. Phys. Lett., 2016, 109(10), 101904 CrossRef.
- Y. Li, W. Zhou, S. Xin, S. Li, J. Zhu, X. Lü, Z. Cui, Q. Jia, J. Zhou and Y. Zhao, et al., Fluorine-Doped Antiperovskite Electrolyte for All-Solid-State Lithium-Ion Batteries, Angew. Chem., Int. Ed., 2016, 55(34), 9965–9968 CrossRef CAS PubMed.
- J. Zhu, Y. Wang, S. Li, J. W. Howard, J. Neuefeind, Y. Ren, H. Wang, C. Liang, W. Yang and R. Zou, et al., Sodium Ion Transport Mechanisms in Antiperovskite Electrolytes Na3OBr and Na4OI2: An in Situ Neutron Diffraction Study, Inorg. Chem., 2016, 55(12), 5993–5998 CrossRef CAS PubMed.
- Z. D. Hood, H. Wang, A. S. Pandian, J. K. Keum and C. Liang, Li2OHCl Crystalline Electrolyte for Stable Metallic Lithium Anodes, J. Am. Chem. Soc., 2016, 138(6), 1768–1771 CrossRef CAS PubMed.
- H. Fang, S. Wang, J. Liu, Q. Sun and P. Jena, Superhalogen-Based Lithium Superionic Conductors, J. Mater. Chem. A, 2017, 5(26), 13373–13381 RSC.
- H. Fang and P. Jena, Li-Rich Antiperovskite Superionic Conductors Based on Cluster Ions, Proc. Natl. Acad. Sci. U. S. A., 2017, 114(42), 11046–11051 CrossRef CAS PubMed.
- Z. Wang, H. Xu, M. Xuan and G. Shao, From Anti-Perovskite to Double Anti-Perovskite: Tuning Lattice Chemistry to Achieve Super-Fast Li+ Transport in Cubic Solid Lithium Halogen-Chalcogenides, J. Mater. Chem. A, 2017, 6(1), 73–83 RSC.
- J. A. Dawson, P. Canepa, T. Famprikis, C. Masquelier and M. S. Islam, Atomic-Scale Influence of Grain Boundaries on Li-Ion Conduction in Solid Electrolytes for All-Solid-State Batteries, J. Am. Chem. Soc., 2018, 140(1), 362–368 CrossRef CAS PubMed.
- G. Kresse and J. Furthmüller, Efficient Iterative Schemes for Ab Initio Total-Energy Calculations Using a Plane-Wave Basis Set, Phys. Rev. B: Condens. Matter Mater. Phys., 1996, 54(16), 11169–11186 CrossRef CAS.
- J. P. Perdew, K. Burke and M. Ernzerhof, Generalized Gradient Approximation Made Simple, Phys. Rev. Lett., 1996, 77(18), 3865–3868 CrossRef CAS PubMed.
- P. E. Blöchl, Projector Augmented-Wave Method, Phys. Rev. B: Condens. Matter Mater. Phys., 1994, 50(24), 17953–17979 CrossRef.
- G. Kresse and D. Joubert, From Ultrasoft Pseudopotentials to the Projector Augmented-Wave Method, Phys. Rev. B: Condens. Matter Mater. Phys., 1999, 59(3), 1758–1775 CrossRef CAS.
- H. Jónsson; G. Mills; K. W. Jacobsen, Nudged Elastic Band Method for Finding Minimum Energy Paths of Transitions in Classical and Quantum Dynamics in Condensed Phase Simulations, ed. B. J. Berne, G. Ciccotti, D. F. Coker, World Scientific, Singapore, 1998, pp. 385–404 Search PubMed.
- G. Henkelman and H. Jónsson, Improved Tangent Estimate in the Nudged Elastic Band Method for Finding Minimum Energy Paths and Saddle Points, J. Chem. Phys., 2000, 113(22), 9978–9985 CrossRef CAS.
- F. Aryasetiawan and O. Gunnarsson, The GW Method. Reports, Prog. Phys., 1998, 61(3), 237–312 CrossRef CAS.
- M. Shishkin and G. Kresse, Implementation and Performance of the Frequency-Dependent GW Method within the PAW Framework, Phys. Rev. B: Condens. Matter Mater. Phys., 2006, 74, 035101 CrossRef.
- T. Thompson, S. Yu, L. Williams, R. D. Schmidt, R. Garcia-Mendez, J. Wolfenstine, J. L. Allen, E. Kioupakis, D. J. Siegel and J. Sakamoto, Electrochemical Window of the Li-Ion Solid Electrolyte Li7La3Zr2O12, ACS Energy Lett., 2017, 2(2), 462–468 CrossRef CAS.
- D. S. Aidhy and C. Wolverton, First-Principles Prediction of Phase Stability and Crystal Structures in Li–Zn and Na–Zn Mixed-Metal Borohydrides, Phys. Rev. B: Condens. Matter Mater. Phys., 2011, 83(14), 144111 CrossRef.
- J. Schmidt, J. Shi, P. Borlido, L. Chen, S. Botti and M. A. L. Marques, Predicting the Thermodynamic Stability of Solids Combining Density Functional Theory and Machine Learning, Chem. Mater., 2017, 29(12), 5090–5103 CrossRef CAS.
- M. Yashima and R. Ali, Structural Phase Transition and Octahedral Tilting in the Calcium Titanate Perovskite CaTiO3, Solid State Ionics, 2009, 180(2–3), 120–126 CrossRef CAS.
- A. Munoz, J. A. Alonso, M. J. Martínez-Lope, M. T. Casáis, M. T. Ferna, J. L. Martínez and M. T. Fernández-Díaz, Evolution of the Magnetic Structure of Hexagonal HoMnO3 from Neutron Powder Diffraction Data, Chem. Mater., 2001, 13(5), 1497–1505 CrossRef CAS.
- Y. Bréard, H. Fjellvåg and B. Hauback, Investigation of Bixbyite Type Scandium Oxides Involving a Magnetic Cation: Sc2−xFexO3 (0 ≤ x ≤1), Solid State Commun., 2011, 151(3), 223–226 CrossRef.
- F. D. Murnaghan, The Compressibility of Media under Extreme Pressures, Proc. Natl. Acad. Sci. U. S. A., 1944, 30(9), 244–247 CrossRef CAS.
- R. D. Shannon, Revised Effective Ionic Radii and Systematic Studies of Interatomic Distances in Halides and Chalcogenides, Acta Crystallogr., Sect. A: Cryst. Phys., Diffr., Theor. Gen. Crystallogr., 1976, 32(5), 751–767 CrossRef.
- M.-H. Chen, A. Emly and A. Van der Ven, Anharmonicity and Phase Stability of Antiperovskite Li3OCl, Phys. Rev. B: Condens. Matter Mater. Phys., 2015, 91(21), 214306 CrossRef.
- Z. Rong, R. Malik, P. Canepa, G. Sai Gautam, M. Liu, A. Jain, K. Persson and G. Ceder, Materials Design Rules for Multivalent Ion Mobility in Intercalation Structures, Chem. Mater., 2015, 27(17), 6016–6021 CrossRef CAS.
- X. He, Y. Zhu and Y. Mo, Origin of Fast Ion Diffusion in Super-Ionic Conductors, Nat. Commun., 2017, 8, 1–7 CrossRef PubMed.
- P. R. Rayavarapu, N. Sharma, V. K. Peterson and S. Adams, Variation in Structure and Li+-Ion Migration in Argyrodite-Type Li6PS5X (X = Cl, Br, I) Solid Electrolytes, J. Solid State Electrochem., 2012, 16(5), 1807–1813 CrossRef CAS.
- C. Dietrich, D. Weber, S. J. Sedlmaier, S. Indris, S. Culver, D. Walter, J. Janek and W. Zeier, Lithium Ion Conductivity in Li2S-P2S5 Glasses – Building Units and Local Structure Evolution during the Crystallization of the Superionic Conductors Li3PS4, Li7P3S11 A, J. Mater. Chem. A, 2017, 5(34), 18111–18119 RSC.
- S. Yu and D. J. Siegel, Grain Boundary Contributions to Li-Ion Transport in the Solid Electrolyte Li7La3Zr2O12 (LLZO), Chem. Mater., 2017, 29(22), 9639–9647 CrossRef CAS.
- A. Sharafi, E. Kazyak, A. L. Davis, S. Yu, T. Thompson, D. J. Siegel, N. P. Dasgupta and J. Sakamoto, Surface Chemistry Mechanism of Ultra-Low Interfacial Resistance in the Solid-State Electrolyte Li7La3Zr2O12, Chem. Mater., 2017, 29(18), 7961–7968 CrossRef CAS.
- S. P. Ong, Y. Mo, W. D. Richards, L. Miara, H. S. Lee and G. Ceder, Phase Stability, Electrochemical Stability and Ionic Conductivity of the Li10±1MP2X12 (M = Ge, Si, Sn, Al or P, and X = O, S or Se) Family of Superionic Conductors, Energy Environ. Sci., 2013, 6(1), 148–156 RSC.
- M. A. Kraft, S. P. Culver, M. Calderon, F. Böcher, T. Krauskopf, A. Senyshyn, C. Dietrich, A. Zevalkink, J. Janek and W. G. Zeier, Influence of Lattice Polarizability on the Ionic Conductivity in the Lithium Superionic Argyrodites Li6PS5X (X = Cl, Br, I), J. Am. Chem. Soc., 2017, 139(31), 10909–10918 CrossRef CAS PubMed.
- W. Schirmacher, Theory of Diffusion and Ionic Conduction in Glass, Solid State Ionics, 1988, 28–30, 129–133 CrossRef.
- F. Tian, M. D. Radin and D. J. Siegel, Enhanced Charge Transport in Amorphous Li2O2, Chem. Mater., 2014, 26(9), 2952–2959 CrossRef CAS.
- C. D. Lorenz and R. M. Ziff, Precise Determination of the Bond Percolation Thresholds and Finite-Size Scaling Corrections for the Sc, Fcc, and Bcc Lattices, Phys. Rev. E: Stat. Phys., Plasmas, Fluids, Relat. Interdiscip. Top., 1998, 57(1), 230–236 CrossRef CAS.
- M. Natrella, NIST/SEMATECH e-Handbook of Statistical Methods, ed. C. Croarkin, P. Tobias, J. J. Filliben, B. Hembree, W. Guthrie, L. Trutna and J. Prins, NIST, Gaithersburg, MD, 2010 Search PubMed.
- S. Hull, D. A. Keen, N. J. G. Gardner and W. Hayes, The Crystal Structures of Superionic Ag3SI, J. Phys.: Condens. Matter, 2001, 13(10), 2295–2316 CrossRef CAS.
Footnote |
| † Electronic supplementary information (ESI) available: Unit cell of anti-perovskite Li3OCl; detailed migration mechanisms; Murnaghan equation of state; low-energy structures of model AP compounds; predicted parameters for the low-energy structures; band gap using GW methods; predicted bulk moduli and band gaps; example of F-centered compounds (Li3SF); comparison of elementary path barriers between distinct octahedra (Li3SI vacancy); example of migration pathway construction (Na3SeCl vacancy); histogram of elementary barriers (Li3SI vacancy); correlation between limiting barrier and decomposition energy; thermodynamic stability; correlations between the tolerance factor and the bond length difference; list of energies relative to convex hull; correlation between path width and elementary barriers. See DOI: 10.1039/c8ta10989c |
| This journal is © The Royal Society of Chemistry 2019 |