
 Open Access Article
 This Open Access Article is licensed under a
 Creative Commons Attribution 3.0 Unported Licence
Mg2+ storage and mobility in anatase TiO2: the role of frustrated coordination†
Kit
McColl
 and
Furio
Corà
*
and
Furio
Corà
*
Department of Chemistry, University College London, London, UK. E-mail: f.cora@ucl.ac.uk
First published on 30th January 2019
Abstract
Anatase TiO2 is a candidate high-power electrode material in Li-ion and Na-ion batteries and has been explored as a Mg battery cathode material, although Mg capacity in undoped anatase is limited. Here we use hybrid-exchange density functional theory calculations to investigate the underlying factors affecting Mg intercalation and mobility in anatase. We find that at the dilute limit, Mg ions have 5-fold coordinated insertion sites, and activation barriers for migration are a surprisingly low 537 meV. As the concentration of Mg inserted into the structure is increased, a cooperative distortion of the lattice occurs, contracting the c lattice parameter. The distortion results in stable orderings of Mg ions in sites which are 6-fold coordinated, but also results in migration barriers that exceed 1500 meV in Mg0.5TiO2 due to a collective relaxation of the host lattice. The total increase in barrier is predominantly a result of the stabilisation of the insertion sites, as opposed to a destabilisation of the activated sites along the migration pathway. The insertion sites in the dilute limit can be described as frustrated, and it is this unfavourable insertion geometry under dilute conditions that allows the Mg ions to migrate with low activation barriers. The limited performance for Mg2+ storage can therefore be attributed to the loss of frustrated coordination at high Mg concentration, which restricts Mg mobility and therefore capacity. Strategies to enhance the capacity of Mg in anatase should therefore aim to inhibit the c lattice parameter contraction or otherwise destabilise stable orderings of Mg in Mg0.5TiO2 to retain the frustrated coordination of Mg ions at high Mg concentrations.
1 Introduction
Magnesium batteries are an alternative to those using lithium-ion chemistry and are attractive for portable applications, potentially offering comparative or improved specific capacities to current Li-ion technology, and significant advances in volumetric capacity.1–3 Lithium metal anodes grow dendrites upon cycling, which ultimately lead to battery short circuiting.4 To avoid this issue, graphite is used as an intercalation host at the anode for Li-ion batteries, but this limits the anode volumetric capacity to ∼800 mA h cm−3. Magnesium metal anodes plate more uniformly upon cycling,5 and thus the intercalation host can be avoided at the anode end, enabling a volumetric capacity of 3833 mA h cm−3 for Mg metal.Mg is heavier and less electropositive than Li, but these deficits are compensated by its divalency and the reduced weight of a battery design that avoids the anode intercalation host, meaning specific capacities of Mg battery systems can approach or exceed those of Li-ion batteries using a graphite anode.2 Magnesium is also inherently safer than lithium in a battery system, and is far more abundant and cheaper than lithium, making it a more scalable technology for future energy storage solutions. Issues finding Mg battery electrolytes compatible with both electrodes remain,3 however a key bottleneck in the development of Mg batteries is the search for a suitable cathode material.2 Intercalation of divalent ions presents a number of challenges compared to monovalent ions. Multivalent cathode materials are more prone to conversion reactions, and this is a particular issue for Mg due to the high thermodynamic stability of MgO.2 Divalent Mg ions also experience a stronger electrostatic interaction with the anionic framework of the cathode host than Li ions, so despite their similar size, Mg ions typically experience significantly higher activation barriers for movement, leading to poor kinetics.6 Suitable cathode materials are therefore limited.
The pioneering work of Aurbach first demonstrated that Mg battery chemistry was possible, yet the Chevrel phase Mo6S8 cathode used offered a limited voltage.7 Since this work, extensive experimental and computational work has investigated materials that may be suitable for Mg intercalation cathodes, often motivated by their known performance as Li-ion intercalation hosts.2 One of the materials that has been the subject of numerous studies as Li intercalation host is TiO2.8–10 Despite not offering high operating voltages, the anatase11 and TiO2 (B)12 polymorphs of titania show good rate performance for Li intercalation, making them attractive for high power applications. Anatase TiO2 has also been explored as a possible cathode material for Na-ion batteries.13 As a Mg-battery cathode, intercalation to Mg0.5TiO2 provides a high theoretical capacity of 294.5 mA h g−1. Furthermore, anatase TiO2 displays excellent stability, and the low toxicity and high abundance of titanium make TiO2 an attractive sustainable battery material.
Comparatively, there has been little research on TiO2 polymorphs as a Mg battery material. Early work by Sheha achieved only limited capacities using an anatase cathode and a Mg anode.14 Su et al. used a LiBH4/Mg (BH4)2/tetraglyme electrolyte and a Mg metal anode to achieve a reversible low rate (0.2C) capacity of 145 mA h g−1, and 85 mA h g−1 at rates of 2C, with an anatase cathode demonstrating co-intercalation of Mg and Li.15 A similar hybrid Li+/Mg2+ electrochemical setup by the same group achieved pseudocapacitive storage of 115 mA h g−1 at 2C using a TiO2 (B) cathode.16 Meng et al. demonstrated a reversible capacity of 35 mA h g−1 in TiO2 (B) nanoflakes via a double-layer capacitive process in a Mg only arrangement. In contrast, a Li+/Mg2+ hybrid arrangement provided a capacity of 114 mA h g−1 at 1 A g−1, but predominantly via Li intercalation and surface pseudocapacitive charge storage, rather than Mg-intercalation.17 Zhang et al. found that in a Mg only battery design, electrochemical insertion of Mg was only possible up to a stoichiometry of Mg0.1TiO2 in commercially available anatase particles (<20 nm), giving a reversible capacity of 40 mA h g−1 after 50 cycles.18 Koketsu et al. reported that F− and OH− incorporation into anatase nanoparticles (∼5 nm) could enhance voltage, rate performance and capacity for Mg2+ insertion (∼165 mA h g−1 at a rate of 20 mA g−1), and also allow the reversible insertion of Al3+ ions.19 The anatase was determined to have a high concentration (∼22%) of Ti4+ vacancies to charge balance substitution of F− into O2− sites, and these sites were identified as the origin of the improved capacity, whilst also offering a vacancy-mediated diffusion mechanism, and increased insertion energies.20 Li-insertion rates into this Ti-deficient system were also shown to be enhanced in a separate work by the same group.21 Recently, Sheng et al. demonstrated that V-doped anatase nanoparticles (∼10 nm) could sustain a capacity of 121.9 mA h g−1 at 20 mA g−1. The introduction of V was predicted by calculations to provide enhanced voltages compared to undoped TiO2. However the charge storage was predominantly of a faradaic pseudocapacitive type, rather than a diffusion-controlled intercalation mechanism.22
The enhanced capacity reported by Koketsu et al. suggests that there may be doping strategies that can make anatase a viable Mg battery cathode material. Conveniently, doped anatase has been studied as a Li-ion battery electrode material in previous experimental literature, and with improvements and changes in performance noted for a range of dopants including Ni,23 Nb,24,25 Sn,26 Fe,27 and Mo,28 providing an indication of routes to explore. However for doping strategies to be rationally designed, the origin of the limited performance for undoped anatase should be fully understood.
Here we employ hybrid density functional theory calculations to address this problem. We investigate the insertion geometry of Mg, voltage and ion mobility at dilute concentrations. We then assess how these properties change as further Mg is added to the structure. Finally, we discuss doping strategies that may be suitable to enhance the limited experimentally observed capacity.
2 Computational methods
First-principles calculations were performed using the periodic density functional theory (DFT) code CRYSTAL17.29,30 Electronic exchange and correlation were approximated using the hybrid-exchange functional B3LYP, which is known to give accurate estimates of the band structure of metal oxide systems with highly correlated electrons,31 and is efficiently implemented in the CRYSTAL code. Furthermore, hybrid functionals have been shown to give improved accuracy over semilocal DFT for the calculation of migration barriers for Mg ions in metal oxides.32 All-electron atom-centered Gaussian basis sets were used for all atoms, available from the CRYSTAL online database (www.crystal.unito.it), indicated by the following labels online: Ti (Ti_86-411(d31)G_darco), O (O_8-411d1_cora_2005), Mg (Mg_8-511d1G_valenzano_2006). The Coulomb and exchange series were truncated with thresholds of 10−7, 10−7, 10−7, 10−7 and 10−14. Reciprocal space was sampled using a Pack–Monkhorst net,33 with a shrinking factor of IS = 8 along each periodic direction. The self-consistent field (SCF) procedure was performed up to a convergence threshold of ΔE = 10−8 Hartree per unit cell. Full geometry optimisations (lattice parameters and atomic positions) were performed using the default convergence criteria in CRYSTAL17. Grimme's semi-empirical D3 scheme34–36 to account for the effects of dispersion was used to give an improved structural description of anatase (Table S1†). The average insertion energy per Mg (Eins) was determined with reference to metallic Mg according to: [E(MgxTiO2) − E(TiO2) − xE(Mg(s))][x]−1. The intercalation voltage (V) was calculated according to: −[Eins][2e]−1, where e is the electronic charge. The calculation of metallic Mg is unsuited for hybrid functionals. To evaluate the energy of metallic Mg, we calculated the energy of a single Mg2+ ion, and added the experimentally determined energy of sublimation and the first and second ionisation energies: E(Mg(s)) = E(Mg2+) + Esub(Mg(s)) + Ei(1)(Mg) + Ei(2)(Mg). Activation barriers for ion migration were determined by performing a set of constrained geometry optimisations, with full details of these described in the ESI.† All calculations presented in the main text are spin-polarised, with a ferromagnetic ordering of Ti3+ ions where applicable. A discussion of this approximation, its validity and additional calculations to support these results are included in the ESI.†3 Results
3.1 Structure of anatase TiO2
Anatase TiO2 adopts a tetragonal crystal structure, space group I41/amd, (no. 141) with crystallographic unit cell lattice parameters a = b = 3.7845 Å, c = 9.5143 Å. The structure is reproduced to an excellent degree of accuracy by the B3LYP-D3 calculations, with lattice parameters of a = b = 3.7663 Å, c = 9.5733 Å and an error on the unit cell volume of −0.3% relative to experiment. Anatase consists of distorted TiO6 octahedra, in which opposite equatorial Ti–O bonds are displaced off their plane in the same ±z direction (Fig. 1). Each TiO6 octahedron shares two pairs of edges in the [103] and [013] planes, and four corners with neighbouring octahedra in the x and y directions. This framework results in interstitial sites that have an octahedral environment of O-ions surrounding them (Fig. 2a). These octahedral interstitial sites are linked by tunnels in the x and y directions, and by percolating pathways in the z direction.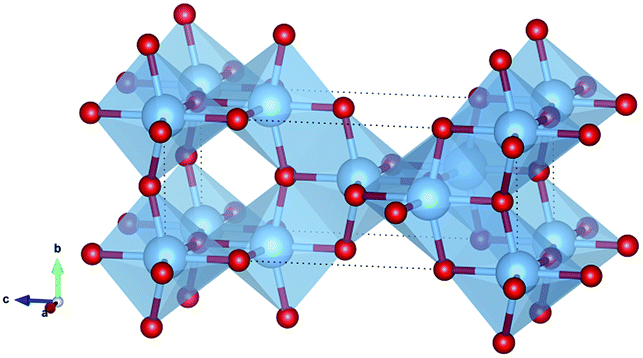 | ||
| Fig. 1 Structure of anatase TiO2. Ti atoms are blue and O red. | ||
 | ||
| Fig. 2 Mg insertion geometry under dilute conditions. (a) Unstable geometry of Mg at the centre of the octahedral insertion site. (b) Stable geometry found by displacement from the centre of the site. Ti atoms are blue, Mg gold and O red. | ||
3.2 Mg2+ insertion at dilute concentrations
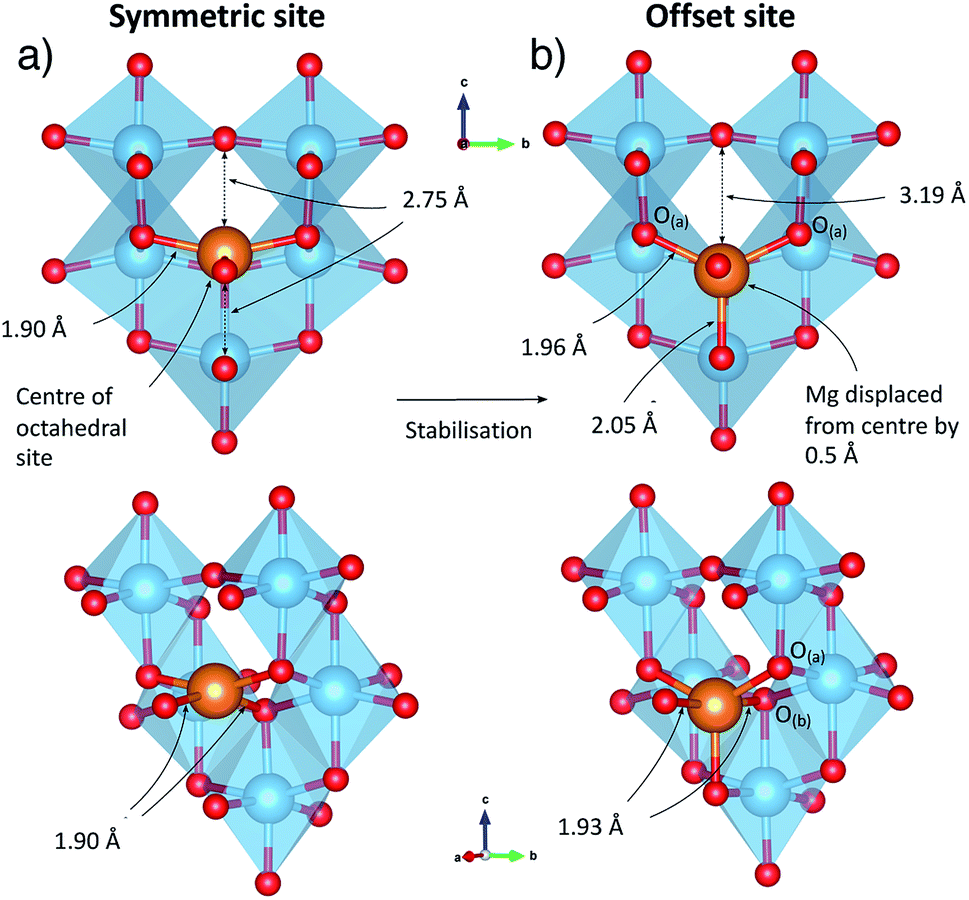
To understand the behaviour of Mg in anatase at the dilute limit, we initially investigated the introduction of a single Mg ion into an approximately cubic 32 cation unit cell of anatase TiO2, generated by a expansion of the crystallographic cell. This construction leaves a distance of ∼10 Å between each Mg ion, and corresponds to a concentration of ∼Mg0.03TiO2. Insertion of Mg2+ takes place preferentially into the octahedral hole sites,37 similar to Li and Na ions. We find that the Mg ion is displaced away from the symmetric centre of the site, by 0.5 Å in the (±)z direction. This displacement is consistent with previous investigations of Mg in anatase,37 and similar observations for Li and Na ions in anatase.38–43
The local geometry of the Mg ion is indicated in Fig. 2. Mg–O bond distances for Mg located in the geometric centre of the octahedral hole are 1.90 Å in the xy plane and 2.75 Å in the z direction. The displacement from the centre of the octahedral hole site results in a 5-fold distorted square pyramidal coordination, with Mg–O distances of 2.055 Å to the peak of the pyramid, and four further bonds of 1.959 Å and 1.953 Å to ions we label O(a), and 1.939 Å and 1.935 Å to O(b). The Mg–O distance across the octahedral centre is 3.18 Å.
The calculated intercalation energy for a single Mg ion is −1.13 eV. This is in reasonable agreement with Koketsu et al. who find a value of −1.02 eV using GGA + U.19 Legrain et al. find the insertion energy to be −1.74 eV using GGA, which however misrepresents electronic localisation on reduced Ti3+.37
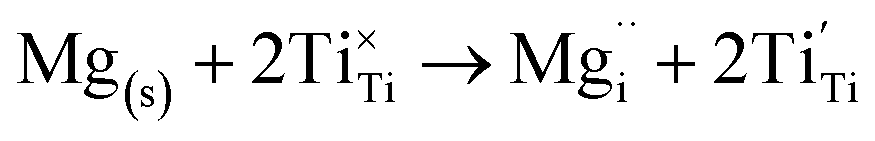
The insertion of an Mg2+ ion introduces two electrons for charge balance, which localise on two separate Ti ions (Fig. S2†), reducing them formally to Ti3+, according to the following equation (in Kröger–Vink notation):
 | (1) |
The Ti–O bond lengths of these reduced Ti ions are modified (Table S2†) by a combination of electrostatic distortion due to the insertion of the positively charged Mg ion, and the electrons localised on each Ti3+. The electronic density of states of TiO2 and Mg0.03TiO2 are indicated in Fig. S1 and S3.† The two Ti ions reduced upon insertion of Mg result in a split double defect state ∼0.8 eV below the conduction band edge.
Upon insertion of Mg to form Mg0.03TiO2, the lattice parameters of anatase change with an expansion of the a and b parameters by +1.4% and +0.4% respectively (where the a direction is along the Mg–O(a) bonds). The c parameter contracts by −0.8%.
3.3 Defining Mg2+ mobility pathways in the dilute limit
The anatase structure has tunnels extending in the x and y directions, connecting octahedral insertion sites. Ions can migrate along these tunnels, hopping from site to site in a zig-zag fashion, with a jump distance of 2.36 Å between each site. The line drawn between adjacent sites follows the shared edge of two octahedral TiO6 units, when the structure is viewed normal to the direction of motion (Fig. 3A). We denote these jumps as pathway 1. Under dilute conditions, ions migrating using this pathway can achieve only 1D mobility. | ||
| Fig. 3 Migration pathways and routes to net 2D and 3D mobility in anatase under the conditions of dilute Mg insertion concentration. (a) Pathway 1. (b) Pathway 2. (c) Illustration of how 1D, 2D and 3D mobility is achieved using a combination of pathways 1 and 2. | ||
Tunnels extending in the x and y direction intersect at the octahedral insertion sites. However since Mg ions in these sites are displaced from the centre, this means that under dilute conditions they only occupy a single tunnel extending in one direction (x or y) at any moment. To move between tunnels, Mg ions must jump across the centre of the insertion site (Fig. 3B) which we denote as pathway 2. The hop distance for pathway 2 is 1.01 Å, which corresponds to twice the distance that the Mg ions relax away from the centre of the site (Fig. 2). Moving between tunnels allow ions to migrate on a 2D [001] plane. Using an alternating combination of pathways 1 & 2, Mg ions can achieve mobility in the z direction, and thus 3D mobility is possible. As we shall discuss later, structural changes reduce the length of pathway 2 to zero at high Mg2+ concentrations, and 3D mobility can be achieved directly by hops between octahedral insertion sites, along what is effectively only pathway 1. The activation barrier for pathway 2 (221 meV) is lower than for pathway 1 (537 meV) under dilute Mg conditions, it is therefore not rate limiting and for these reasons we will not discuss pathway 2 further.
3.4 Mg2+ activation barriers at dilute concentrations
The migration energy profile along pathway 1 is indicated in Fig. 4, as a function of path length (2.36 Å). The profile shows a local maximum at 38% path length, which constitutes the activated site, followed by a slight decrease that appears as a plateau region. At 50% path length there is a metastable intermediate site. The second half of the migration profile is symmetric to the first half. The activation barrier for the site at 38% path length is 537 meV, and the energy of the metastable site at 50% path length is 506 meV.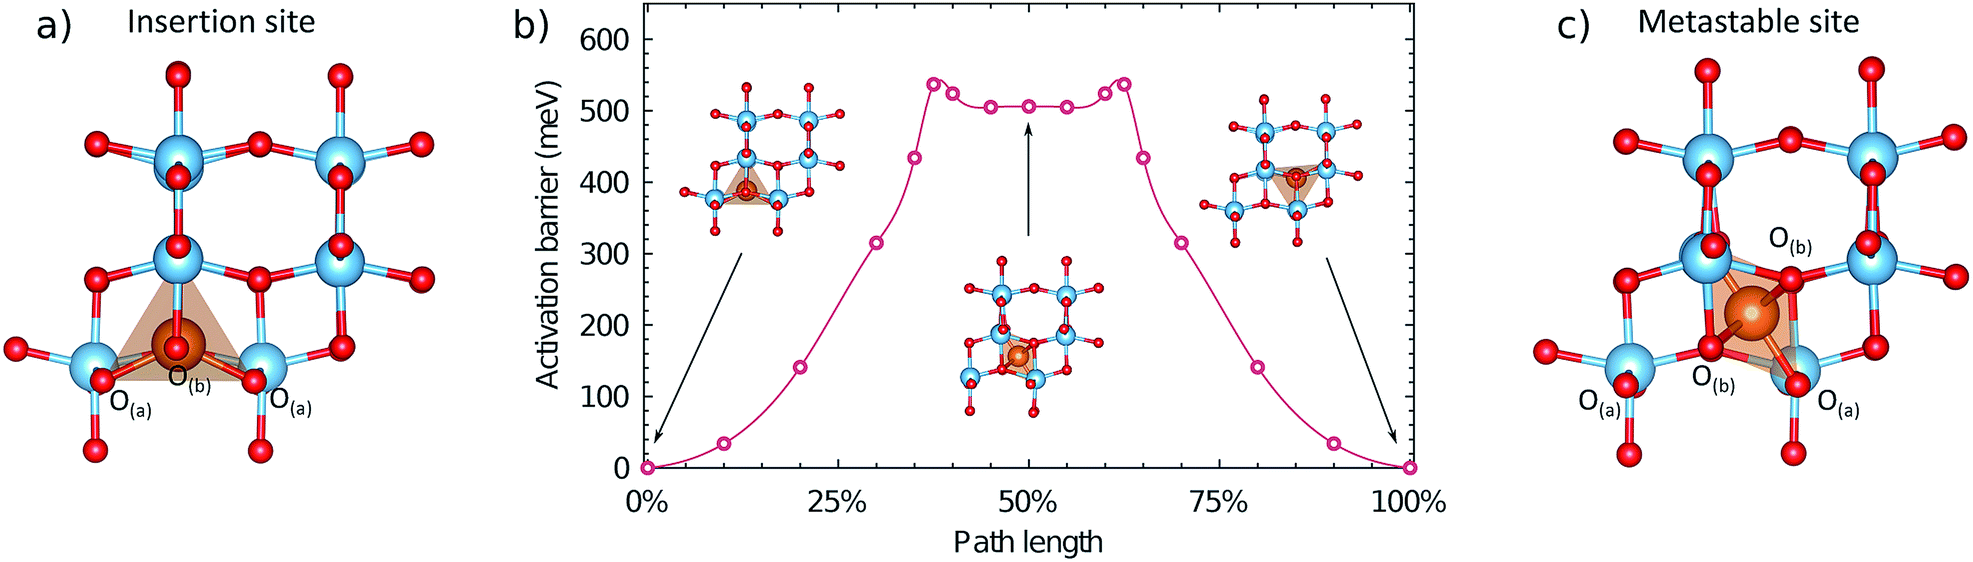 | ||
| Fig. 4 Local geometry and energetics of the Mg ion along the migration profile under a dilute concentration of Mg. (a) Geometry of the Mg ion in the stable insertion site. (b) Energetics of the Mg ion along the migration pathway, indicating the geometry in the stable and metastable sites. (c) Geometry of the Mg ion in the metastable site at 50% path length. A more detailed description of the local geometry of the Mg ion in the activated and metastable sites is provided in the ESI.† | ||
In the metastable intermediate site the Mg ion is 6-fold coordinated, in a distorted octahedral environment (Fig. S5†). In the activated site the Mg ion has a similar coordination (Fig. S6†), but with a non-linear O–Mg–O axial bond angle of 170°, and a closer proximity to the two O(a) ions it was initially coordinated to. The difference between the geometry of the two sites is relatively small however, resulting in the small energy difference (31 meV). If viewed normal to the direction of migration, the pathway the Mg ion takes in the structure is sinusoidal, rather than linear, and thus does not strictly follow the line of the shared octahedral edge. Initially the Mg ion moves towards the O-ion at the end of the Mg–O pyramid, in the c direction, compressing the Mg–O bond to 1.914 Å (from 2.054 Å), but retaining a five-fold coordination with a bond of 2.06 Å to the O(b) ion along the b axis opposite to the direction of motion. Crossing the activation barrier, the Mg ion moves in the b direction, breaking the bond to the more distant O(b) ion, but forming new bonds with two O(a) ions to achieve a 6-fold coordination. In the plateau region, the Mg ion has 6-fold coordination, and the second half of the pathway is a reflection of the first. The change in coordination number along the pathways at the dilute limit is therefore 5 → 6 → 5.
The barrier of 537 meV is relatively low for Mg-ion mobility in a cathode material, and is similar to that of Li mobility in anatase (500 meV) under dilute conditions.44 Generally activation barriers predicted for the migration of multivalent ions are significantly higher than for Li migration, due to the stronger electrostatic interactions between the multivalent ion and the anionic framework of the cathode.2 The barrier of 537 meV corresponds to a diffusivity (D) of ∼4.5 × 10⁻¹² cm2 s−1, assuming an Arrhenius-like activated process, D = va2![[thin space (1/6-em)]](https://www.rsc.org/images/entities/char_2009.gif) exp(−Em/kT), where v is the jump frequency (≈1012 s−1), a is the jump distance (2.36 Å for anatase) and Em is the activation barrier.6 We note that such an assumption neglects any contribution from Coulombic interactions between Mg ions and electrons localised upon Ti3+ ions (small polarons), which are known to contribute to limited diffusion for Li-ion cathode materials45 and may affect the mobility of Mg ions.46,47 For comparison with anatase, the Mg diffusion barriers in the α and δ polymorphs of V2O5, which is considered one of the most promising oxides for Mg ion battery cathodes2 are ∼1100 and ∼600 meV respectively.48,49 Similarly low barriers to that of anatase, of ∼600–800 meV have been identified in spinel-structured oxides.50 Interestingly, the migration barrier we find in anatase TiO2 is similar in magnitude to the lowest barrier found for Mg mobility in layered α-MoO3 (580 meV). This migration pathway in α-MoO3 is not between the layers, but rather an intra-layer pathway that takes a similar route along the line of shared octahedral edges, between 5-coordinated stable sites.51 It has been estimated by Rong et al. that for adequate battery operation, migration barriers for ion mobility must be below ∼525 meV for micron-sized particles, and ∼650 meV for nanoparticles.6 The barrier for Mg diffusion in anatase under dilute conditions falls below this limit for nano-size particles.
exp(−Em/kT), where v is the jump frequency (≈1012 s−1), a is the jump distance (2.36 Å for anatase) and Em is the activation barrier.6 We note that such an assumption neglects any contribution from Coulombic interactions between Mg ions and electrons localised upon Ti3+ ions (small polarons), which are known to contribute to limited diffusion for Li-ion cathode materials45 and may affect the mobility of Mg ions.46,47 For comparison with anatase, the Mg diffusion barriers in the α and δ polymorphs of V2O5, which is considered one of the most promising oxides for Mg ion battery cathodes2 are ∼1100 and ∼600 meV respectively.48,49 Similarly low barriers to that of anatase, of ∼600–800 meV have been identified in spinel-structured oxides.50 Interestingly, the migration barrier we find in anatase TiO2 is similar in magnitude to the lowest barrier found for Mg mobility in layered α-MoO3 (580 meV). This migration pathway in α-MoO3 is not between the layers, but rather an intra-layer pathway that takes a similar route along the line of shared octahedral edges, between 5-coordinated stable sites.51 It has been estimated by Rong et al. that for adequate battery operation, migration barriers for ion mobility must be below ∼525 meV for micron-sized particles, and ∼650 meV for nanoparticles.6 The barrier for Mg diffusion in anatase under dilute conditions falls below this limit for nano-size particles.
3.5 Mg insertion at higher concentrations
Despite the comparatively low activation barrier amongst Mg-ion oxide cathode materials, and thus relatively high Mg diffusivity that may be expected at a dilute concentration of Mg, experimental evidence indicates that insertion of Mg into undoped anatase is limited.19,52 The limitation could be of a thermodynamic origin, whereby additional insertion of Mg beyond Mg0.03TiO2 becomes thermodynamically unfavourable. We have therefore investigated the energetics of insertion of additional Mg into the structure. Geometry optimisations were performed on all symmetry inequivalent configurations of Mg in a (2 × 1 × 1) unit cell of MgxTiO2 between 0 < x < 0.5, generated using the CRYSTAL code,53 and the insertion energies per Mg calculated. We find that the addition of Mg remains energetically favourable (Fig. 5) up to Mg0.5TiO2. In fact as the concentration of Mg is increased in the structure, its intercalation energy becomes increasingly favourable. This will be discussed in greater detail later.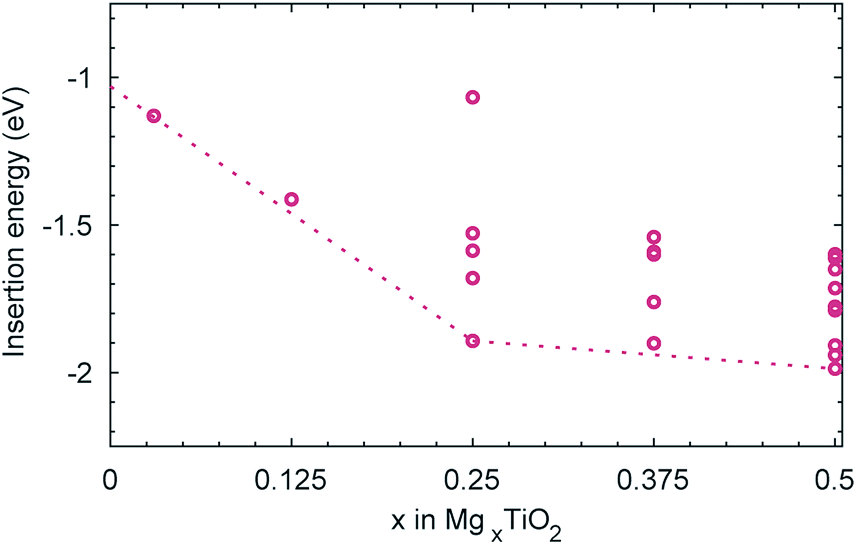 | ||
| Fig. 5 Insertion energies per Mg for each of the symmetry inequivalent configurations of MgxTiO2 (0 < x < 0.5) in a (2 × 1 × 1) unit cell. The energy of the Mg0.03TiO2 cell is also included. The dotted line links the ground state configurations at each composition and is extrapolated to Mg0TiO2. | ||
Since the thermodynamics allow additional Mg insertion, the limited capacity observed experimentally may therefore have a kinetic origin. In the anatase LixTiO2 system, insertion of Li leads to a stable ordering at Li0.5TiO2 and a tetragonal to orthorhombic distortion with increasing Li content.54 The orthorhombic distortion yields significantly reduced Li mobility,44 and insertion of Li into bulk anatase particles is often limited to Li0.5TiO2–Li0.6TiO2, with phase segregation into Li-rich and Li-poor regions.38,39,44 We therefore continue our investigation, considering whether similar structural changes occur in the MgxTiO2 system.
3.6 Phase segregation
Fig. 6 reports the formation energies of the Mg configurations considered in the (2 × 1 × 1) cell, calculated according to: E(MgxTiO2) − xE(Mg0.5TiO2) − (0.5 − x)E(TiO2), where E(Mg0.5TiO2) is the ground state configuration for x = 0.5. The formation energies of all configurations with 0 < x < 0.5 are positive, indicating that intercalation of Mg proceeds via phase-segregation, forming TiO2 and Mg0.5TiO2, rather than a solid-solution process. The average voltage profile for Mg intercalation, due to the phase-segregation behaviour, occurs as a single plateau at 1.0 V as the concentration of Mg varies, in reasonable agreement with the charge/discharge curve reported experimentally.52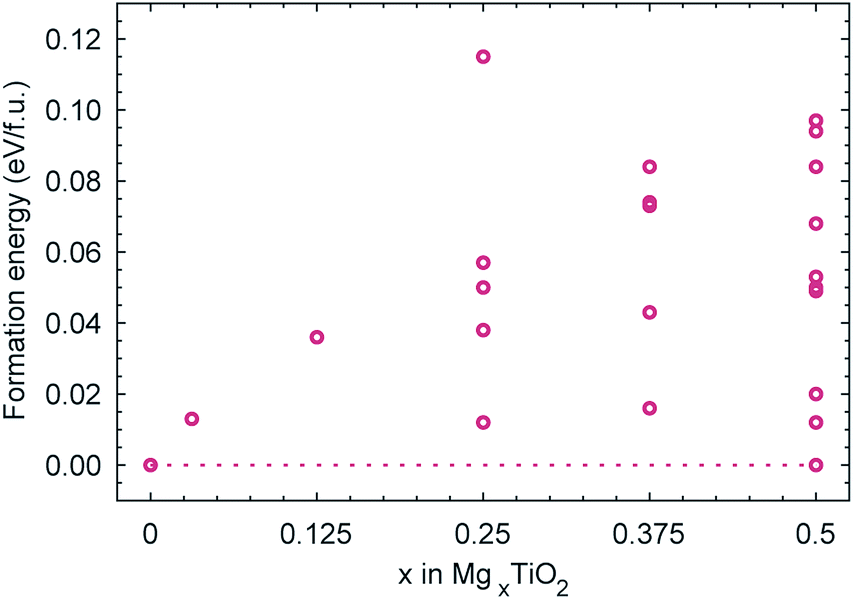 | ||
| Fig. 6 Calculated formation energies of MgxTiO2 structures. The dotted line links the ground state configurations for TiO2 and Mg0.5TiO2. | ||
3.7 Structural changes upon Mg insertion
Fig. S4–S6† show the evolution of the anatase lattice parameters for the MgxTiO2 structures as x varies in the (2 × 1 × 1) cells. As the concentration of Mg increases, the a lattice parameter increases from ∼3.7 Å to ∼4.2 Å. Of the structures, the most stable are those with the greatest value of a. The b lattice parameter also increases from ∼3.7 Å to ∼4.0 Å, but the lowest energy structures are those with the smallest value of b. This indicates that the structure is most stable with a high a/b ratio, i.e. when it undergoes a tetragonal to orthorhombic distortion. This can be confirmed by plotting the energy of each structure against its a/b ratio at each composition (0.25 < x < 0.5) (Fig. S7–S9†). The trends show that the most stable structures have the highest a/b ratio (i.e. have the greatest orthorhombic distortion). MgxTiO2 therefore undergoes a similar structural distortion to the LixTiO2 system. The distortion from TiO2 to Mg0.5TiO2 is illustrated in Fig. 7. The structure experiences a significant c parameter contraction (>9%) with increasing x in MgxTiO2. We now aim to understand how these structural distortions affect the mobility of Mg ions.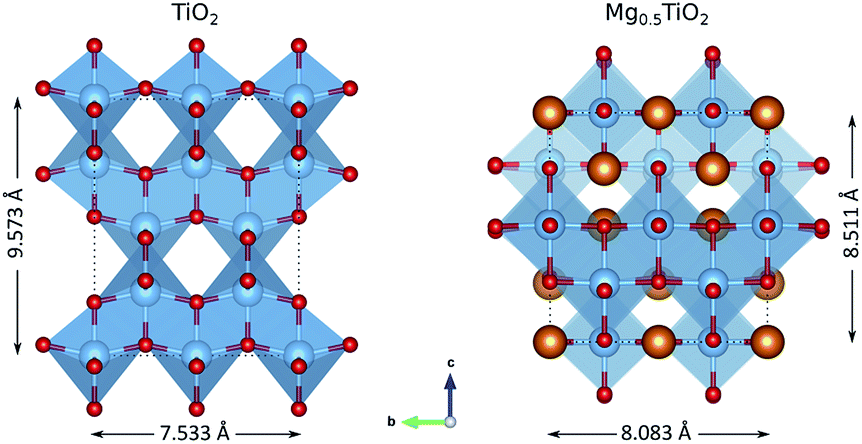 | ||
| Fig. 7 Structural changes between TiO2 and Mg0.5TiO2, illustrated with a (2 × 2 × 1) unit cell. The Mg0.5TiO2 ordering shown is the most stable calculated (Fig. S13b†). | ||
3.8 Mg2+ ordering in Mg0.5TiO2
The theoretical maximum capacity of Mg in TiO2 is 0.5 Mg ions per formula unit (Mg0.5TiO2, with all the Ti ions reduced to Ti3+). There are 10 symmetry unique Mg ordering configurations in the (2 × 1 × 1) cell. These structures are indicated in Fig. S13,† along with their calculated energies, relative to the most stable configuration. The three lowest energy configurations are indicated in Fig. S13a–c.† These are all structures that contain the maximum number of Mg–Mg pairs in sites sharing octahedral edges on the xz plane, an ordering that is also predicted to be stable in Li0.5TiO2.543.9 Mg2+ coordination in Mg0.5TiO2
Fig. 8 indicates the local geometry of Mg ions in the lowest energy ordering of Mg0.5TiO2 (Fig. S13b†). Each Mg ion is 6-fold octahedrally coordinated, with two ‘axial’ bonds of ∼2.15–2.26 Å along the c axis, and two shorter (∼2.00 Å) and two longer (∼2.04 Å) equatorial bonds. This contrasts with the 5-fold coordination for Mg ions in Mg0.03TiO2 (Fig. 2). The change from 5 to 6 fold coordination is due to the structural distortion that occurs as the concentration of Mg is increased.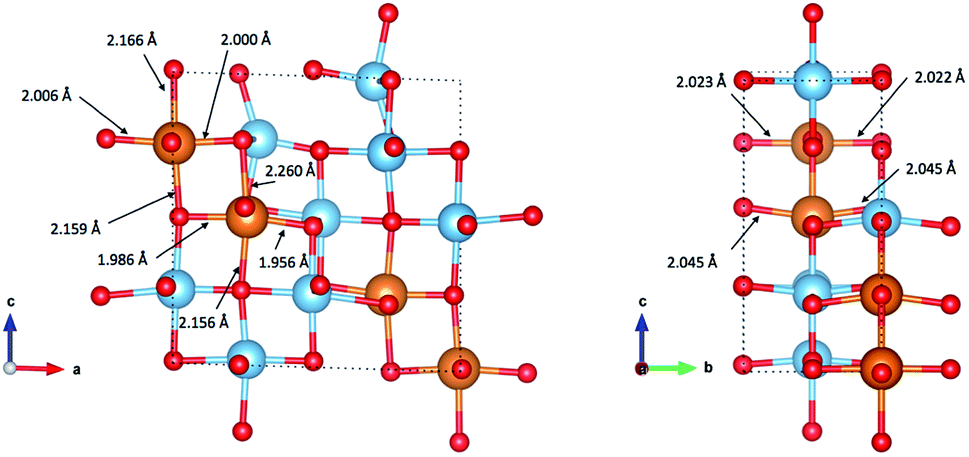 | ||
| Fig. 8 Coordination of Mg ions in the lowest energy configuration of Mg0.5TiO2 illustrated in Fig. S13b.† Mg–O bond lengths are indicated by arrows pointing to the bonds. | ||
As noted earlier, not only does the structure undergo an orthorhombic distortion, but there is also a significant contraction in the c lattice parameter by −10.7% (Table S3†) as the Ti3+ ions adopt a more regular octahedral coordination. It is this c axis contraction that allows the Mg ions to coordinate to both O-ions along the c axis of the octahedral hole in Mg0.5TiO2. This coordination is not possible in Mg0.03TiO2, where the distances from the centre of the octahedral interstitial site to the O-ions along the c axis are too long for efficient contact for ions the size of Mg2+ and Li+. Under those conditions, the Mg2+ ion relaxes towards one O-ion and is thus 5-fold coordinated (Fig. 2). A cooperative effect at higher concentrations of Mg in the structure is required to contract the lattice along the c axis enough for each inserted Mg ion to be able to achieve 6-fold coordination.
As it has been noted earlier, and indicated in Fig. 5, the energy gained upon insertion of each Mg ion increases as the concentration of Mg is increased. We can therefore conclude that the 6-fold coordination of the Mg ions is more favourable than the 5-fold coordination at the dilute limit, and it is the structural distortion upon increasing Mg concentration that stabilises further the inserted Mg ions. Specifically it is the contraction of the c parameter that allows the more stable 6-fold coordination to be achieved for each Mg ion.
3.10 Mg2+ mobility in Mg0.5TiO2
To understand mobility of Mg in the fully intercalated structure, we chose the lowest energy ordering (Fig. S13b†) as our initial structure, and considered a 32 Ti-cation ordered cell of Mg0.5TiO2, equivalent to the expansion of the unit cell used for the dilute limit insertion and mobility calculations. As the maximum capacity of Mg0.5TiO2 requires only half the insertion sites to be filled, there are vacant sites into which Mg ions can move. From our starting geometry, there are therefore 3 possible symmetry inequivalent pathways that Mg ions can follow, two in the xz direction, and one in the yz direction, indicated in Fig. S14.†
Fig. 9 indicates the activation barriers for each of these pathways, compared with the barrier for mobility at the dilute limit. The barriers in Mg0.5TiO2 are 2120, 1710 and 1639 meV, for pathways (i), (ii) and (iii) respectively, the lowest of which corresponds to ∼17 orders of magnitude reduction in Mg diffusivity at room temperature, compared to Mg0.03TiO2 (537 meV), if Arrhenius-like behaviour is assumed. These significantly increased barriers are likely to be the origin of the low Mg capacities observed experimentally. We note that ions moving along pathway (i) hop to sites that are similar in energy to the initial Mg position (+51 meV), whereas Mg ions moving along pathways (ii) and (iii) reach sites that are 660 and 880 meV higher in energy respectively than their starting positions. This mean that Mg ions moving from less favourable sites to the stable sites will have lower barriers to overcome (∼980 meV and ∼650 meV for the reverse of pathways (ii) and (iii) respectively). This behaviour will tend to favour the formation of stable Mg-rich ordered regions, whereby Mg ions will be pinned to stable lattice configurations and it will be difficult for Mg ions to be extracted from these regions. These observations complement the results of the formation energy calculations (Fig. 6a), which indicates a preference for phase segregation into TiO2 and Mg0.5TiO2 regions.
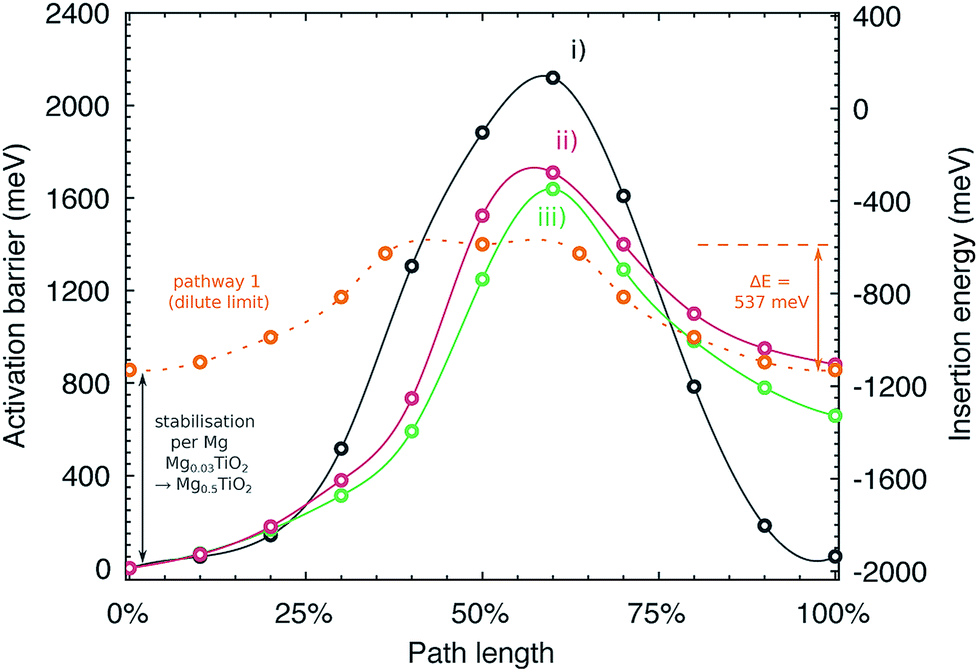 | ||
| Fig. 9 Activation barriers for Mg moving along three possible symmetry inequivalent pathways in Mg0.5TiO2. The y axes are plotted indicating the activation barrier with respect to the most stable Mg site in Mg0.5TiO2 (left), and the insertion energy per Mg ion (right). Pathways (i)–(iii) are defined in Fig. S14 of the ESI.† Also plotted for reference (against insertion energy) is the barrier for Mg moving along pathway 1 under dilute conditions (Mg0.03TiO2), smoothed for clarity. | ||
3.11 Origin of the increased barriers in Mg0.5TiO2
The migration barrier in a material is defined by the difference in energy for the migrating ion in its stable and activated sites. Generally for Li and Mg ion cathode materials, activation barriers are higher in the full (i.e. fully discharged) lattice limit by 10's to a few 100's of meV over the empty (fully charged) lattice limit.6,46,48,55–57 The increases are usually attributed to a relative destabilisation of the activated sites in the full lattice limit due to structural distortions caused by intercalant incorporation. In anatase TiO2, the migration barrier increases for Mg (as also identified for Li by Belak et al.44) from the empty to the full lattice limit by over 1 eV.As indicated in Fig. 5, Mg ions become more stabilised (i.e. their insertion energies become more negative) as the concentration of Mg in the structure is increased, and this can be attributed to a more favourable 6 fold coordination for the Mg ions in Mg0.5TiO2. As the Mg ions become more stabilised, the energy difference between the insertion sites and the activated sites increases, and so does the activation barrier.
It is instructive to consider the energetics of the Mg ions relative to metallic Mg to provide a consistent scale of their stability (Fig. 9, right hand y axis). In this energy frame, the transition state energy in the Mg0.03TiO2 and Mg0.5TiO2 phases is similar. The change in activation barrier (∼1100 meV) between pathway 1 in Mg0.03TiO2 and pathways (ii) and (iii) in Mg0.5TiO2 is due mainly to the Mg stabilisation in Mg0.5TiO2 as measured by the increased insertion energy per ion (∼900 meV) between these two concentrations. The energy of the activated site varies by only ∼250 meV. Thus, for pathways (ii) and (iii) it is the stabilisation of the insertion sites, rather than the destabilisation of the activated sites at high Mg concentrations that make the most substantial contribution to the increase in activation barriers.
We also note that pathways (ii) and (iii) connect intercalation sites of non-equal energy in Mg0.5TiO2, i.e. stable 6-coordinated sites and less stable 5-fold coordinated sites.
The existence of stabilised and destabilised sites adjacent to each other suggests that the distortions that result in stabilisation of certain sites are fairly localised. This result indicates that if cooperative distortions of the anatase lattice that yield 6-fold coordinated sites can be prevented, migration barriers for Mg ions in the Mg0.5TiO2 lattice could be reduced significantly. This would result in higher Mg mobility at high Mg concentration in anatase and allow for greater capacity.
Whilst the stabilisation of Li insertion sites has not been explicitly addressed as the origin for the substantial increases in activation barriers for Li moving in LixTiO2 at high Li concentrations,44 the displacement of Li ions from the centre of the octahedral insertion site, structural distortions and increase in insertion energy per Li between 0 < x < 0.5 follow the same trends as we describe here for Mg,41,54 and we therefore suggest the behaviour is equivalent. It follows from this that strategies to improve Mg capacity in anatase may also be applicable for improving Li storage capacity.
3.12 Discussion: the role of frustration
The results presented above indicate that under dilute concentrations of Mg in anatase, the insertion sites for Mg are effectively ‘frustrated’. The interstitial site is not a regular octahedron, instead it is tetragonally extended along the c direction and is too large for Mg ions to find a favourable coordination. They therefore achieve a frustrated 5-fold coordination, and diffusion of Mg ions between frustrated sites leads to lower activation barriers. This ceases to be the case at higher concentrations of Mg as contraction of the c parameter reduces the tetragonal extension along the c direction.The use of structures in which Mg ions have ‘frustrated’ or ‘non-ideal’ coordination has been proposed as a design principle for achieving high Mg ion mobility.6 Frustrated coordination has to date predominantly been identified as a property of metastable polymorphs,47 such as Mn2O4 spinel.50 A further example is the metastable tunnel bronze ζ-V2O5 phase, which has been demonstrated as a viable Mg ion cathode material,58 and is predicted by DFT calculations to have low activation barriers (620–860 meV) for Mg mobility.46 In fact it has been suggested that insertion of multivalent ions into frustrated coordination sites ‘almost certainly’ requires a structure that is thermodynamically metastable.6 Whilst metastable phases like the V2O5 tunnel bronzes may be favourable for high ion mobility, if they are significantly higher in energy than the ground state polymorphs (α-V2O5), they may be prone to phase transitions under repeated electrochemical cycling, or conversion reactions.2
The identification of frustrated coordination for Mg ions in anatase, and the indication of similar effect for Li-ions, thus indicates that frustration is not a property unique to materials that would generally be classed as metastable phases. Rutile is the ground state polymorph of TiO2 under ambient conditions, but the energy difference between anatase and rutile is small.59,60 Anatase TiO2 has high thermal and chemical stability, does not readily undergo transformation to rutile, and is not generally considered ‘metastable’ in the same way as, for example, chemically de-intercalated tunnel bronze structures.47
Anatase TiO2 therefore provides a stable structure in which frustrated coordination of Mg (and Li-ions) occurs under dilute conditions and this leads to low migration barriers for the ions. The limitation of the anatase structure is therefore not its stability under cycling, but the loss of frustrated coordination at high Mg (or Li) concentrations.
Strategies to increase the electrochemical performance of anatase as a Mg (or Li) ion cathode material should therefore aim to retain the frustrated coordination of the Mg (Li) ions, by inhibiting the c parameter contraction that results in stable Mg (Li) orderings.
One route to achieve this effect could be via isovalent substitution of larger ions than Ti4+ (i.e. Zr4+, r = 0.72 Å or Hf4+, r = 0.71 Å), which would expand the anatase lattice parameters.61,62 Incorporation of Nb5+ (r = 0.64 Å) is also known to cause expansion of the anatase lattice,63 and improvements have been demonstrated for Li ion storage in Nb-doped anatase.24,64
The isovalent substitution of V4+ (r = 0.58 Å) for Ti4+ by Sheng et al. was not found to improve intercalation capacity for Mg in anatase, but instead offered improved pseudocapacitive storage.22 In light of the current discussion, we speculate that the smaller size of V4+ compared to Ti4+ does not cause lattice expansion, and is unlikely to inhibit the distortions discussed above.
An alternative strategy is the creation of Ti4+ vacancies that can provide insertion sites for Mg.19,20 By providing vacancies into which Mg can intercalate, the cation deficient structure may be resistant against the structural distortions (i.e. c parameter contraction) that we have identified as stabilising Mg and thus limiting mobility and capacity. The distortion arises from Mg2+ filling the interstitial sites, whereas insertion into Ti vacancy sites is not expected to create the same distortion. The authors report the creation of Ti vacancies, achieved by an anionic doping strategy, substituting F− and OH− into oxide ion sites. An alternative method proposed to create Ti vacancies in anatase is doping with Mo6+.28,65 Higher-valent cation doping is a general strategy to induce structural cation vacancies,66 and may be effective in anatase.
It is worth nothing however that the chemistry taking place during heterovalent substitutions (Nb5+, Mo6+ into Ti4+ sites) is not always well understood, with a complex interplay of charge compensating defects occurring in the lattice, with possible clustering of vacancies in various combinations which are often challenging to probe experimentally or represent in models.
A rule of thumb to judge the effectiveness of doped anatase phases towards Mg intercalation is to quantify the c/a ratio, with high values expected to yield better resistance to loss of structure.
4 Conclusions
We have conducted a systematic investigation of the behaviour of Mg in anatase TiO2 using hybrid-exchange density functional theory. The results indicate that under dilute conditions (∼Mg0.03TiO2), Mg ions adopt a frustrated 5-fold coordination, by displacement away from the centre of the octahedral insertion sites. Under these conditions, the migration barrier for mobility of Mg ions is relatively low. As more Mg is added, the structure is distorted from tetragonal to orthorhombic, and the c lattice parameter contracts by up to ∼10%. This causes a loss of the frustrated coordination and an increased stabilisation of the order of ∼1000 meV per Mg ion. The stabilisation is due to a more favourable 6-fold coordination, and the barriers for Mg ions to move out of these stabilised sites are substantially increased, by >1000 meV. The increased barriers due to stabilised Mg ions are likely to constitute the origin of the limited capacity for Mg in anatase. Results from previous theoretical investigations suggests that the increased activation barriers for Li in anatase occur via a similar mechanism.41,44,54 Strategies to enhance Mg storage capacity should aim to inhibit the structural distortions that occur on Mg insertion, or otherwise destabilise Mg insertion sites at high Mg concentrations, to retain the frustrated coordination and facilitate high Mg mobility. Doping strategies that may achieve these aims are discussed, and expansion of the anatase lattice parameters with large dopant ions, or the creation of cation vacancies in the structure are promising routes.Conflicts of interest
There are no conflicts to declare.Acknowledgements
Via our membership of the UK's HEC Materials Chemistry Consortium, which is funded by EPSRC (EP/L000202), this work used the ARCHER UK National Supercomputing Service (http://www.archer.ac.uk). We are grateful to the UK Materials and Molecular Modelling Hub for computational resources, which is partially funded by EPSRC (EP/P020194/1). The authors acknowledge the use of the UCL Grace High Performance Computing Facility (Grace@UCL), and associated support services, in the completion of this work.References
- H. D. Yoo, I. Shterenberg, Y. Gofer, G. Gershinsky, N. Pour and D. Aurbach, Energy Environ. Sci., 2013, 6, 2265–2279 RSC.
- P. Canepa, G. S. Gautam, D. C. Hannah, R. Malik, M. Liu, K. G. Gallagher, K. A. Persson and G. Ceder, Chem. Rev., 2017, 117, 4287–4341 CrossRef CAS PubMed.
- J. Muldoon, C. B. Bucur and T. Gregory, Angew. Chem., Int. Ed., 2017, 56, 12064–12084 CrossRef CAS PubMed.
- W. Xu, J. Wang, F. Ding, X. Chen, E. Nasybulin, Y. Zhang and J.-G. Zhang, Energy Environ. Sci., 2014, 7, 513–537 RSC.
- J. O. Besenhard and M. Winter, ChemPhysChem, 2002, 3, 155–159 CrossRef CAS PubMed.
- Z. Rong, R. Malik, P. Canepa, G. S. Gautam, M. Liu, A. Jain, K. Persson and G. Ceder, Chem. Mater., 2015, 27, 6016–6021 CrossRef CAS.
- D. Aurbach, Z. Lu, A. Schechter, Y. Gofer, H. Gizbar, R. Turgeman, Y. Cohen, M. Moshkovich and E. Levi, Nature, 2000, 407, 724–727 CrossRef CAS PubMed.
- V. Aravindan, Y. S. Lee, R. Yazami and S. Madhavi, Mater. Today, 2015, 18, 345–351 CrossRef CAS.
- Y. Liu and Y. Yang, J. Nanomater., 2016, 2016, 1–15 CAS.
- Y. Zhang, Y. Tang, W. Li and X. Chen, ChemNanoMat, 2016, 2, 764–775 CrossRef CAS.
- L. Kavan, M. Kalbáč, M. Zukalová, I. Exnar, V. Lorenzen, R. Nesper and M. Graetzel, Chem. Mater., 2004, 16, 477–485 CrossRef CAS.
- Y. Ren, Z. Liu, F. Pourpoint, A. R. Armstrong, C. P. Grey and P. G. Bruce, Angew. Chem., Int. Ed., 2012, 51, 2164–2167 CrossRef CAS PubMed.
- D. Su, S. Dou and G. Wang, Chem. Mater., 2015, 27, 6022–6029 CrossRef CAS.
- E. Sheha, Int. J. Electrochem. Sci., 2013, 8, 3653–3663 CAS.
- S. Su, Z. Huang, Y. NuLi, F. Tuerxun, J. Yang and J. Wang, Chem. Commun., 2015, 51, 2641–2644 RSC.
- S. Su, Y. NuLi, Z. Huang, Q. Miao, J. Yang and J. Wang, ACS Appl. Mater. Interfaces, 2016, 8, 7111–7117 CrossRef CAS PubMed.
- Y. Meng, D. Wang, Y. Wei, K. Zhu, Y. Zhao, X. Bian, F. Du, B. Liu, Y. Gao and G. Chen, J. Power Sources, 2017, 346, 134–142 CrossRef CAS.
- Y. Zhang, K. C. Kirshenbaum, A. C. Marschilok, E. S. Takeuchi and K. J. Takeuchi, Chem. Mater., 2016, 28, 7619–7628 CrossRef CAS.
- T. Koketsu, J. Ma, B. J. Morgan, M. Body, C. Legein, W. Dachraoui, M. Giannini, A. Demortière, M. Salanne, F. Dardoize, H. Groult, O. J. Borkiewicz, K. W. Chapman, P. Strasser and D. Dambournet, Nat. Mater., 2017, 16, 1142–1148 CrossRef CAS PubMed.
- J. Ma, T. Koketsu, B. J. Morgan, C. Legein, M. Body, P. Strasser and D. Dambournet, Chem. Commun., 2018, 54, 10080–10083 RSC.
- W. Li, D. Corradini, M. Body, C. Legein, M. Salanne, J. Ma, K. W. Chapman, P. J. Chupas, A. L. Rollet, C. Julien, K. Zhagib, M. Duttine, A. Demourgues, H. Groult and D. Dambournet, Chem. Mater., 2015, 27, 5014–5019 CrossRef CAS.
- J. Sheng, C. Peng, S. Yan, G. Zhang, Y. Jiang, Q. An, Q. Wei, Q. Ru and L. Mai, J. Mater. Chem. A, 2018, 13901–13907 RSC.
- W. Zhang, Y. Gong, N. P. Mellott, D. Liu and J. Li, J. Power Sources, 2015, 276, 39–45 CrossRef CAS.
- M. Fehse, S. Cavaliere, P. E. Lippens, I. Savych, A. Iadecola, L. Monconduit, D. J. Jones, F. Fischer, C. Tessier, L. Stievano, D. D. Recherche and B. A. Daney, J. Phys. Chem. B, 2013, 117, 13827–13855 CAS.
- M. Lübke, J. Shin, P. Marchand, D. Brett, P. Shearing, Z. Liu and J. A. Darr, J. Mater. Chem. A, 2015, 3, 22908–22914 RSC.
- M. Lübke, I. Johnson, N. M. Makwana, D. Brett, P. Shearing, Z. Liu and J. A. Darr, J. Power Sources, 2015, 294, 94–102 CrossRef.
- C. Andriamiadamanana, C. Laberty-Robert, M. T. Sougrati, S. Casale, C. Davoisne, S. Patra and F. Sauvage, Inorg. Chem., 2014, 53, 10129–10139 CrossRef CAS PubMed.
- T. V. Thi, A. K. Rai, J. Gim, S. Kim and J. Kim, J. Alloys Compd., 2014, 598, 16–22 CrossRef CAS.
- A. Erba, J. Baima, I. Bush, R. Orlando and R. Dovesi, J. Chem. Theory Comput., 2017, 13, 5019–5027 CrossRef CAS PubMed.
- R. Dovesi, A. Erba, R. Orlando, C. M. Zicovich-Wilson, B. Civalleri, L. Maschio, M. Rérat, S. Casassa, J. Baima, S. Salustro and B. Kirtman, Wiley Interdiscip. Rev.: Comput. Mol. Sci., 2018, e1360 Search PubMed.
- F. Corà, M. Alfredsson, G. Mallia, D. S. Middlemiss, W. C. Mackrodt, R. Dovesi and R. Orlando, Struct. Bonding, 2004, 113, 171–232 CrossRef.
- T. Barnes, L. Wan, P. Kent and D. Prendergast, Phys. Chem. Chem. Phys., 2018, 20, 24877–24884 RSC.
- H. J. Monkhorst and J. D. Pack, Phys. Rev. B: Solid State, 1976, 13, 5188–5192 CrossRef.
- S. Grimme, J. Antony, S. Ehrlich and H. Krieg, J. Chem. Phys., 2010, 132, 0–19 CrossRef CAS PubMed.
- S. Grimme, A. Hansen, J. G. Brandenburg and C. Bannwarth, Chem. Rev., 2016, 116, 5105–5154 CrossRef CAS PubMed.
- J. G. Brandenburg, M. Alessio, B. Civalleri, M. F. Peintinger, T. Bredow and S. Grimme, J. Phys. Chem. A, 2013, 117, 9282–9292 CrossRef CAS PubMed.
- F. Legrain, O. Malyi and S. Manzhos, J. Power Sources, 2015, 278, 197–202 CrossRef CAS.
- M. Wagemaker, A. P. Kentjens and F. M. Mulder, Nature, 2002, 418, 397–399 CrossRef CAS PubMed.
- M. Wagemaker, G. J. Kearley, A. A. V. Well, H. Mutka and F. M. Mulder, J. Am. Chem. Soc., 2003, 125, 840–848 CrossRef CAS PubMed.
- B. J. Morgan and G. W. Watson, Phys. Rev. B: Condens. Matter Mater. Phys., 2010, 82, 1–11 Search PubMed.
- J. A. Dawson and J. Robertson, J. Phys. Chem. C, 2016, 120, 22910–22917 CrossRef CAS.
- M. V. Koudriachova, S. W. De Leeuw and N. M. Harrison, Phys. Rev. B: Condens. Matter Mater. Phys., 2004, 69, 1–6 CrossRef.
- W. Li, M. Fukunishi, B. J. Morgan, O. J. Borkiewicz, K. W. Chapman, A. Maignan, O. I. Lebedev, J. Ma, H. Groult, S. Komaba and D. Dambournet, Chem. Mater., 2017, 29, 1836–1844 CrossRef CAS.
- A. A. Belak, Y. Wang and A. Van der Ven, Chem. Mater., 2012, 24, 2894–2898 CrossRef CAS.
- L. R. De Jesus, G. A. Horrocks, Y. Liang, A. Parija, C. Jaye, L. Wangoh, J. Wang, D. A. Fischer, L. F. J. Piper, D. Prendergast and S. Banerjee, Nat. Commun., 2016, 7, 12022 CrossRef CAS PubMed.
- A. Parija, Y. Liang, J. L. Andrews, L. R. De Jesus, D. Prendergast and S. Banerjee, Chem. Mater., 2016, 28, 5611–5620 CrossRef CAS.
- L. R. De Jesus, J. L. Andrews, A. Parija and S. Banerjee, ACS Energy Lett., 2018, 3, 915–931 CrossRef CAS.
- G. S. Gautam, P. Canepa, R. Malik, M. Liu, K. Persson and G. Ceder, Chem. Commun., 2015, 51, 13619–13622 RSC.
- G. S. Gautam, P. Canepa, A. Abdellahi, A. Urban, R. Malik and G. Ceder, Chem. Mater., 2015, 27, 3733–3742 CrossRef.
- M. Liu, Z. Rong, R. Malik, P. Canepa, A. Jain, G. Ceder and K. A. Persson, Energy Environ. Sci., 2015, 8, 964–974 RSC.
- L. F. Wan, J. T. Incorvati, K. R. Poeppelmeier and D. Prendergast, Chem. Mater., 2016, 28, 6900–6908 CrossRef CAS.
- M. Zhang, A. C. Macrae, H. Liu and Y. Shirley, J. Electrochem. Soc., 2016, 163, A2368–A2370 CrossRef CAS.
- S. Mustapha, P. D'Arco, M. De La Pierre, Y. Noël, M. Ferrabone and R. Dovesi, J. Phys.: Condens. Matter, 2013, 25, 105401 CrossRef CAS PubMed.
- B. J. Morgan and G. W. Watson, J. Phys. Chem. Lett., 2011, 2, 1657–1661 CrossRef CAS.
- D. Morgan, A. Van der Ven and G. Ceder, Electrochem. Solid-State Lett., 2004, 7, A30 CrossRef CAS.
- A. Torres and M. E. Arroyo-de Dompablo, J. Phys. Chem. C, 2018, 122, 9356–9362 CrossRef CAS.
- M. S. Islam and C. A. J. Fisher, Chem. Soc. Rev., 2014, 43, 185–204 RSC.
- J. L. Andrews, A. Mukherjee, H. D. Yoo, A. Parija, P. M. Marley, S. Fakra, D. Prendergast, J. Cabana, R. F. Klie and S. Banerjee, Chem, 2018, 4, 564–585 CAS.
- T. Zhu and S.-P. Gao, J. Phys. Chem. C, 2014, 118, 11385–11396 CrossRef CAS.
- J. Muscat, V. Swamy and N. M. Harrison, Phys. Rev. B: Condens. Matter Mater. Phys., 2002, 65, 224112 CrossRef.
- M. V. Koudriachova and N. M. Harrison, J. Mater. Chem., 2006, 16, 1973–1977 RSC.
- V. V. Zheleznov, E. I. Voit, Y. V. Sushkov, S. A. Sarin, V. G. Kuryavyi, D. P. Opra, S. V. Gnedenkov, S. L. Sinebryukhov and A. A. Sokolov, IOP Conf. Ser.: Mater. Sci. Eng., 2016, 112, 012016 Search PubMed.
- Y. Furubayashi, T. Hitosugi, Y. Yamamoto, K. Inaba, G. Kinoda, Y. Hirose, T. Shimada and T. Hasegawa, Appl. Phys. Lett., 2005, 86, 1–3 CrossRef.
- Y. Wang, B. M. Smarsly and I. Djerdj, Chem. Mater., 2010, 22, 6624–6631 CrossRef CAS.
- Y. Li, Y. Hu, J. Shen, H. Jiang, G. Min, S. Qiu, Z. Song, Z. Sun and C. Li, Nanoscale, 2015, 7, 18603–18611 RSC.
- K. R. Hahn, A. Tricoli, G. Santarossa, A. Vargas and A. Baiker, Surf. Sci., 2011, 605, 1476–1482 CrossRef CAS.
Footnote |
| † Electronic supplementary information (ESI) available. See DOI: 10.1039/c8ta09939a |
| This journal is © The Royal Society of Chemistry 2019 |