
Conjugated polymer dots/graphitic carbon nitride nanosheet heterojunctions for metal-free hydrogen evolution photocatalysis†
Wei
Zhou
a,
Tao
Jia
b,
Haixian
Shi
a,
Dingshan
Yu
 a,
Wei
Hong
*a and
Xudong
Chen
*a
a,
Wei
Hong
*a and
Xudong
Chen
*a
aKey Laboratory for Polymeric Composite and Functional Materials of Ministry of Education, School of Chemistry, Sun Yat-sen University, Guangzhou 510275, P. R. China. E-mail: hongwei9@mail.sysu.edu.cn; cescxd@mail.sysu.edu.cn
bInstitute of Polymer Optoelectronic Materials and Devices, State Key Laboratory of Luminescent Materials and Devices, South China University of Technology, Guangzhou 510640, P. R. China
First published on 22nd November 2018
Abstract
Graphitic carbon nitride (g-C3N4)-based heterojunctions have been widely applied to photocatalytic hydrogen evolution. However, most of the g-C3N4-based heterojunctions still require the incorporation of noble metal co-catalysts for hydrogen evolution. Based on the excellent prolonged excited state lifetime, tunable optical properties, appropriate bandgap of conjugated polymer dots (Pdots) and unique few-layered g-C3N4 nanosheets with porous structures, in this study, polyfluorene Pdots are facilely coupled with g-C3N4 nanosheets to form organic heterojunctions. The poly(9,9-dioctylfluorene-alt-bithiophene) (F8T2) Pdots/g-C3N4 nanosheet heterojunctions can significantly extend the light-absorption range and promote the electron–hole pair separation, leading to an enhanced hydrogen evolution rate up to 929.3 μmol h−1 g−1 with an apparent quantum yield of 5.7% at 420 nm without any metallic co-catalyst. This approach can provide a facile and operable fabrication technique for high performance photocatalysts, optical sensors and photoelectric devices in a sustainable way.
1 Introduction
Graphitic carbon nitride (g-C3N4), a semiconductor with an appropriate band gap, photocorrosion resistance, and thermal and chemical stability, has been widely applied in hydrogen evolution through photocatalytic water-splitting reactions.1–6 However, g-C3N4 has a low hydrogen evolution efficiency which can be ascribed to three reasons: (1) its blue light absorption limited to about 450 nm results in the inefficient absorption of visible light. (2) Due to its low surface area, the limited photocatalytic active sites on the surface restrict the water reduction reaction rate. (3) The fast recombination of photo-induced electron–hole pairs leads to unsatisfactory photocatalytic performance.7–9 Therefore, modified g-C3N4 has been developed to promote the photocatalytic activity, by using chemical heteroatom doping (B,10 P,11,12 and S13,14), nanoarchitectural g-C3N4 as nanodots,15–17 nanosheets,18–20 and porous structures,21–24 defect engineering,25,26 and g-C3N4 heterojunctions including inorganic semiconductor/g-C3N4 heterojunctions,27–30 conjugated polymer/bulk g-C3N4 heterojunctions,31–33 isotype g-C3N4/g-C3N4.34 It should be noted that most of these systems required the incorporation of platinum co-catalysts to improve the rate of hydrogen production. In this sense, these g-C3N4 photocatalytic systems do not technically meet the metal-free requirement. Noble metal co-catalysts, suffering from high price and toxicity in water, have limited their practical applications.35,36Recently, inorganic carbon/g-C3N4 heterojunctions have been fabricated to achieve metal-free g-C3N4 systems. Carbon nanodots (CDots),37 with efficient photoinduced electron transfer and a high surface area, have been adopted to form heterojunctions with bulk g-C3N4. Although CDots could enhance the photocatalytic performance of bulk g-C3N4 without other co-catalysts, the visible light absorption of CDots/bulk g-C3N4 heterojunctions could only be narrowly extended and the water reduction efficiency was unsatisfactory, due to the limited structural regulation of CDots. The incorporation of multiwall carbon nanotubes (MWCNTs) into g-C3N4 could widely extend the visible light absorption range for bulk g-C3N4,38 while the poor photoinduced electron–hole separation led to extremely low photocatalytic performance. g-C3N4 nanofibers merged with nitrogen-rich carbon (g-C3N4@C) could efficiently improve the visible light absorption and the hydrogen evolution rate.36 However, structural and bandgap adjustment approaches for carbon-based g-C3N4@C are limited. Thus, to further improve the overall performance, the next generation of modified g-C3N4 photocatalysts should possess a wide light absorption range, a large specific surface area, fast electron–hole separation, diverse structural adjustment, a high photocatalytic efficiency and technically metal-free properties.
A well-known advantage of organic semiconducting polymers is systematic tunable properties, such as the optical absorption range and bandgap.29 In addition, nanostructured conjugated polymers such as semiconductor polymer dots (Pdots) have been employed to enhance photocatalysis with a prolonged excited state lifetime and easy processability.39–44 Nevertheless, due to the significant aggregation of the hydrophobic Pdots in aqueous systems, the photocatalytic activity decreased rapidly.45 To enhance the photocatalytic stability of Pdots, cycloplatinated Pdots, with a platinum complex covalently linked to the backbone of Pdots, were prepared and applied to water-splitting photocatalysis.46 Although the cycloplatinated Pdots demonstrated a relatively stable hydrogen evolution rate, the photocatalyst still contains platinum. To resolve the stability issue of Pdots without any metallic co-catalyst, it could be speculated that the coupling of Pdots with g-C3N4 would improve the stability of Pdots, leading to stable and enhanced hydrogen evolution.
In this study, we demonstrated a co-catalyst-free hydrogen evolution system of Pdot/g-C3N4 nanosheets (as shown in Fig. 1), based on polyfluorene polymers coupled with g-C3N4 nanosheets through a facile solution method to form Pdots/g-C3N4 nanosheet heterojunctions with a Pdot particle size of 3–4 nm. It was revealed that the Pdots, confined on a porous g-C3N4 nanosheet with excellent stability under aqueous conditions, could significantly extend the light absorption range, increase photocatalytic reaction sites and promote electron–hole pair separation and transfer. The hydrogen evolution rate of F8T2 Pdots/g-C3N4 nanosheet heterojunctions could reach 929.3 μmol h−1 g−1 with an apparent quantum yield up to 5.7% at 420 nm in the absence of any metallic co-catalyst. This research can further broaden the horizon of the facile preparation approach for fabricating organic semiconducting materials simultaneously accommodating a metal-free composition, a high specific surface area and pronounced light harvesting.
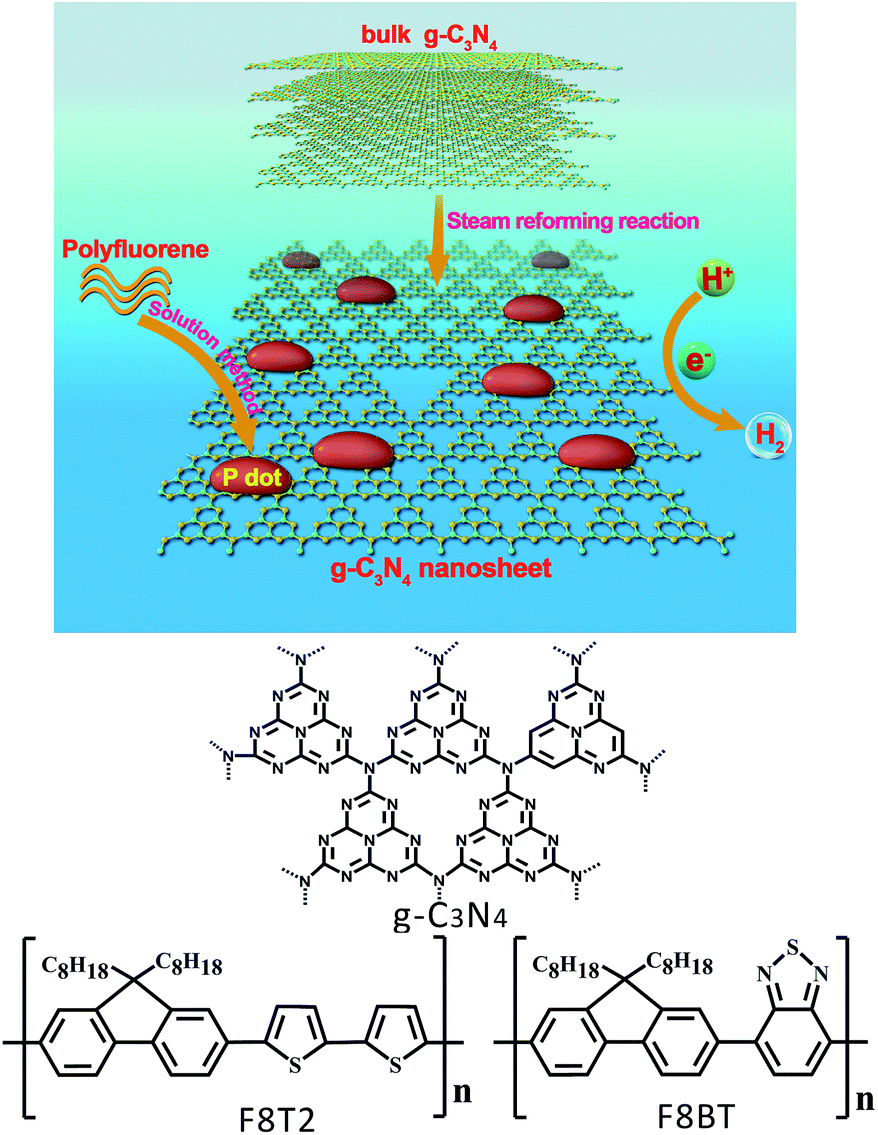 | ||
| Fig. 1 Illustration of the formation of polyfluorene Pdots/g-C3N4 nanosheet heterojunctions with the chemical structures of g-C3N4 and polyfluorenes. | ||
2 Experimental
2.1 Chemicals
Poly(9,9-dioctylfluorene-alt-bithiophene) (F8T2, 48.1 kDa) and poly(9,9-dioctylfluorene-alt-benzothiadiazole) (F8BT, 14.1 kDa) were purchased from Derthon Optoelectronic Materials Science Technology Co., Ltd, China. Urea, melamine and chloroform were purchased from Sigma-Aldrich and used without further purification.2.2 g-C3N4 nanosheet fabrication
g-C3N4 nanosheets were prepared according to the previously published literature.17 Typically, 10 g precursor (urea or melamine) placed in a crucible was put in a muffle furnace. Then, the temperature was increased to 550 °C with a heating rate of 5 °C min, and the polymerization reaction was maintained for 2 hours under an air atmosphere. The bulk g-C3N4 prepared from urea (CNU) and g-C3N4 prepared from melamine (CNM) were, respectively, collected after cooling down to room temperature. Successively, 0.5 g bulk CNU or CNM powder in a tube furnace was exfoliated in an Ar-carrying water atmosphere for 4 h at 500 °C to obtain CNU nanosheets (CNUS) or CNM nanosheets (CNMS).2.3 Polyfluorene Pdots/g-C3N4 nanosheet heterojunction fabrication
Polyfluorenes, including poly(9,9-dioctylfluorene-alt-bithiophene) (F8T2) and poly(9,9-dioctylfluorene-alt-benzothiadiazole) (F8BT), were employed to couple with g-C3N4 in chloroform. The weight percent of the polyfluorene dots was defined by the amount of polyfluorenes used for the heterojunction preparation. Typically, 60 mg CNUS powder was dispersed in 25 mL chloroform. After that, F8T2, with a certain proportion of g-C3N4, was added to chloroform. The mixture was kept stirring for 20 h at room temperature, after which the yellowish green color of the F8T2 solution would fade and a brownish red powder would precipitate, indicating the significant adsorption of F8T2 on the CNUS (for the F8T2/bulk g-C3N4 preparation, the F8T2 solution had no obvious color fading, and the yellowish F8T2/bulk g-C3N4 powder precipitated at the bottom, demonstrating the poor adsorption of F8T2 on the bulk g-C3N4.). Finally, the F8T2 Pdots/CNUS heterojunctions were obtained by vacuum evaporation at 55 °C with a rotation speed of 200 rpm.2.4 Characterization
TEM images were obtained using a JEOL JEM-2100F field-emission microscope at an accelerating voltage of 300 kV. AFM was performed using a Bruker Multimode 8 instrument. Nitrogen adsorption–desorption isotherm curves were collected using a Micromeritics ASAP 2460 at 77 K after degassing at 100 °C. XRD pattern measurements were carried out using a D8 ADVANCE diffractometer with CuKα radiation (λ = 1.5406 Å). XPS spectra and XPS valence spectra were obtained on a Thermo ESCALab 250 instrument. The binding energies were calibrated using the C1s peak at 284.8 eV. UV-Vis DRS spectra were collected using a Shimadzu UV-3600 spectrophotometer with BaSO4 powder as the reference. PL spectra were measured from 400 to 800 nm using an Edinburgh FLS 920 fluorescence spectrophotometer with an excitation wavelength of 337 nm. The time-resolved PL decay spectra were observed at 540 nm for F8T2 and F8T2/g-C3N4, 550 nm for F8BT and F8BT/g-C3N4, and 450 nm for bulk g-C3N4, g-C3N4 nanosheets and polyfluorene/g-C3N4 heterojunctions. The average lifetimes were calculated using the equation τ = τ1I1 + τ2I2 + τ3I3 (τ1, τ2 and τ3 are the lifetimes; I1, I2 and I3 are the corresponding intensities). Electrochemical measurements were conducted with a CHI600D electrochemical system. The details of photocatalytic hydrogen evolution tests, AQY measurements, electrochemical characterization and DFT calculation methods are as follows.2.5 DFT calculation methods
The simplified models of F8T2 and g-C3N4 (n = 1) were established as indicated in Fig. S14.† Firstly, the geometric optimization of F8T2, g-C3N4 and F8T2/g-C3N4 adsorption systems was carried out to minimize the total energy of the system to achieve a ground state electronic structure. Based on the optimized structure, the energy levels, electron density distribution and electron orbitals of the system were further simulated. The adsorption energy of F8T2 on the g-C3N4 surface (Eab = EF8T2/g-C3N4 − Eg-C3N4 − EF8T2) was simulated using the DMol3 software package according to density functional theory (DFT). The PW91, belonging to the generalized gradient approximation (GGA), was selected to describe the electron interaction between g-C3N4 and F8T2. The ultra-soft pseudo-potential was employed to approximate the interaction inside and outside the delocalization region. The self-consistent convergence accuracy is set to 1 × 10⁻⁴ eV per atom.3 Results and discussion
3.1 Microstructure of Pdots/CNUS heterojunctions
As indicated by transmission electron microscopy (TEM) measurements, the steam reforming process could exfoliate the dense and stacked CNU and CNM into thin CNUS and CNMS structures, respectively (Fig. S1†). Atomic force microscopy (AFM) analysis indicated that CNUS possessed a few-layered porous structure with a thickness of 1.1 nm (Fig. S2A and B†). HRTEM of F8T2 Pdots/CNUS demonstrated the appearance of F8T2 Pdots on the surface of CNUS (Fig. 2A) as confirmed by the STEM image for the S element distribution of F8T2 Pdots/CNUS heterojunctions which was consistent with the dot distribution on the nanosheets (Fig. S3†). TEM analysis indicated that the average diameters for the uniformly dispersed F8T2 Pdots/CNUS, F8BT Pdots/CNUS and F8T2 Pdots/CNMS were 4.3 (Fig. 2A), 3.9 (Fig. 2B) and 3.5 nm (Fig. 2C), respectively. The AFM analysis revealed that the average thickness of the Pdots in F8T2 Pdots/CNUS was approximately 0.8 nm (Fig. S2C and D†). In contrast, TEM analysis demonstrated that F8T2 was non-uniformly distributed on the surface of CNU as shown in Fig. S4A† and was totally agglomerated on the surface of CNM (Fig. S4B†).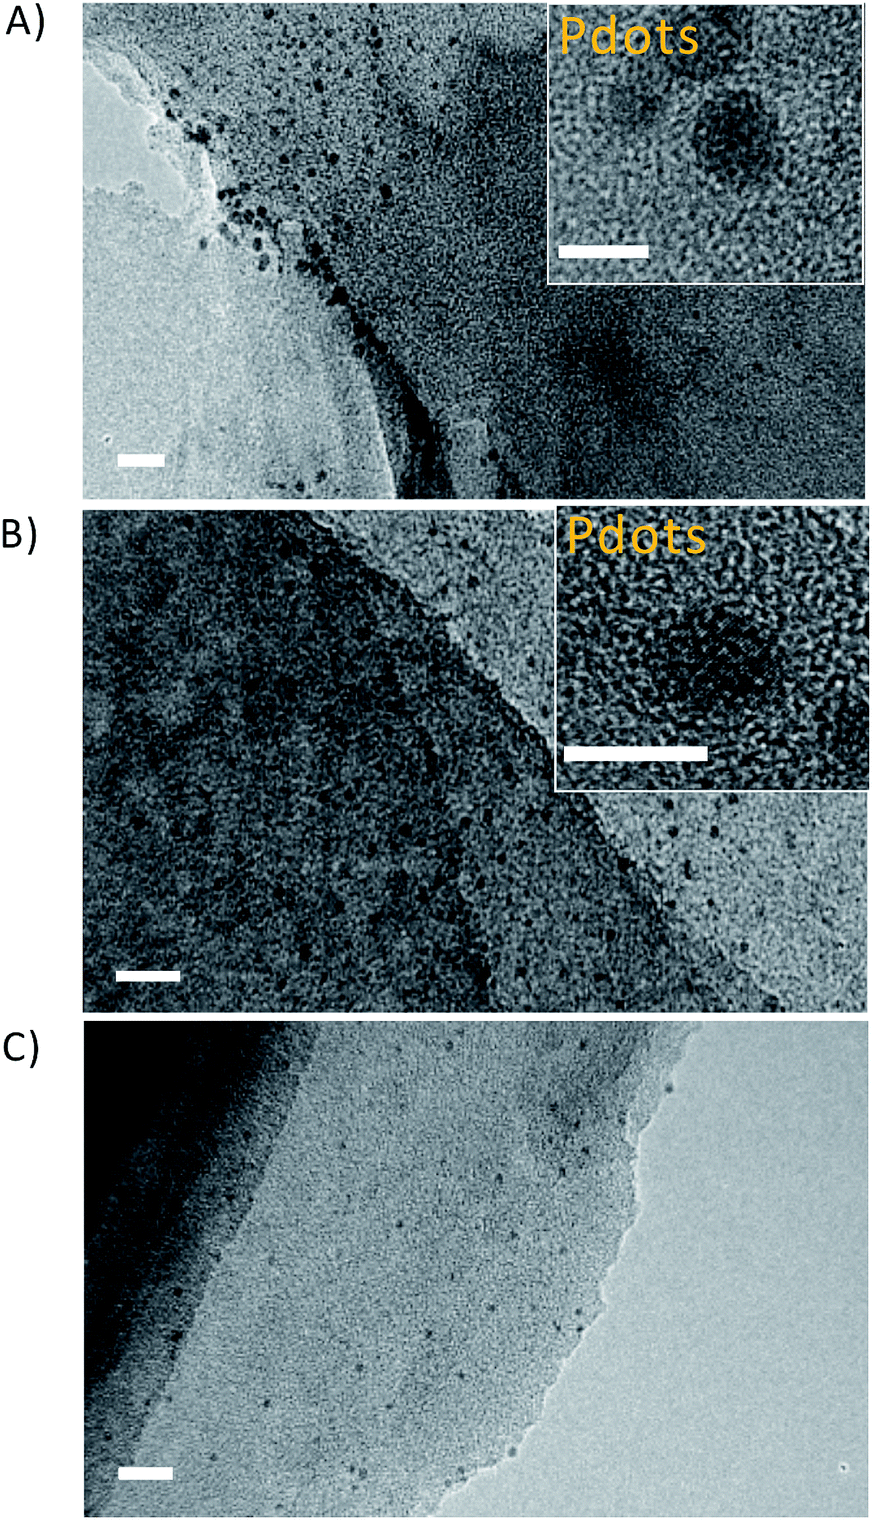 | ||
| Fig. 2 TEM images of (A) F8T2 Pdots/CNUS, scale bar: 20 nm (inset: HRTEM image of F8T2 Pdots/CNUS, scale bar: 5 nm); (B) F8BT Pdots/CNUS, scale bar: 20 nm (inset: HRTEM image of F8BT Pdots/CNUS, scale bar: 5 nm); (C) F8T2 Pdots/CNMS, scale bar: 20 nm. The mass ratios of Pdots were 5 wt% of the nanosheets. | ||
The nitrogen adsorption–desorption isotherms for the F8T2 Pdots/CNUS-5% and F8BT Pdots/CNUS-5% heterojunctions exhibited decreased nitrogen adsorption capacity, a reduced pore volume and an increased average pore size compared with those of CNUS (Fig. 3, Table S1†), indicating that the Pdots occupy the micropores and mesopores of CNUS. The results supported that the Pdots resulted from the absorption of the conjugated polymers by the defects on the nanosheets, because significant decoloration of the conjugated polymers occurred during the fabrication of the heterojunctions with nanosheets while no decoloration occurred for the ones with bulk g-C3N4. Therefore, it was suggested that the nanoparticle sizes and uniform morphology of F8T2 Pdots can be attributed to the high dispersion capability of the structurally porous g-C3N4 with the high Barrett–Joyner–Halenda (BJH) surface areas of 272 m2 g−1 for CNUS and 188 m2 g−1 for CNMS (Fig. S5 and Table S1†). However, F8T2 could not be uniformly dispersed on the surfaces of bulk g-C3N4 due to the relatively low surface areas of CNU and CNM of 62 m2 g−1 and 15 m2 g−1, respectively (Fig. S5 and Table S1†). Moreover, surface elemental analysis by X-ray photoelectron spectroscopy (XPS) showed that the S atom ratios for the F8T2 Pdots/CNUS, F8T2 Pdots/CNMS, F8T2/CNU and F8T2/CNM heterojunctions were 0.50%, 0.74%, 0.88% and 1.89%, respectively (Table S2†), indicating that the porous g-C3N4 nanosheets with large surface areas could promote the dispersion of polyfluorenes on the surface.
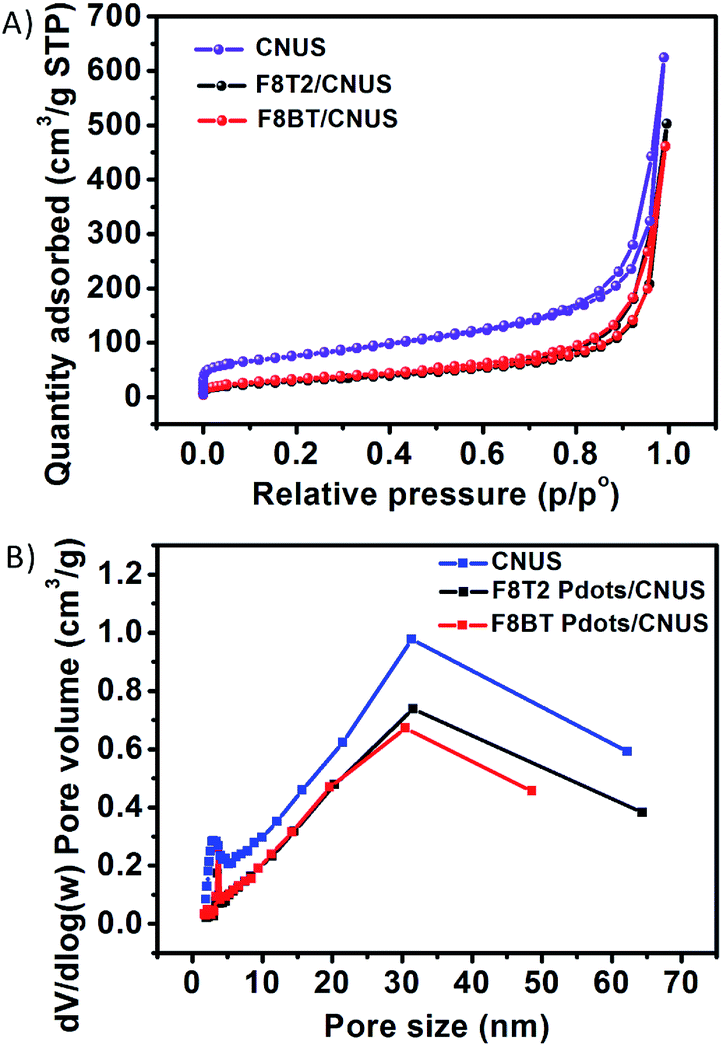 | ||
| Fig. 3 (A) The nitrogen adsorption–desorption isotherms of CNUS, F8T2 Pdots/CNUS, and F8BT Pdots/CNUS. (B) The pore size distributions of CNUS, F8T2 Pdots/CNUS, and F8BT Pdots/CNUS. The mass ratios of polyfluorenes/CNUS were 5 wt%. | ||
In addition, as shown in the X-ray diffraction (XRD) patterns (Fig. S6†), the CNU, CNM, CNUS and CNMS exhibited characteristic XRD peaks at 13.3° (100) and 27.4° (002),17 respectively, while the polyfluorenes of F8T2 and F8BT were amorphous structures. All of the heterojunctions maintained the layered structures as no significant XRD pattern changes were detected with respect to those of the corresponding g-C3N4. The XPS spectra in Fig. 4 showed that the N1s peaks shifted to a lower energy and S2p peaks shifted to a higher energy for the F8T2/CNUS heterojunction when compared with those of pure CNUS and F8T2, indicating that the intermolecular π–π interaction exists between F8T2 Pdots and CNUS.47 Nevertheless, no significant N1s and S2p XPS binding energy shifts were observed for the F8T2/bulk-g-C3N4 and F8BT/CNUS heterojunctions (Fig. S7–S11†), indicating the less efficient intermolecular π–π interaction.
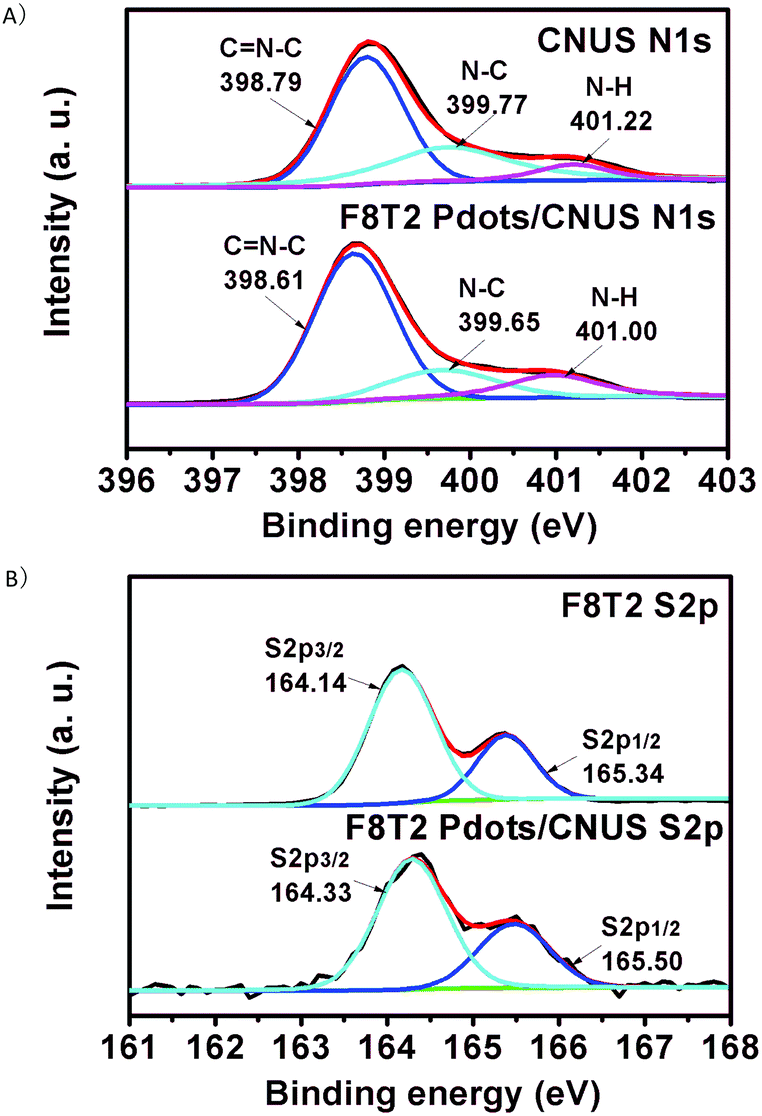 | ||
| Fig. 4 (A) N1s XPS spectra of CNUS and F8T2 Pdots/CNUS. (B) S2p XPS spectra of F8T2 and F8T2 Pdots/CNUS. The mass ratios of polyfluorenes/CNUS were 5 wt%. | ||
3.2 The band structures and photophysical behaviors of Pdots/CNUS
The UV-Vis diffuse reflectance spectra were measured to investigate the extended visible light absorption of Pdots/CNUS as shown in Fig. 5A. Compared with the onset of the absorption edge of CNUS located at 435 nm,18,48 the onset of the absorption edge for F8T2 Pdots/CNUS and F8BT Pdots/CNUS was red-shifted to 560 and 563 nm with long tails in the absorption spectra. Due to the intermolecular π–π interaction between Pdots and CNUS, a π–π system was formed between the electrons in the conjugated backbones of Pdots and the π-electrons in CNUS, which facilitated the charge-transfer from Pdots to CNUS. Therefore, the π–π* transition energy reduced, resulting in the obvious Pdots/CNU red shift of UV-Vis absorption edges compared with bulk polyfluorenes.49,50 The absorption intensity of the F8T2 Pdots/CNUS heterojunction was gradually increased with the proportion of F8T2 added (Fig. S12C†). The electronic band structure of the heterojunctions was studied using the Tauc plots based on the UV-Vis diffuse reflectance spectra (Fig. S12D and E†), the conduction band (CB) of g-C3N4 was based on the Mott–Schottky plots (Fig. S13A–D†), and the valence band (VB) of polyfluorenes was determined by cyclic voltammetry (CV) (Fig. S13E†).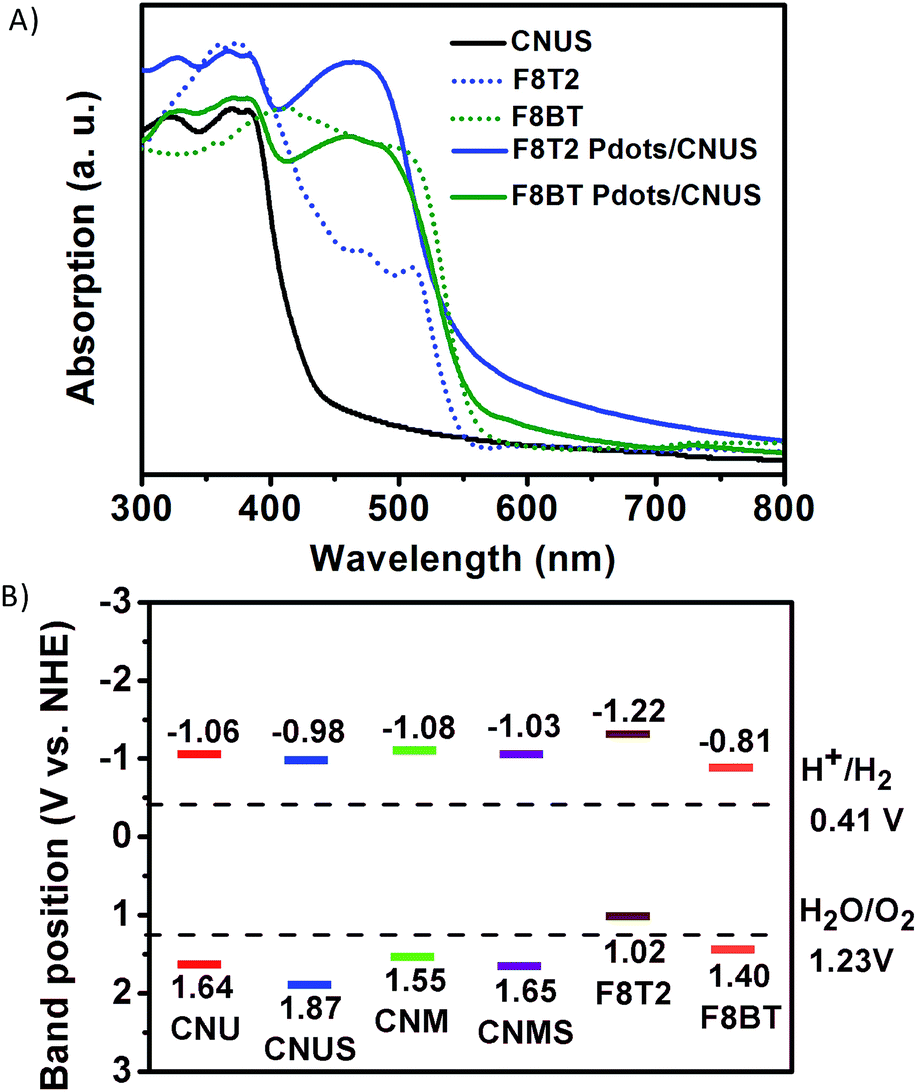 | ||
| Fig. 5 (A) UV-Vis diffuse reflectance spectra of CNUS, polyfluorenes (F8T2 and F8BT), and polyfluorene Pdots/CNUS; the mass ratios of polyfluorenes/CNUS were 5 wt%. (B) The band structure diagram of g-C3N4 and polyfluorenes calculated using Tauc plots based on the optical absorption, electrochemical Mott–Schottky plots and cyclic voltammogram curves. | ||
As shown in Fig. 5B, the band determined based on the tests above indicated that F8T2 possessed less positive VBs and more negative CBs than CNUS, which was beneficial for the excited electron transfer from F8T2 to CNUS (the XPS valence spectra in Fig. S13F† also confirmed such band structures as shown in Table S3†). The density functional theory (DFT) simulation results (Fig. 6) supported that F8T2 exhibited electron transfer from the LUMO of F8T2 to those of g-C3N4 and g-C3N4 and showed hole transfer from the HOMO of g-C3N4 to that of F8T2. Therefore, the reduction of H+ to H2 in water can be improved significantly. Furthermore, the simulation results of the electron density distribution demonstrated that 0.055 e could transfer from a F8T2 molecular unit to a g-C3N4 molecular unit (Fig. S14B†), which is consistent with the charge transfer direction based on the HOMO and LUMO energy levels. Additionally, the absorption energy (Eab) of F8T2 on the surface of g-C3N4 was calculated to be −0.05 Ha, indicating the good stability of the F8T2/g-C3N4 heterojunction. Thus, based on the electrochemical tests and DFT calculations, the formation of the stable F8T2 Pdots/CNUS heterojunction could accelerate the electron transfer from the F8T2 to CNUS and prevent the recombination of photo-excited electrons and holes.
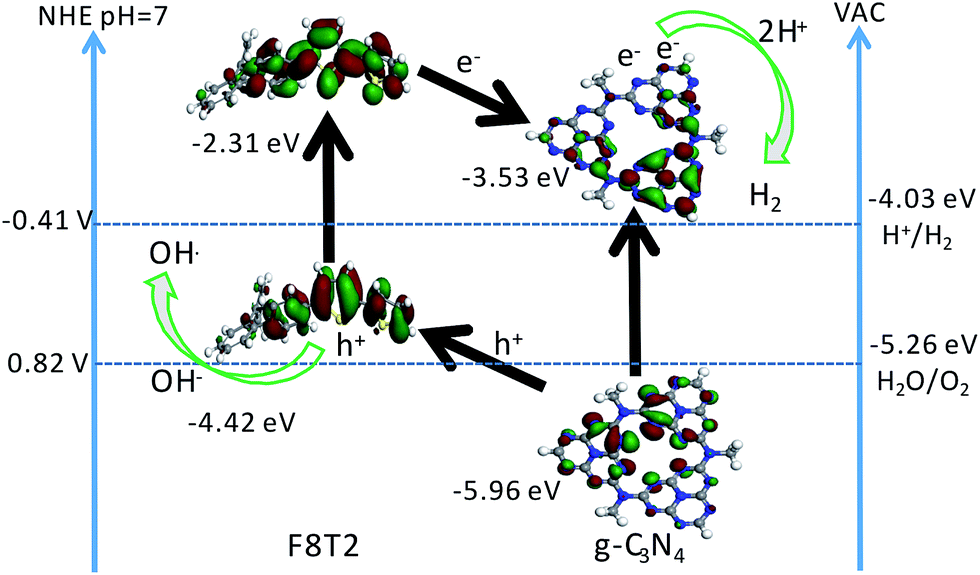 | ||
| Fig. 6 Proposed photocatalytic mechanism of F8T2 Pdots/CNUS heterojunctions. The HOMO and LUMO of F8T2 and CNUS were calculated by DFT simulations and optical absorption. The grey, blue, yellow, and white balls represent the carbon, nitrogen, sulfur and hydrogen atoms, respectively. | ||
The PL emission spectra of g-C3N4, polyfluorenes and the heterojunctions were measured without co-catalysts to monitor the radiative recombination of the electron–hole pairs of the semiconductors. As shown in Fig. 7A, the PL peaks of CNU and CNM were centered at 458 and 459 nm, respectively, while the PL peaks of CNUS and CNMS blue-shifted to 435 nm51,52 and the PL peaks of F8T2 and F8BT were at 540 (ref. 53) and 550 nm, respectively.29 Furthermore, the PL intensities of the heterojunctions decreased when compared with those of either the g-C3N4 or the F8T2 (Fig. S15A†), which was considered as a result of the electrons being excited from the F8T2 valence band to the F8T2 conduction band and transferred to the g-C3N4 conduction band, significantly preventing a direct recombination of electrons and holes.28,29 Moreover, the inhibition degree of PL intensities for F8T2 heterojunctions gradually increased with the increasing surface area of g-C3N4. Particularly, the F8T2 Pdots/CNUS heterojunction showed the weakest F8T2 emission peak among all F8T2 heterojunctions (Fig. S15A†). Thus, F8T2 Pdots could effectively promote the electron–hole pair separation and transfer through π–π conjugated structures of F8T2 and CNUS. However, the PL intensity of the F8BT Pdots/CNUS was significantly stronger than that of the F8T2 Pdots/CNUS (Fig. 7A), which could be ascribed to the higher conduction band and lower valence band of F8BT than CNUS leading to less effective electron–hole pair transfer in the F8BT Pdots/CNUS heterojunction. Additionally, the PL intensity of F8T2 Pdots/CNUS decreased with the increasing proportion of F8T2 (Fig. S15B†), supporting the effective electron separation and transfer between F8T2 and CNUS.
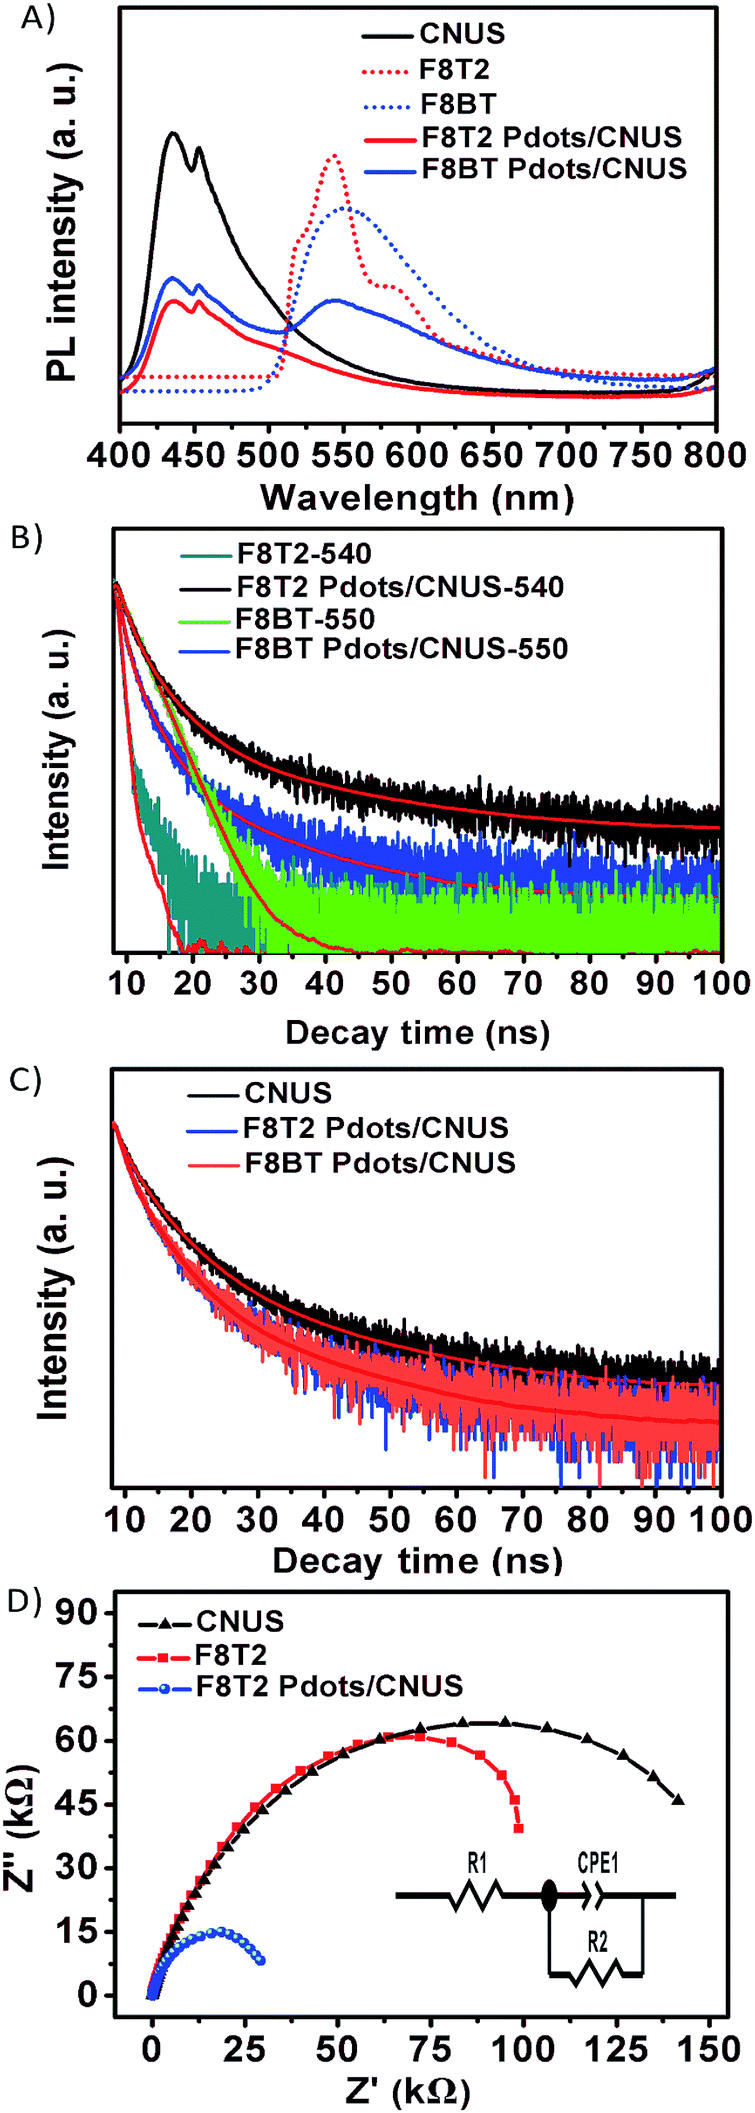 | ||
| Fig. 7 (A) PL spectra of CNUS, polyfluorenes, and polyfluorene Pdots/CNUS under 337 nm excitation; (B) time-resolved PL spectra of F8T2, F8BT, F8T2/CNUS and F8BT/CNUS monitored at 540, 550, 540 and 550 nm, respectively, under 337 nm excitation at 298 K; (C) time-resolved PL spectra of polyfluorene Pdots/CNUS monitored at 450 nm under 337 nm excitation at 298 K; (D) EIS spectra of F8T2, CNUS and F8T2 Pdots/CNUS. All the mass ratios of polyfluorenes were 5 wt%. | ||
The time-resolved PL spectra were measured to investigate the charge carrier dynamics in the polyfluorene Pdots/CNUS heterojunctions as shown in Fig. 7B and C. The coupling of F8T2 with g-C3N4 could remarkably prolong the lifetime of the photogenerated electrons of F8T2. Interestingly, the lifetimes of F8T2 at 540 nm in all heterojunctions were increased accompanied by the increasing surface area of g-C3N4. Particularly, the PL lifetimes of F8T2 Pdots were significantly increased to 8.23 and 6.83 ns for F8T2 Pdots/CNUS and F8T2 Pdots/CNMS, respectively, when compared with the lifetime of pristine F8T2 of 0.57 ns (Table S4†). The significantly prolonged lifetime of F8T2 Pdots could be attributed to the nanosize effect that enhanced the electron–hole pair transfer between F8T2 Pdots and g-C3N4 nanosheets. In contrast, the PL lifetime for CNUS at 450 nm in the F8T2 Pdots/CNUS heterojunction is decreased from 8.24 to 6.12 ns (Fig. 7C and Table S5†). In addition, all of the polyfluorene/g-C3N4 nanosheet heterojunctions exhibited a decreased PL lifetime compared with those of the pristine g-C3N4 nanosheets (Fig. S15B and Table S5†), which could be ascribed to the reduced surface area54 identified by the reduced BJH surface areas (Table S1†), resulting from the pores occupied by F8T2 Pdots during the preparation process. Similarly, the observed PL lifetimes at 450 nm of F8BT Pdots/CNUS were reduced in comparison with those of pure CNUS (Fig. S15C and Table S5†).
Additionally, the electron transfer efficiency could be further identified from the electrochemical impedance spectra (EIS). The semicircular Nyquist plots for the F8T2 Pdots/CNUS heterojunction showed a smaller semicircle arc at high frequencies than those of F8T2 and CNUS (Fig. 7D and Table S6†), validating the reduced charge-transfer resistance of the F8T2 Pdots/CNUS system.19
3.3 The improved hydrogen evolution photocatalysis of F8T2 Pdots/CNUS
Photocatalytic hydrogen evolution by the heterojunctions without co-catalysts was performed under visible-light irradiation (>400 nm) using triethanolamine (TEOA) as a scavenger. It should be noted that no hydrogen evolution rate (HER) could be detected for either bulk g-C3N4 or g-C3N4 nanosheets without platinum co-catalysts in our experiments. In addition, pristine F8T2 and F8BT exhibited no detectable HER, because the pristine F8T2 and F8BT floated on the water surface with poor dispersion which is ascribed to their lower density than water and their poor dispersion in water. Fig. 8A presents the photocatalytic hydrogen evolution activity of the F8T2 Pdots/CNUS and F8BT Pdots/CNUS heterojunctions with Pdot/nanosheet = 5 wt%, with a HER of 929.3 and 439.6 μmol h−1 g−1, respectively. The F8T2 Pdots/CNUS exhibited 2.1 times higher hydrogen evolution photoactivity than F8BT Pdots/CNUS, which could be attributed to the significantly increased active sites and the efficient electron separation and transfer. Moreover, F8T2 Pdots/CNUS and F8BT Pdots/CNUS heterojunctions demonstrated a much higher photocurrent intensity (Fig. S17†) than CNUS, F8T2 and F8BT, supporting the more efficient electron–hole pair separation and transfer of the heterojunctions. Besides, F8T2 Pdots/CNUS exhibited a much higher photocurrent intensity than F8BT Pdots/CNUS, indicating the more efficient photogenerated electron–hole separation efficiency of F8T2 Pdots than F8BT Pdots, thus leading to a higher HER. The nanosize effect contributing to the hydrogen evolution activity could also be proved by the comparison of F8T2 Pdots/CNUS and F8T2/CNU heterojunctions: the F8T2/CNU heterojunction shows a much lower HER of 191.9 μmol h−1 g−1 (Fig. S16A†) due to the F8T2 aggregation on the surface of CNU. This means that the HER of F8T2 Pdots/CNUS was 4.8 times higher than that of F8T2/CNU, while the specific surface area of F8T2 Pdots/CNUS was only 2.2 times higher than that of F8T2/CNU. Similarly, the HER of F8T2 Pdots/CNMS was 17.3 times higher than that of F8T2/CNM (25.4 μmol h−1 g−1), while its specific surface area was only 10.9 times higher than that of F8T2/CNU. Thus, the formation of Pdots could significantly enhance the HER.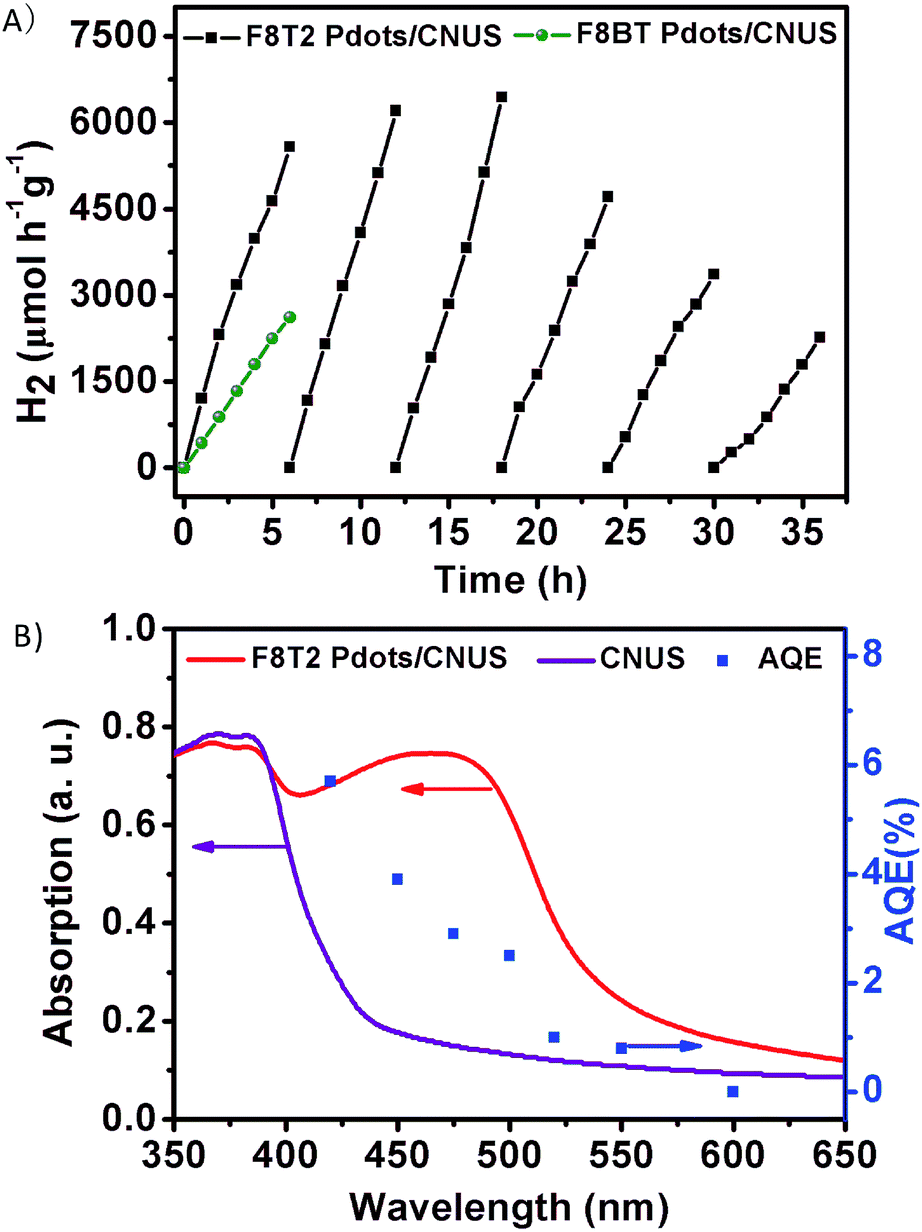 | ||
| Fig. 8 (A) The hydrogen evolution activity of polyfluorene Pdots/CNUS and hydrogen evolution stability of the F8T2 Pdots/CNUS heterojunction under visible light irradiation (λ > 400 nm) with 10 vol% triethanolamine as a hole scavenger; (B) wavelength dependence of the AQE of F8T2 Pdots/CNUS (right) with the UV-Vis diffuse reflectance spectra of F8T2 Pdots/CNUS and CNUS (left). | ||
The photocatalytic activity of the F8T2 Pdots/CNUS was positively correlated with the increasing F8T2 content from 1.0 to 5.0 wt% (Fig. S16B†). The increase in the F8T2 content could extend the optical absorption range and accelerate electron separation and transfer, resulting in an enhanced HER. A further increase in the F8T2 proportion to 7 wt% resulted in regional F8T2 aggregation in CNUS macropores, which could be proved by the decreased average pore size from 21.8 nm for F8T2 Pdots/CNUS-5% to 13.1 nm for F8T2 Pdots/CNUS-7% (Table S1†) while their specific surface areas remained almost the same as that of F8T2 Pdots/CNUS-5%. The excess loading of F8T2 onto CNUS could lead to agglomerated F8T2, which could not significantly promote the visible light absorption and electron transfer, so the HER performance could not be further increased.55,56 The cycling measurements of photocatalytic hydrogen evolution over F8T2 Pdots/CNUS-5% under visible light irradiation (>400 nm) were carried out with 6 runs for 36 h. As shown in Fig. 8A, it could be observed that there was no obvious photocatalysis deactivation in hydrogen evolution after 3 cycles. The decrease of photocatalytic activity after the 4th cycle can be probably ascribed to the potential decomposition of Pdots (as the holes transferred towards the Pdots) and the aggregation of F8T2 Pdots during the photocatalysis process, which was proved by the TEM image (Fig. S18A†). The F8T2 Pdots aggregated much more significantly after the 6th cycle (Fig. S18B†), which could lead to a further decrease in photocatalytic activity. The effect of the catalyst's concentration on photocatalytic activity was investigated and is shown in Fig. S16C.† As the catalyst's concentration increased from 20 to 50 mg (2.5 times), the HER accordingly increased from 15.3 to 39.7 μmol (2.6 times), indicating the linear relationship between the catalyst amount and the HER. However, as the catalyst's concentration further increased from 50 to 100 mg (2.0 times), the HER only increased from 39.7 to 50.9 μmol (1.28 times), suggesting that the HER reached saturation at 100 mg under the photocatalysis conditions. Thus, the apparent quantum efficiency (AQE) for hydrogen evolution was calculated to be 5.7% at 420 nm (Fig. 8B) for 100 mg F8T2 Pdots/CNUS heterojunctions. Although the CNUS possessed poor absorption in the range of 550–450 nm, the F8T2 Pdots/CNUS heterojunction displays AQE values of 0.8–3.8% at 550–450 nm, indicating that the widely extended absorption range and enhanced absorption intensity of the F8T2 Pdots/CNUS heterojunction could significantly improve the photocatalytic efficiency within the visible light range. Therefore, it could be concluded that the metal-free F8T2 Pdots/CNUS heterojunction possessed a significant efficiency and high stability, providing a promising approach for metal-free photocatalysis.
4 Conclusion
In summary, polyfluorenes were coupled with g-C3N4 nanosheets to form Pdots/g-C3N4 nanosheet heterojunctions. Such 0-dimensional/2-dimensional heterojunctions have the advantages of a broad light absorption range, high specific area and metal-free composition. Moreover, the Pdots demonstrate high stability, a uniformly distributed size and a prolonged lifetime. The Pdots/g-C3N4 nanosheet heterojunctions could boost photocatalytic activity through nanosize effects of Pdots and charge separation effects of the heterojunction. In addition to the great potential of Pdots/g-C3N4 nanosheet heterojunctions for water splitting, this work can provide a facile preparation method for incorporating Pdots into a wide variety of devices.Conflicts of interest
There are no conflicts to declare.Acknowledgements
The authors thank the National Natural Science Foundation of China (Grant No. 51503229 and 51833011) and the Guangdong YangFan Innovative & Entrepreneurial Research Team Program (Project No. 201633002).References
- Y. Zheng, L. Lin, B. Wang and X. Wang, Angew. Chem., Int. Ed., 2015, 54, 12868–12884 CrossRef CAS PubMed.
- V. W. Lau, M. B. Mesch, V. Duppel, V. Blum, J. Senker and B. V. Lotsch, J. Am. Chem. Soc., 2015, 137, 1064–1072 CrossRef CAS PubMed.
- A. Vinu, K. Ariga, T. Mori, T. Nakanishi, S. Hishita, D. Golberg and Y. Bando, Adv. Mater., 2005, 17, 1648–1652 CrossRef CAS.
- L. Shi, Z. Li, K. Marcus, G. Wang, K. Liang, W. Niu and Y. Yang, Chem. Commun., 2018, 54, 3747–3750 RSC.
- M. K. Bhunia, S. Melissen, M. R. Parida, P. Sarawade, J. M. Basset, D. H. Anjum and K. Takanabe, Chem. Mater., 2015, 27, 8237–8247 CrossRef CAS.
- Q. Han, B. Wang, Y. Zhao, C. G. Hu and L. T. Qu, Angew. Chem., Int. Ed., 2015, 54, 11433–11437 CrossRef CAS PubMed.
- Q. Liang, Z. Li, X. Yu, Z. H. Huang, F. Kang and Q. H. Yang, Adv. Mater., 2015, 27, 4634–4639 CrossRef CAS PubMed.
- X. Wang, K. Maeda, A. Thomas, K. Takanabe, G. Xin and J. M. Carlsson, Nat. Mater., 2009, 8, 76–80 CrossRef CAS PubMed.
- G. Zhang, Z. A. Lan, L. Lin, S. Lin and X. Wang, Chem. Sci., 2016, 7, 3062–3066 RSC.
- G. Zhang, Z. A. Lan, L. Lin, S. Lin and X. Wang, Chem. Sci., 2016, 7, 3062–3066 RSC.
- Y. Zhang, T. Mori, J. Ye and M. Antonietti, Chem.–Asian J., 2010, 132, 6294–6295 CAS.
- Y. Zhu, T. Ren and Z. Yuan, ACS Appl. Mater. Interfaces, 2015, 7, 16850–16856 CrossRef CAS PubMed.
- S. C. Yan, Z. S. Li and Z. G. Zou, Langmuir, 2010, 26, 3894–3901 CrossRef CAS PubMed.
- J. Chen, Z. Hong, Y. Chen, B. Lin and B. Gao, Mater. Lett., 2015, 145, 129–132 CrossRef CAS.
- W. Wang, J. C. Yu, Z. Shen, D. K. Chan and T. Gu, Chem. Commun., 2014, 50, 10148–10150 RSC.
- H. Ou, L. Lin, Y. Zheng, P. Yang, Y. Fang and X. Wang, Adv. Mater., 2017, 29, 1700008–1700014 CrossRef PubMed.
- X. Bai, L. Wang, R. Zong and Y. Zhu, J. Phys. Chem. C, 2013, 117, 9952–9961 CrossRef CAS.
- P. Yang, H. Ou, Y. Fang and X. Wang, Angew. Chem., Int. Ed., 2017, 56, 3992–3996 CrossRef CAS PubMed.
- M. Ye, Z. Zhao, Z. Hu, L. Liu, H. Ji, Z. Shen and T. Ma, Angew. Chem., Int. Ed., 2017, 129, 8407–8411 CrossRef PubMed.
- W. Liu, L. Cao, W. Cheng, Y. Cao, X. Liu, W. Zhang, X. Mou, L. Jin, X. Zheng, W. Che, Q. Liu, T. Yao and S. Wei, Angew. Chem., Int. Ed., 2017, 56, 9312–9317 CrossRef CAS PubMed.
- Y. Guo, J. Li, Y. Yuan, L. Li, M. Zhang, C. Zhou and Z. Lin, Angew. Chem., Int. Ed., 2016, 55, 14693–14697 CrossRef CAS PubMed.
- L. Sun, M. Yang, J. Huang, D. Yu, W. Hong and X. Chen, Adv. Funct. Mater., 2016, 26, 4943–4950 CrossRef CAS.
- W. Lin, W. Hong, L. Sun, D. Yu, D. Yu and X. Chen, ChemSusChem, 2018, 11, 114–119 CrossRef CAS PubMed.
- L. Sun, W. Hong, J. Liu, M. Yang, W. Lin, G. Chen, D. Yu and X. Chen, ACS Appl. Mater. Interfaces, 2017, 9, 44503–44511 CrossRef CAS PubMed.
- P. Niu, M. Qiao, Y. Li, L. Huang and T. Zhai, Nano Energy, 2017, 44, 73–81 CrossRef.
- P. Niu, H. Li, Y. Ma and T. Zhai, J. Phys. Chem. C, 2018, 122(36), 20717–20726 CrossRef CAS.
- R. Fischer, J. Kolleboyina, T. Toyao, V. Ranc, C. Rösler and M. Petr., J. Mater. Chem. A, 2016, 4, 18037–18042 RSC.
- J. Yuan, J. Wen, Y. Zhong, X. Li, Y. Fang, S. Zhang and W. Liu, J. Mater. Chem. A, 2015, 3, 18244–18255 RSC.
- J. Ma, X. Tan, F. Jiang and T. Yu, Catal. Sci. Technol., 2017, 7, 3275–3282 RSC.
- S. Kumar, N. Reddy, A. Kumara, M. Shankar and V. Krishnan, Int. J. Hydrogen Energy, 2018, 43, 3988–4002 CrossRef CAS.
- Y. Sui, J. Liu, Y. Zhang, X. Tian and W. Chen, Nanoscale, 2013, 5, 9150–9155 RSC.
- H. J. Yan and Y. Huang, Chem. Commun., 2011, 47, 4168–4170 RSC.
- J. Chen, C. L. Dong, D. Zhao, Y. C. Huang, X. Wang and L. Samad, Adv. Mater., 2017, 29, 1606198 CrossRef PubMed.
- J. Zhang, M. Zhang, R. Sun and X. Wang, Angew. Chem., Int. Ed., 2012, 51, 10145–10149 CrossRef CAS PubMed.
- J. Liu, H. Wang, J. Bai, T. Li, Y. Yang, Y. Peng and B. Wang, J. Mater. Chem. A, 2017, 5, 24920–24928 RSC.
- Q. Han, B. Wang, J. Gao and L. Qu, Angew. Chem., Int. Ed., 2016, 55, 10849–10853 CrossRef CAS.
- J. Liu, Y. Liu, N. Y. Liu, Y. Z. Han, X. Zhang, H. Huang, Y. Lifshitz, S. T. Lee, J. Zhong and Z. H. Kang, Science, 2015, 347, 970–974 CrossRef CAS PubMed.
- A. Suryawanshi, P. Dhanasekaran, D. Mhamane, S. Kelkar, S. Patil, N. M. Gupta and S. Ogale, Int. J. Hydrogen Energy, 2012, 37, 9584–9589 CrossRef CAS.
- Y. L. Chang, R. E. Palacios, F. R. Fan, A. J. Bard and P. F. Barbara, J. Am. Chem. Soc., 2008, 130, 8906–8907 CrossRef CAS PubMed.
- C. Wu, C. Szymanski, C. Cain and Z. Mcneill, J. Am. Chem. Soc., 2007, 129, 12904–12905 CrossRef CAS PubMed.
- R. E. Palacios, F. R. Fan, J. K. Grey, J. Suk and A. J. Bard, Nat. Mater., 2007, 6, 680–685 CrossRef CAS PubMed.
- F. Ye, C. Wu, Y. Jin, Y. H. Chan, X. Zhang and D. T. Chiu, J. Am. Chem. Soc., 2011, 133, 8146–8149 CrossRef CAS.
- C. Wu, B. Bull, C. Szymanski, K. Christensen and J. McNeill, ACS Nano, 2008, 2, 2415–2423 CrossRef CAS.
- C. Szymanski, C. Wu, J. Hooper, M. A. Salazar, A. Perdomo, A. Dukes and J. D. McNeill, J. Phys. Chem. B, 2005, 109, 8543 CrossRef CAS.
- L. Wang, R. Fernandezteran, L. Zhang, D. L. Fernandes, L. Tian, H. Chen and H. Tian, Angew. Chem., Int. Ed., 2016, 55, 12306–12310 CrossRef CAS.
- P. Tseng, C. Chang, Y. Chan, L. Ting, P. Chen, C. Liao, M. Tsai and H. Chou, ACS Catal., 2018, 8, 7766–7772 CrossRef CAS.
- Y. Zheng, Y. Jiao, Y. Zhu, L. H. Li, Y. Han, Y. Chen, A. Du, M. Jaroniec and S. Z. Qiao, Nat. Commun., 2014, 5, 3783 CrossRef PubMed.
- L. Shi, K. Chang, H. B. Zhang, X. Hai, L. Q. Yang, T. Wang and J. H. Ye, Small, 2016, 12, 4431–4439 CrossRef CAS.
- R. Street, K. Song, J. Northrup and S. Cowan, Phys. Rev. B: Condens. Matter Mater. Phys., 2011, 83, 616–619 CrossRef.
- S. Lee, S. Hotta and F. Nakanishi, J. Phys. Chem. A, 2000, 104, 1827–1833 CrossRef CAS.
- X. Zhang, X. Xie, H. Wang, J. Zhang, B. C. Pan and Y. Xie, J. Am. Chem. Soc., 2013, 135, 18–21 CrossRef CAS.
- X. Zhang, H. Wang, H. Wang, Q. Zhang, J. Xie, Y. Tian and Y. Xie, Adv. Mater., 2014, 26, 4438–4443 CrossRef CAS.
- P. A. Levermore, R. Jin, X. H. Wang, J. C. D. Mello and D. D. C. Bradley, Adv. Funct. Mater., 2009, 19, 950–957 CrossRef CAS.
- X. Dong and F. Cheng, J. Mater. Chem. A, 2015, 3, 23642–23652 RSC.
- X. Zhang, B. Peng, S. Zhang and T. Peng, ACS Sustain. Chem. Eng., 2015, 3, 1501 CrossRef CAS.
- Z. Xing, Z. Chen, X. Zong and L. Wang, Chem. Commun., 2014, 50, 6762 RSC.
Footnote |
| † Electronic supplementary information (ESI) available: TEM images, STEM images, AFM images, nitrogen adsorption–desorption isotherms, pore size distribution data, XRD patterns, XPS spectra, Mott–Schottky plots, CV curves, UV-Vis spectra, PL spectra, time-resolved PL spectra and lifetime data. See DOI: 10.1039/c8ta09735f |
| This journal is © The Royal Society of Chemistry 2019 |