Hypervalent silicon-based, anionic porous organic polymers with solid microsphere or hollow nanotube morphologies and exceptional capacity for selective adsorption of cationic dyes†
Gang
Xiong
 *a,
Bin-Bin
Wang
a,
Li-Xin
You
 a,
Bao-Yi
Ren
a,
Yong-Ke
He
a,
Fu
Ding
a,
Ileana
Dragutan
*b,
Valerian
Dragutan
b and
Ya-Guang
Sun
a,
Bao-Yi
Ren
a,
Yong-Ke
He
a,
Fu
Ding
a,
Ileana
Dragutan
*b,
Valerian
Dragutan
b and
Ya-Guang
Sun
 *a
*a
aThe Key Laboratory of Inorganic Molecule-Based Chemistry of Liaoning Province, Shenyang University of Chemical Technology, Shenyang, 110142, China. E-mail: sunyaguang@syuct.edu.cn; xg@syuct.edu.cn
bInstitute of Organic Chemistry, Romanian Academy, Bucharest, 060023, Romania. E-mail: idragutan@yahoo.com
First published on 26th November 2018
Abstract
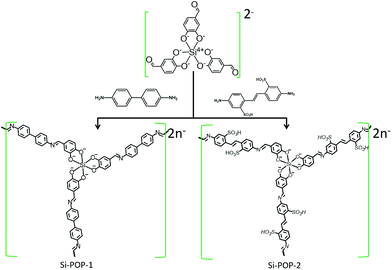
We report straightforward access to two new anionic porous organic polymers (Si-POPs) based on hexacoordinate [SiO6]2– species and polyimine aromatic linkers which exhibit outstanding capabilities for removal of cationic dyes from contaminated industrial water. These multifunctional materials are stable under air and in water; they were synthesized via solvothermal chemistry exploiting Schiff base formation between tri(protocatechuic aldehyde)-silicate and 4,4′-diaminobiphenyl acid (for Si-POP-1) or 4,4′-diamino-2,2′-stilbenedisulfonic acid (for Si-POP-2). Charge neutrality of the Si-POPs was achieved by [Et3NH]+ cations. The structures were determined by spectroscopic techniques (FT-IR and solid 13C-NMR spectroscopy), while SEM and TEM revealed a micrometer-scale solid sphere morphology for Si-POP-1 and hollow nanometer-sized tubes for Si-POP-2. BET specific surface area determination gave 376 and 234 m2 g−1 for Si-POP-1 and Si-POP-2, respectively. The unprecedented adsorption abilities of these materials for standard cationic dyes such as methylene blue (MB), malachite green (MG), and Basic Blue 7 (BB7) were revealed by studying the effects of system variables such as pH, contact time, temperature and mixed-dye solutions. At 25 °C, the maximum adsorption capacity of Si-POP-1 reached 300.3 mg g−1 for MB and 378.5 mg g−1 for MG, while the performance of Si-POP-2 at the same temperature was substantially higher (3516 mg g−1 for MB and 662 mg g−1 for MG). Furthermore, at 35 °C, the maximum adsorption of MB on Si-POP-2 reached 4098 mg g−1, surpassing the performance of previous adsorbents. It was found that both Si-POP-1 and Si-POP-2 exhibit charge and size-selective adsorption. Thermodynamics studies indicated that the adsorptions were spontaneous and endothermic. A minimal loss of adsorptive capacity of Si-POP-2 (less than 4%) was observed after four cycles, demonstrating an effective reuse of the regenerated POP in discarding MB from effluents. Importantly, this green protocol also allows recovery of the dye retained in the POP. These assets recommend these new hexacoordinate silicate-based adsorbents as viable materials for wastewater remediation by removal of organic dye pollutants affecting nature and public health.
Introduction
The unprecedented growth of the global population during the last few decades has triggered tremendous progress in all areas of human activities, including introduction of advanced materials structurally fitted for specific applications. Recently, special purpose networks such as metal–organic frameworks (MOFs),1 zeolitic imidazolate frameworks (ZIFs),2 covalent organic frameworks (COFs)3, porous organic polymers (POPs)4,5 and porous coordination polymers (PCPs)6 endowed with controlled morphologies and tunable porosities, high surface areas, and pre-established chemical functionalities have witnessed spectacular valorization in nanotechnology,7 adsorption processes,8 energy storage,9 catalysis,10 chemical and biological sensing,11 medical fields,12 photovoltaic, magnetic or luminescent devices,13etc.In this context, porous organic polymers (POPs), well-established, inexpensive materials that are usually constructed through covalent bonds between C, H, O and N atoms, are equipped with high specific surface areas, low densities and rationally designed, permanent porosities. They have found many attractive applications14 in gas storage and separation, in catalysis and as catalyst supports, in drug delivery and biomedical practice and also, importantly, for adsorption of dyes, which are noxious contaminants found in effluents flowing from facilities related to textile, leather, paint, paper and other industries. With the growing demand for coloured materials, ever-increasing amounts of harmful dye pollutants are being discharged into oxygen-impoverished wastewater; these pollutants must be removed to clean the water and thus ensure environmental remediation.
Various physical, chemical and biological methods have been employed to remove organic dyes, which are hazardous to health, from industrial wastewater.15–17 Among these, adsorption on solid networks is the most productive technique due to its low cost, superior efficiency, and simple operation.18 Because adsorbents are at the core of this strategy, it is imperative to conceptualize new adsorbents with ultrahigh adsorption capacities and outstanding selectivities in order to effectively separate dyes from industrial effluents. Charged adsorbents boast considerably improved adsorption capacities and selectivities due to the concerted effects of host–guest electrostatic (and electronic) interactions and guest–guest exchange interactions.19 Consequently, charged adsorbents, such as chemically modified activated carbon materials,20 cation/anion metal–organic frameworks (MOFs)19,21,22 and charged porous organic polymers (COFs, POPs),23,24 surpass their neutral counterparts. However, the need for this type of adsorbent is currently still largely unmet.
To address the progressive trend of charged adsorbents, which are of utmost economic importance for the capture of noxious substances from the environment, this work aimed to prepare new anionic microporous organic polymers (Si-POP-1 and Si-POP-2) with exceptionally high adsorption strengths and selectivities for cationic dyes. Our protocol started from inexpensive, commercially available materials and employed a facile, easily scalable synthesis that yielded POPs with defined microporosities, morphologies, and specific BET surface areas. The results highlight that a simple ligand modification in the Schiff base formation step of the synthesis has an irrefutable influence on the adsorption capacity of the Si-POP. Four charged organic dyes, malachite green (MG), methylene blue (MB), Basic Blue 7 (BB7) and methyl orange (MO), commonly employed in industry and in other fields, were tested as a proof of concept that our hexacoordinated silicon-based POPs are valuable materials that are unique with regard to their removal ability of cationic dyes from human habitats. The adsorption isotherms, kinetics, thermodynamics, and factors potentially affecting the process, such as pH value, ionic strength of the solution and selective adsorption from mixed dye solutions, are also systematically investigated.
Experimental
Materials and physical measurements
All solvents and reagents for the syntheses were of analytical grade and were used as received from commercial sources without further purification. The Si-precursor (Et3NH)2{[(CHO)C6H3O2]3Si} was prepared by following a slightly modified literature procedure resulting in increased isolated yields, as shown in the ESI.† Elemental analyses (C, H and N) were carried out with a Perkin-Elmer 240C elemental analyzer. The IR spectra were measured in the 4000 to 400 cm−1 region using a Nicolet IR-408 spectrometer and KBr pellets. Thermogravimetric (TG) curves were recorded from room temperature to 800 °C with a heating rate of 10 °C min−1 on a Netzsch TG 209 instrument under nitrogen atmosphere. The N2 adsorption isotherms were measured by a V-Sorb 2800TP surface area and pore size analyzer at 77 K. The solid 13C-NMR spectra were collected on a JNM-ECZ600R instrument. Transmission electron microscopy (TEM) and scanning electron microscopy (SEM) analyses were conducted with JEOL-2100F and JSM-4800F electron microscopes (JEOL, Japan), respectively. UV-vis spectra were measured using a UV-vis 2550 spectrophotometer (Shimadzu, Japan). Powder X-ray diffraction (PXRD) patterns of the samples were performed on a Bruker D8 Advance X-ray diffractometer with Cu Kα (λ = 1.5418 Å) radiation, at room temperature, with a 2θ range from 2 to 40°.Synthetic procedures
General procedures for dye adsorption experiments
Four model cationic dyes (methylene blue, MB, malachite green, MG, Basic Blue 7, BB7 and Alcian Blue 8GX, AB8GX) and an anionic dye (methyl orange, MO) were used in the study (for their structures, see the ESI, Fig. S1†) to assess the adsorption abilities and selectivities of our materials. MB, at variance with phenothiazine, to which it is structurally connected, is positively charged and adopts a planar configuration, which is important for its interactions with anionic adsorbents. MB has long been considered as an effective medicine and is ubiquitously employed in hospitals, especially its blue water solution; however, it has harmful effects on living organisms, even after short exposure. Methylene blue is used in a variety of other fields, including dyeing. Malachite green, an iminium salt formally related to triphenylmethane, is used in the dyestuff industry (for silk, leather, and cotton) and as an antibacterial agent. Anions (usually chloride or oxalate) associated with the MG cation do not influence the result of the colouring process. Basic Blue 7, also known as Victoria Blue BO, is used in the dye industry and in aquaculture for antifungal treatment. Like MG, BB7 is a triarylmethane dye; however, instead of a phenyl group, it contains a naphtylamine group and hence is substantially bulkier. MG and BB7 can adopt multiple resonance structures, with the aromatic rings flipping in different planes, and have larger volumes than the quasi-planar MB. These factors, in addition to the dissimilar chemisorption and physisorption properties of Si-POP-1 and Si-POP-2 (vide infra), contribute to the distinct observed adsorption behaviours. Alcian Blue 8GX (greenish-black crystals soluble in water) is a cationic dye that has long been applied in biological and medical studies to produce stable and fast light staining.To investigate the adsorption capacities of Si-POP-1 and Si-POP-2 for MB, MG, BB7, AB8GX and MO, we used aqueous solutions with desired concentrations of the dye, prepared with deionized water. Experiments were performed in a thermostatic shaker bath at 160 rpm for a fixed time (10 min to 13 h). After adsorption for the selected time, the suspension was separated by centrifugation; the residual concentration of dye in the centrifugate was determined by UV-vis spectroscopy using a UV-vis 2550 spectrophotometer (Shimadzu, Japan) at the absorbance wavelengths of 664 nm and 617 nm for MB and MG, respectively. The detailed procedures are described in the ESI.† If necessary, the dye concentrations were diluted before analysis. The dye concentration in the adsorbent phase, at equilibrium or at time t was calculated using the equation qe = (c0 − ce)V/m or qt = (c0 − ct)V/m, where qe and qt are the amounts (mg g−1) of dye adsorbed at equilibrium and time t. c0, ce, and ct are the liquid-phase concentrations (mg L−1) of the dye initially, at equilibrium, and at time t, respectively; V and m represent the volume (in L) of the dye solution and the mass (in g) of the adsorbent, respectively.
Results and discussion
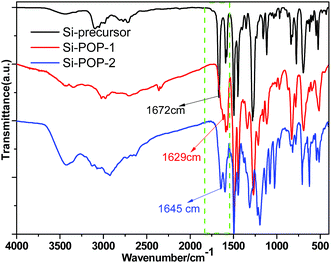
The chemical structures of the Si-precursor, Si-POP-1 and Si-POP-2 were inferred from their FT-IR and solid 13C NMR spectra. In FT-IR (Fig. 1), a strong absorption peak at 1672 cm−1 can be clearly observed for the Si-precursor, corresponding to the stretching vibration of the C![[double bond, length as m-dash]](https://www.rsc.org/images/entities/char_e001.gif) O bond in protocatechuic aldehyde. This peak disappeared in the FT-IR spectra of Si-POP-1 and Si-POP-2, while new peaks appeared at 1629 cm−1 (for Si-POP-1) and 1645 cm−1 (for Si-POP-2); these are indicative of the formation of –C
O bond in protocatechuic aldehyde. This peak disappeared in the FT-IR spectra of Si-POP-1 and Si-POP-2, while new peaks appeared at 1629 cm−1 (for Si-POP-1) and 1645 cm−1 (for Si-POP-2); these are indicative of the formation of –C![[double bond, length as m-dash]](https://www.rsc.org/images/entities/char_e001.gif) N imine linkages.25a In addition, the wide peaks between 2800 and 3000 cm−1 in the above three FT-IR spectra can be attributed to the asymmetric stretching vibrations of –CH3 and –CH2–, indicating the presence of positively charged triethylammonium.
N imine linkages.25a In addition, the wide peaks between 2800 and 3000 cm−1 in the above three FT-IR spectra can be attributed to the asymmetric stretching vibrations of –CH3 and –CH2–, indicating the presence of positively charged triethylammonium.
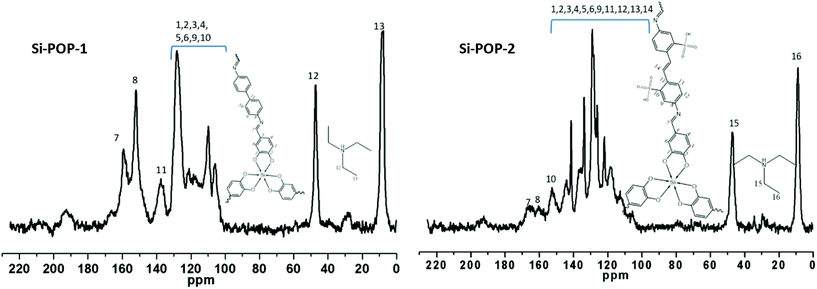
The solid 13C NMR spectra of Si-POP-1 and Si-POP-2 (Fig. 2) confirmed their structures. The chemical shifts at 8.2 ppm for Si-POP-1 and 8.8 ppm for Si-POP-2 were assigned to the methyl groups from trimethylamine, while the chemical shift at 47 ppm, observed for both Si-POP-1 and Si-POP-2, was ascribed to the methylene groups from triethylamine. These signals undoubtedly prove that Si-POP-1 and Si-POP-2 incorporate triethylammonium as the quaternary ammonium cation in order to balance the charge of the system. The chemical shifts at 159 ppm (for Si-POP-1) and 165 ppm (for Si-POP-2), assigned to the –C![[double bond, length as m-dash]](https://www.rsc.org/images/entities/char_e001.gif) N linkage, demonstrate the formation of the Schiff base, further confirming the imine structures proposed for Si-POP-1 and Si-POP-2. The chemical shift at about 190 ppm can be assigned to the aldehyde carbon from unreacted CHO groups at the margins of the Si-POP-1 and Si-POP-2 networks and/or of Si-precursor molecules wrapped in pores. However, the small area of the peak at ca. 190 ppm suggests that very small amounts of unreacted aldehyde groups are present in the Si-POP-1 and Si-POP-2 materials.
N linkage, demonstrate the formation of the Schiff base, further confirming the imine structures proposed for Si-POP-1 and Si-POP-2. The chemical shift at about 190 ppm can be assigned to the aldehyde carbon from unreacted CHO groups at the margins of the Si-POP-1 and Si-POP-2 networks and/or of Si-precursor molecules wrapped in pores. However, the small area of the peak at ca. 190 ppm suggests that very small amounts of unreacted aldehyde groups are present in the Si-POP-1 and Si-POP-2 materials.
Studies by conventional thermogravimetric analysis (TGA) of Si-POP-1 and Si-POP-2 proved their thermal stability up to 270 °C, as anticipated considering their robust Schiff base and silicate structural motifs. A totally different degradation profile, between 270 °C and 800 °C, was observed for the two adsorbents (Fig. S2†). Si-POP-1 practically underwent a smooth weight loss from 270 °C to 800 °C, while three weight-loss steps were observed for Si-POP-2, i.e. a first slight loss between 270 °C and 420 °C followed by a sharp decrease from 420 °C to 450 °C and, finally, a second negligible drop in weight up to 800 °C. The different thermal degradation behaviours of Si-POP-1 and Si-POP-2 stem from the additional presence of SO3H groups in Si-POP-2. Meanwhile, for both adsorbents, the smooth mass loss between 270 °C and 420 °C can be assigned to continuous degradation of the organic polymer chain and release of triethylammonium; the abrupt decay between 420 °C and 450 °C for Si-POP-2 can be accounted for by the rapid release of SO3H groups. The distinct thermal degradation profiles of Si-POP-1 and Si-POP-2 are an important aspect in view of the practical applications of these two materials.
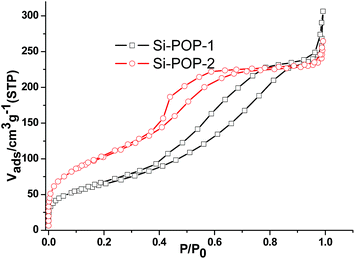
The N2 adsorption isotherms of Si-POP-1 and Si-POP-2 showed type-IV curves25b (Fig. 3). The Brunauer–Emmett–Teller surface areas (SBET) of activated Si-POP-1 and Si-POP-2 were calculated to be 376 and 234 m2 g−1, respectively (P/P0 = 0.05 to 0.25; Fig. S3†). The pore size distributions of Si-POP-1 and Si-POP-2 were calculated based on non-local density function theory (NLDFT) (curves presented in Fig. S4†). In Si-POP-1 and Si-POP-2, the micropores are centered at about 1.4 and 1.3 nm, while the mesopores are centered around 3.2 and 4.1 nm, respectively. The pore volumes for Si-POP-1 and Si-POP-2 are 0.36 and 0.33 cm3 g−1 (P/P0 = 0.9). The triethylammonium cations, located in the pores, determine the relatively low values of the SBET and pore volumes.
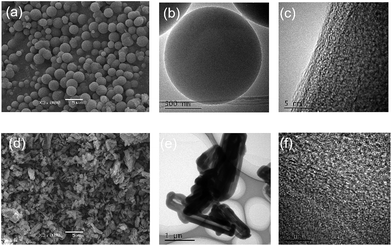
SEM images (Fig. 4, S5 and S6†) disclosed that the morphologies of the Si-POP-1 samples obtained at 130 °C, 135 °C and 140 °C are pure, solid microspheres with sizes of 1 to 5 μm; meanwhile, in the Si-POP-1 samples prepared at 120 °C and 145 °C, some irregular blocks formed among the micron-sized solid spheres. The morphologies of Si-POP-2 synthesized at 120 °C, 130 °C, 135 °C and 140 °C were found to be hollow nanotubes, with diameters of about 0.5 μm and wall thicknesses of about 200 nm. However, larger diameters were observed for the hollow tubes in the Si-POP-2 obtained at 145 °C. Furthermore, HRTEM (Fig. 4) reveals Si-POP-1 and Si-POP-2 to be solid microspheres and hollow nanotubes with pore textures, respectively. In the microporous organic polymer series, the hollow tube morphology is rarely reported.
The rationale for the different morphologies of our two materials may be their template-directed synthesis:26 in Si-POP-1, the triethylammonium cation acted as a template, determining the formation of microspheres, while a mixed template (the triethylammonium cation and the sulphonic group) was responsible for creating the hollow nanotube morphology of Si-POP-2. Because the morphology, particle size, surface area, and pore structure jointly determine the properties of materials, the distinct adsorption behaviours of Si-POP-1 and Si-POP-2, discussed later, stem from the abovementioned differences in these characteristics. In addition, the broad bands extending from about 15° to 35° in the PXRD pattern (Fig. S7†) revealed the amorphous natures of Si-POP-1 and Si-POP-2, possibly with some chain crosslinking.
The temperature at which the synthesis of Si-POP-1 and Si-POP-2 was carried out had definite effects on the morphology of the material; we then sought to determine whether this changed morphology would further affect the efficiency of dye adsorption. To test this hypothesis, POP-s obtained at different temperatures were used to adsorb MB as a representative dye (the results are presented in Fig. S8†). Si-POP-1 samples prepared at 130 °C, 135 °C and 140 °C exhibited similar adsorption behaviours of approximately 295 mg g−1, while the adsorptions of the samples produced at 120 °C and 145 °C were much lower. An analogous pattern was observed for Si-POP-2: specimens produced at 130 °C, 135 °C and 140 °C presented comparable adsorption levels of about 3350 mg g−1. However, the adsorption capacities of Si-POP-2 originating from syntheses at 120 °C and 145 °C were about 3074 and 2600 mg g−1, respectively, which are lower than those of the samples synthesized from 130 °C to 140 °C. To conclude, the various morphologies of Si-POPs stemming from different synthesis temperatures led to obvious changes in their dye adsorption performance. Samples prepared at 135 °C, considered representative, were used in the adsorption experiments unless otherwise specified.
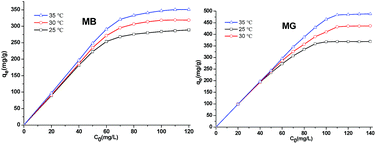
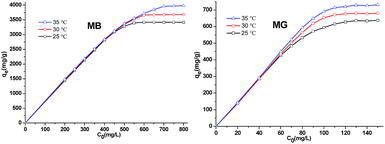
The influence of pH on the MB and MG adsorption patterns of Si-POP-1 and Si-POP-2 was studied in solution over the pH range of 3 to 8 at 25 °C. The pH was controlled by addition of 0.1 M HCl and 0.1 M NaOH as needed (Fig. S9 and S10†). In the cases of MB and MG adsorption on Si-POP-1, the maximum adsorptions occurred at pH 6 and pH 5, respectively. When the dyes were adsorbed on Si-POP-2, the saturated adsorption increased with pH up to pH 6 and then remained constant. These results indicated that Si-POP-2 exhibits the best adsorption performance in near-neutral aqueous solutions. The effects of the initial concentration on the equilibrium adsorption capacity of the dyes are shown in Fig. 5 and 6 at 25 °C, 30 °C and 35 °C. It is clear that at relatively low concentrations of MB and MG, the adsorbed amounts on Si-POP-1 and Si-POP-2 at equilibrium increased linearly with the initial concentration. Conversely, at high initial concentrations, the adsorption became constant, indicating that saturation was reached and the maximum adsorption capacity was attained.
The Langmuir and Freundlich isotherm models were applied to analyse the relationships between the adsorption capacity at equilibrium (qe, mg g−1) of Si-POP-1 and Si-POP-2 and the equilibrium concentrations of the MB and MG dyes (ce, mg L−1). The equations of the Langmuir (eqn (1)) and Freundlich (eqn (2)) isotherm models20b,c are presented below:
 | (1) |
 | (2) |
The fitting results are given in Tables 1 and S1.† The values of the correlation coefficient R2 obtained from fitting with the Freundlich isotherm model (Table S1†) greatly differ from unity, while the R2 values obtained from fitting with the Langmuir isotherm model (Table 1) are closer to 1; this indicates that the Langmuir model gives better fits to the experimental data. Examination of the adsorption capacities qmax and the Langmuir adsorption constants (kL) of MB and MG on Si-POP-1 and Si-POP-2, estimated from the Langmuir model, reveals that at 25 °C, the maximum adsorption capacities of Si-POP-1 for MB and MG are 300.3 and 378.8 mg g−1, respectively. Importantly, at saturation, the adsorption amounts of Si-POP-2 for MB and MG are 3516 and 662.2 mg g−1, respectively. These theoretical values are very close to the experimental values. Upon increasing the temperature, the adsorption capacities of Si-POP-1 and Si-POP-2 for MB and MG substantially increased. On both Si-POP materials, the adsorption of MB was considerably stronger than that of MG due to their different molecular sizes and shapes: MB, which contains three linearly condensed rings, is planar and smaller, whereas MG is bulkier because its three cycles are angularly disposed (Fig. S1†). Therefore, MB fits better in the empty inner spaces of both Si-POP matrices. Significantly, the adsorption capacity of Si-POP-2 for MB or MG is far superior to that of Si-POP-1. The main reason is that Si-POP-2, in addition to its different morphology (hollow nanotubes), possesses negatively charged sites (RSO3− groups) that are prone to electrostatic interactions.27
| Adsorbent | Dye | T (K) | q max (mg g−1) | q exp (mg g−1) | k L (L mg−1) | R 2 |
|---|---|---|---|---|---|---|
| Si-POP-1 | MB | 298.15 | 300.3 | 288.9 | 0.4076 | 0.9977 |
| 303.15 | 330.0 | 318.5 | 0.5861 | 0.9988 | ||
| 308.15 | 355.9 | 350.7 | 1.254 | 0.9995 | ||
| MG | 298.15 | 378.8 | 369.0 | 0.6804 | 0.9993 | |
| 303.15 | 450.4 | 436.1 | 0.6727 | 0.9991 | ||
| 308.15 | 500.0 | 488.2 | 1.163 | 0.9988 | ||
| Si-POP-2 | MB | 298.15 | 3516 | 3415 | 0.1151 | 0.9994 |
| 303.15 | 3806 | 3680 | 0.1245 | 0.9997 | ||
| 308.15 | 4098 | 3980 | 0.1341 | 0.9993 | ||
| MG | 298.15 | 662.2 | 637.6 | 0.3922 | 0.9966 | |
| 303.15 | 704.2 | 679.8 | 0.5441 | 0.9973 | ||
| 308.15 | 757.6 | 730.9 | 0.6875 | 0.9976 |
Next, the propensity of Si-POP-2 for adsorbing MB and MG was evaluated in comparison with that of other reported materials; note that we only considered materials which exhibit adsorption levels above 900 mg g−1 for MB and 600 mg g−1 for MG (Tables 2 and 3). From Table 2, it can be concluded that the adsorption capacity of Si-POP-2 for MB is ultra-high, greatly surpassing those of other adsorbents. The logical basis for this exceptional tendency is a combination of chemisorption within the pores of the adsorbent with physisorption, which is attributable to strong electrostatic interactions between the positively charged sites of the dyes and the negatively charged sites of the adsorbents. Both chemisorption and physisorption were strongly enhanced for Si-POP-2 due to the supplemental presence of the sulphonic groups (two for each silicate unit). The structural dissimilarity of the two adsorbents Si-POP-1 and Si-POP-2 consists mainly of the presence of a large number of sulphonic groups in the Si-POP-2 network. On account of this, we speculate that the great difference in the adsorption capacities of the two adsorbents is mainly due to the following: (1) sulphonic groups provide a large number of strong electrostatic interaction sites; as a result, cationic dye molecules tend to be adsorbed more densely on the inner surface of the adsorbent. In contrast, in Si-POP-1, the smaller number of sites and the weaker electrostatic interactions lead to sparse adsorption of dye molecules. (2) Sulphonic acid groups are hydrophilic, which is conducive to the diffusion and penetration of water molecules. In particular, water can rapidly and efficiently spread to the interior of the adsorbent, driving the small dye molecules to diffuse rapidly everywhere inside the adsorbent; this is propitious for electrostatic interactions between the dye molecules and the ionizable SO3H groups on the adsorbent framework. The high efficiency of space utilization provides extremely high dye adsorption capacity. However, in Si-POP-1, which is hydrophobic due to its lack of hydrophilic groups, diffusion of water and dye molecules within the adsorbent is very difficult. Consequently, the adsorption of the dye molecules and the ion exchange occur at the entrance of the channels, partially blocking them. Low space utilization leads to lower dye adsorption capacity. Therefore, the sulphonic groups play a crucial role in the adsorption process and essentially enhance it. Additionally, the hollow nanotube morphology and the adequate channel shape of Si-POP-2 provide better access of MB and MG for sustained chemisorption at the sulphonic groups, in contrast with Si-POP-1.
| Adsorbent | Adsorbed amount (mg g−1) | Ref. |
|---|---|---|
| Si-POP-2 | 3516 (25 °C) | This work |
| 3806 (30 °C) | This work | |
| 4098 (35 °C) | This work | |
| Calcium alginate membrane | 3056.4 (25 °C) | 28 |
| GO/MCC aerogels | 2630 (25 °C) | 29 |
| Sodium alginate crosslinked polyacrylic acid (SA-cl-poly(AA)–TiO2) | 2257.4 (45 °C) | 30 |
| Magnetic polyacrylamide microspheres | 1977 (30 °C) | 31 |
| GK-cl-P(AA-cl-AAM)/SiO2 nanocomposite (HNC) | 1408.7 (25 °C) | 32 |
| MIL-68 | 1666 (25 °C) | 33 |
| Commercial activated carbon | 980.3 (30 °C) | 34 |
| Chemically activated carbon spheres derived from poly(vinyl alcohol) microspheres | 925.9 (45 °C) | 35 |
| Teak wood bark | 914.6 (20 °C) | 36 |
| PVBA (43%)-UiO-66 | 909 (30 °C) | 37 |
| Adsorbent | Adsorbed amount (mg g−1) | Ref. |
|---|---|---|
| ZIF-67 | 2430 (20 °C) | 38 |
| Granular composite hydrogel (AA-IA-APT hydrogel) | 2433 | 39 |
| Magnetic β-cyclodextrin–graphene oxide nanocomposites (Fe3O4/β-CD/GO) | 990.10 (45 °C) | 40 |
| Si-POP-2 | 757 (35 °C) | This work |
| Novel grape waste activated carbon (GWAC) | 667 (room temp.) | 41 |
The ultra-high adsorption ability of Si-POP-2 for MB and MG is a prerequisite for its large-scale practical applications.
Adsorption thermodynamics provides information on the inherent energy changes in the adsorbent and on the mechanism involved in the adsorption process. The thermodynamics parameters, Gibbs free energy change (ΔG0, kJ mol−1), enthalpy change (ΔH0, kJ mol−1), and entropy change (ΔS0, J mol−1 K−1) can be calculated using the following equations:42
 | (3) |
ΔG0 = −RT![[thin space (1/6-em)]](https://www.rsc.org/images/entities/char_2009.gif) ln ln![[thin space (1/6-em)]](https://www.rsc.org/images/entities/char_2009.gif) Kd; Kd; | (4) |
 | (5) |
In these equations, Kd is the distribution coefficient for the adsorption, qe (mg g−1) is the amount of dye adsorbed per mass unit of the adsorbent at equilibrium and ce (mg L−1) is the concentration of the dye solution at equilibrium. R is the gas constant, with a value of 8.314 J mol−1 K−1, and T (K) is the thermodynamic temperature of the dye solution. The results evidenced that all the Gibbs free energy values were negative (Table S2†), ranging from −4.271 to −8.038 kJ mol−1; this suggests that adsorption of MB and MG on Si-POP-1 and Si-POP-2 is spontaneous. The increase of the absolute values of ΔG0 as a function of temperature convincingly indicated that the adsorption behaviours were spontaneous at higher temperatures. The large positive ΔH0 values of 64.55 kJ mol−1 for MG on Si-POP-1, 48.08 kJ mol−1 for MB on Si-POP-1, 38.43 kJ mol−1 for MG on Si-POP-2 and 42.74 kJ mol−1 for MB on Si-POP-2 show that adsorption was endothermic at the solid–solution interface.43 If ΔH0 is greater than 40 kJ mol−1, the adsorption process is considered to be chemisorption. In contrast, if the ΔH0 value is less than 40 kJ moL−1, the adsorption is a physisorption process. Therefore, the above high ΔH0 values indicate a chemisorption nature of the ion exchange, which is effective during adsorption of MB and MG on Si-POP-1 and Si-POP-2 (Fig. S15†).44 In fact, the super-high adsorption capacity of these two adsorbents should be attributed to synergism between chemisorption and physisorption, which was the underlying concept when designing our two adsorbents. The positive ΔS0 values suggest that during adsorption, the degrees of freedom increased at the solid–liquid interface.
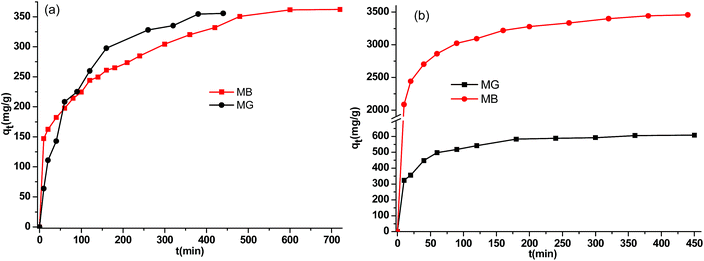
Two classical kinetics models, the pseudo-first-order kinetics model and pseudo-second-order kinetics model, are frequently used to evaluate the uptake rate and adsorption efficiency of an adsorbent as well as to analyse the mechanism of dye adsorption. These models43 can be expressed as ln(qe − qt) = ln![[thin space (1/6-em)]](https://www.rsc.org/images/entities/char_2009.gif) qe − k1t and t/qt = 1/k2(qe)2 + (1/qe)t, respectively, where qt and qe are the adsorbed amounts of dye at time t and at equilibrium (mg g−1), respectively, and t is the time (min); k1 and k2 are the pseudo-first-order rate constant (min−1) and the pseudo-second-order rate constant (g mg−1 min−1). The kinetic parameters were obtained by fitting the plots of qtvs. t (Fig. 7 and S16†) and are listed in Table S3.† In comparison with the pseudo-first-order kinetics model (Fig. S17†), the pseudo-second-order kinetics model is more suitable for analysing the adsorption kinetics because the values of the correlation coefficients R2 derived from the pseudo second-order model are closer to 1. Thus, this outcome suggests that MG and MB adsorption on Si-POP-1 and Si-POP-2 follows pseudo second-order kinetics. Thermodynamic and kinetic data collectively suggest that the driving force of MB and MG adsorption is chemisorption by ion exchange and electrostatic interactions. In the case of Si-POP-2, the ion exchange involves the cationic dye and the triethyl ammonium cations or hydrogens in the RSO3H groups. Electrostatic interactions intervene between the positively charged sites of the dye and the negatively charged sites on the adsorbent (i.e. octahedral silicate cores and RSO3− groups). Fortunately, π–π stacking interactions between the dye and the adsorbent participate in the process. Physisorption contributes to both diffusion and adsorption, particularly for Si-POP-2, which is endowed with a hollow nanotube morphology.
qe − k1t and t/qt = 1/k2(qe)2 + (1/qe)t, respectively, where qt and qe are the adsorbed amounts of dye at time t and at equilibrium (mg g−1), respectively, and t is the time (min); k1 and k2 are the pseudo-first-order rate constant (min−1) and the pseudo-second-order rate constant (g mg−1 min−1). The kinetic parameters were obtained by fitting the plots of qtvs. t (Fig. 7 and S16†) and are listed in Table S3.† In comparison with the pseudo-first-order kinetics model (Fig. S17†), the pseudo-second-order kinetics model is more suitable for analysing the adsorption kinetics because the values of the correlation coefficients R2 derived from the pseudo second-order model are closer to 1. Thus, this outcome suggests that MG and MB adsorption on Si-POP-1 and Si-POP-2 follows pseudo second-order kinetics. Thermodynamic and kinetic data collectively suggest that the driving force of MB and MG adsorption is chemisorption by ion exchange and electrostatic interactions. In the case of Si-POP-2, the ion exchange involves the cationic dye and the triethyl ammonium cations or hydrogens in the RSO3H groups. Electrostatic interactions intervene between the positively charged sites of the dye and the negatively charged sites on the adsorbent (i.e. octahedral silicate cores and RSO3− groups). Fortunately, π–π stacking interactions between the dye and the adsorbent participate in the process. Physisorption contributes to both diffusion and adsorption, particularly for Si-POP-2, which is endowed with a hollow nanotube morphology.
As shown by the thermodynamic and kinetic analysis, ion exchange phenomena play a very important role in dye adsorption. Metal cations present in the solution interfere with the adsorption process. Sodium and calcium ions were used to study interference effects on the adsorption amount of the dye at saturation. The concentration of each metal ion was set at 100 ppm, which is the concentration of these metal ions in hard water. Comparative assessment (Fig. S18 and S19†) evidenced that sodium and calcium ions play negative roles in the adsorption of MB and MG on Si-POP-1, provoking a distinct decrease of the adsorbed amount at saturation. In contrast, sodium and calcium ions had almost no effect on the adsorbed amounts of MB and MG on Si-POP-2, supposedly because these cations readily exchange with the acidic hydrogens from the sulfonic groups of the adsorbent; thus, the replacement of triethylammonium cations is relegated to a minor role.
Selectivity of adsorption was demonstrated by experiments where the cationic dyes MB and MG were adsorbed on Si-POP-1 and Si-POP-2 (Tables 1–3 and S4†); a mixture of the anionic dye MO and MG was also studied (Fig. 8). From the UV-vis spectra of an aqueous solution containing MO (50 ppm) and MG (50 ppm) adsorbed by Si-POP-1 (left) and Si-POP-2 (right), it is obvious that the intensity of the maximum absorption peak (617 nm) of MG decreased with time, while the intensity of the maximum absorption peak (463 nm) of MO remained practically unchanged; this indicates that MO was not adsorbed, being negatively charged, despite the fact that MO is less bulky than MG. These results clearly indicate selective adsorption on both adsorbents of cationic dyes with different sizes or of MG vs. the anionic dye MO. This outcome provides support to the fact that the adsorption processes were dominated by ion exchange/physisorption and chemisorption, as also confirmed by the thermodynamic and kinetic data. At the same time, it stands as proof that the designed adsorbents exhibit highly selective adsorption for cationic dyes such as MG, MB and BB7.
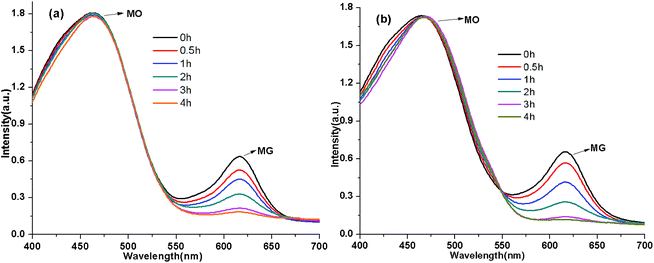 | ||
| Fig. 8 UV-vis spectra of a mixture of MO and MG aqueous solutions adsorbed by Si-POP-1 (a) and Si-POP-2 (b). | ||
Adsorbents Si-POP-1 and Si-POP-2 clearly show different adsorption levels and adsorption rates for our set of cationic dyes. We then sought to determine whether these adsorbents can exhibit adsorbate size and shape selectivity. When Si-POP-1 and Si-POP-2 were used to adsorb a mixture with equal concentrations of MB and MG, differences in the adsorption profiles were evident (Fig. 9). On Si-POP-1, the intensities of both the peak at 617 nm of MG and the peak at 664 nm of MB decreased with time, suggesting that MG and MB were simultaneously adsorbed by Si-POP-1. This was also true for Si-POP-2; however, the peak at 664 nm decreased much more rapidly, indicating the preferential adsorption of MB. In addition, larger dyes, Basic Blue 7 (BB7) and Alcian Blue 8GX (AB8GX) (Fig. S1†), were used to probe the size selectivities of Si-POP-1 and Si-POP-2 (Fig. S20–S22†). The adsorption experiments were carried out at 25 °C. It was found that the adsorption capacities of Si-POP-1 for BB7 and AB8GX were about 44 and 42 mg g−1, while those for Si-POP-2 were 740 and 56 mg g−1, respectively. These very low adsorption levels indicate that adsorption of bulky dyes can occur only on the outside surface of the adsorbents. In summary, Si-POP-1 can easily adsorb relatively small dyes such as MB and MG; however, it adsorbed almost none of the larger BB7 and AB8GX. Contrastingly, Si-POP-2 could adsorb BB7 more readily than AB8GX. The obvious conclusion is that both Si-POP-1 and Si-POP-2 exhibit size selectivity. An important deduction is that surface adsorption is operative, to a greater or lesser extent, within the whole range of dyes employed, whereas for both adsorbents, inner chemisorption prevails for small dyes, especially in the case of Si-POP-2.
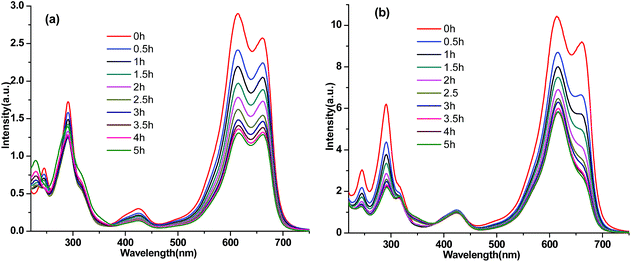 | ||
| Fig. 9 UV-vis spectra of mixed MB and MG aqueous solutions absorbed on (a) Si-POP-1 (160 ppm MB + 160 ppm MG) and (b) Si-POP-2 (400 ppm MB + 400 ppm MG). | ||
Because it is of particular significance for material recycling and dye recovery, the release process of MB fully adsorbed on 20 mg Si-POP-2 was monitored by UV-vis. To this end, the MB-loaded adsorbent was introduced in methanol (150 mL) and UV-vis spectra of the solution were recorded (Fig. 10). It was found that during the first 4 hours, the intensity of the UV-vis absorption band that is characteristic of MB increased slowly and then levelled to a plateau, indicating limited release of the dye. After 240 min, NaCl was added in one portion; this triggered much faster release of MB, as indicated by the abrupt increase in intensity of the UV-vis peaks of the dye. A large amount of MB was therefore liberated from the adsorbent via ion-exchange between the adsorbed dye and NaCl, favoured by the good solubility of the dye in methanol. The release experiments with the MB-loaded Si-POP-2 confirmed that the adsorption process occurs predominantly within the adsorbent and only to a moderate extent on the surface.
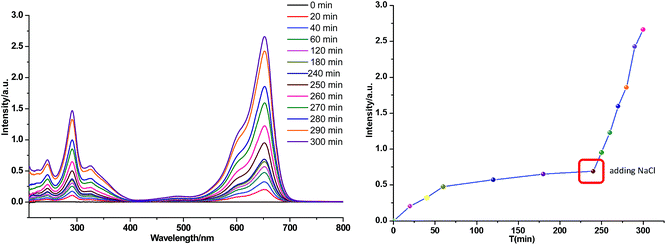 | ||
| Fig. 10 Release of MB adsorbed on Si-POP-2 (30 mg) in methanol (150 mL) before and after NaCl addition. | ||
Currently, in industry, there is an urgent need for systematic water management by minimizing the amount of the water consumed while maximizing water reuse via wastewater treatment. For practical application, if our material with super-high adsorption capacity for cationic dyes could be regenerated and reused, the total operational cost could be significantly decreased and a higher volume of water could be cleaned. In this context, we chose to investigate recycling of Si-POP-2 for MB adsorption. Subsequent to a first adsorption process, Si-POP-2 was regenerated by short immersion in a NaCl-saturated methanolic solution, dried and reused in a subsequent MB adsorption cycle. After four adsorption–desorption cycles, Si-POP-2 retained 96% of its impressive initial adsorption capacity (Fig. 11). This result proves that productive recycling can largely exceed the four cycles depicted in our experiment. The simplicity and sustainability of the regeneration procedure suggests that MB itself can easily be recovered in view of valorisation in the dye industry, thus decreasing the cost of MB fabrication and the related environmental damage. It should be noted that in addition to this respect, our protocol outclasses reported adsorption on inexpensive, naturally existing materials or wastes that permit neither adsorbent recycling or dye recovery.45–48
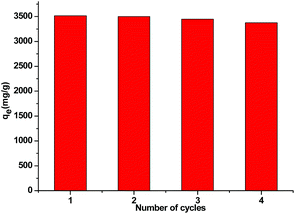 | ||
| Fig. 11 Recyclability of regenerated Si-POP-2 for adsorption of MB (10 mg Si-POP-2; 150 mL of a 550 mg L−1 MB solution; 25 °C, 6 h). | ||
Conclusions
Discovering advanced materials that allow capture and release of wastewater pollutants under mild conditions is currently an active area of research. In this regard, the present study introduces two new anionic, hypervalent silicate-based microporous organic polymers (Si-POP-1 and Si-POP-2) for adsorption of cationic dyes. These materials are readily accessed from the direct, hydrothermal Schiff base-driven polycondensation of a hexacoordinate Si-precursor (containing an octahedral dianionic “SiO6” structural fragment) with a bifunctional aromatic amine. Amine source variation was used to control the properties of the networks, resulting in distinct morphologies (solid microspheres for Si-POP-1 and hollow nanotubes for Si-POP-2), BET specific surface areas and, most importantly, remarkable yet different adsorption propensities for model cationic dye contaminants such as MB, MG, BB7 and AB8GX. In particular, Si-POP-2 showed a record adsorption capacity for removal of MB (above 3500 mg g−1), largely surpassing reported values for most known adsorbents.The outstanding adsorption power of the dyes was assigned to chemisorption by ion exchange, as confirmed by the observed pseudo-second-order kinetics and enthalpy increase. Taken together with the negative values of the Gibbs free energy, it was demonstrated that the adsorptions occurred spontaneously.
These novel anionic adsorbents are versatile, robust, selective for dyes and more efficient than other POPs. They are stable under air and in water for a long time. Recycling experiments of Si-POP-2 proved that it retains its adsorption capability (>96%) for more than four runs. Additionally, in accord with green chemistry principles, this adsorbent is cleanly and readily regenerable; therefore, it may be industrially viable, considering its convenient, scalable synthesis and efficient use over many cycles with positive environmental consequences.
Conflicts of interest
There are no conflicts to declare.Acknowledgements
This work was supported by the National Natural Science Foundation of China (21501122, 21671139 and 21701116), the Doctoral Scientific Research Foundation of Liaoning Province (201601193) and the Distinguished Professor Project of Liaoning province (No. 2013204). I. D. and V. D. acknowledge financial support from the Romanian Academy, Institute of Organic Chemistry C. D. Nenitescu, Bucharest.Notes and references
- (a) S. Yuan, L. Feng, K. Wang, J. Pang, M. Bosch, C. T. Lollar, Y. Sun, J. Qin, X. Yang, P. Zhang, Q. Wang, L. Zou, Y. Zhang, L. Zhang, Y. Fang, J. Li and H.-C. Zhou, Adv. Mater., 2018, 1704303 CrossRef PubMed; (b) H. Liang, X. Jiao, C. Li and D. Chen, J. Mater. Chem. A, 2018, 6, 334–341 RSC; (c) S. Yuan, J.-S. Qin, C. T. Lollar and H.-C. Zhou, ACS Cent. Sci., 2018, 4, 440–450 CrossRef CAS PubMed; (d) L.-X. You, L.-X. Cui, B.-B. Zhao, G. Xiong, F. Ding, B. Ren, Z.-L. Shi, I. Dragutan, V. Dragutan and Y. Sun, Dalton Trans., 2018, 47, 8755–8763 RSC; (e) M. J. Van Vleet, T. Weng, X. Li and J. R. Schmidt, Chem. Rev., 2018, 118, 3681–3721 CrossRef CAS PubMed; (f) H. L. Nguyen, F. Gandara, H. Furukawa, T. L. Doan, K. E. Cordova and O. M. Yaghi, J. Am. Chem. Soc., 2016, 138, 4330–4333 CrossRef CAS.
- (a) G. Zhong, D. Liu and J. Zhang, J. Mater. Chem. A, 2018, 6, 1887–1899 RSC; (b) S. Tanaka, T. Nagaoka, A. Yasuyoshi, Y. Hasegawa and J. F. M. Denayer, Cryst. Growth Des., 2018, 18, 274–279 CrossRef CAS; (c) E. V. Ramos-Fernandez, A. Grau-Atienza, D. Farrusseng and S. Aguado, J. Mater. Chem. A, 2018, 6, 5598–5602 RSC; (d) D. Saliba, M. Ammar, M. Rammal, M. Al-Ghoul and M. Hmadeh, J. Am. Chem. Soc., 2018, 140, 1812–1823 CrossRef CAS PubMed.
- (a) X. Guan, Y. Ma, H. Li, Y. Yusran, M. Xue, Q. Fang, Y. Yan, V. Valtchev and S. Qiu, J. Am. Chem. Soc., 2018, 140, 4494–4498 CrossRef CAS PubMed; (b) G. Zhang, M. Tsujimoto, D. Packwood, N. Tuan Duong, Y. Nishiyama, K. Kadota, S. Kitagawa and S. Horike, J. Am. Chem. Soc., 2018, 140, 2602–2609 CrossRef CAS PubMed; (c) O. Yahiaoui, A. N. Fitch, F. Hoffmann, M. Fröba, A. Thomas and J. Roeser, J. Am. Chem. Soc., 2018, 140, 5330–5333 CrossRef CAS PubMed.
- (a) B. Li, Z. Guan, X. Yang, W. D. Wang, W. Wang, I. Hussain, K. Song, B. Tan and T. Li, J. Mater. Chem. A, 2014, 2, 11930–11939 RSC; (b) Z. Xiang and D. Cao, J. Mater. Chem. A, 2013, 1, 2691–2718 RSC; (c) J. X. Jiang and A. I. Cooper, Top. Curr. Chem., 2010, 293, 1–33 CAS; (d) R. Castaldo, G. Gentile, M. Avella, C. Carfagna and V. Ambrogi, Polymers, 2017, 9, 651 CrossRef.
- J. Liang, Y.-B. Huang and R. Cao, Coord. Chem. Rev., 2019, 378, 32–65 CrossRef CAS.
- (a) H. Zhu, D. Liu, D. Zou and J. Zhang, J. Mater. Chem. A, 2018, 6, 6130–6154 RSC; (b) L. You, W. Zong, G. Xiong, F. Ding, S. Wang, B. Ren, I. Dragutan, V. Dragutan and Y. Sun, Appl. Catal., A, 2016, 511, 1–10 CrossRef CAS; (c) L. X. You, W. Zhu, S. Wang, G. Xiong, F. Ding, B. Ren, I. Dragutan, V. Dragutan and Y. Sun, Polyhedron, 2016, 115, 47–53 CrossRef CAS; (d) Y.-G. Sun, J. Li, J. You, Y. Guo, G. Xiong, B.-Y. Ren, L.-X. You, F. Ding, S.-J. Wang, F. Verpoort, I. Dragutan and V. Dragutan, J. Coord. Chem., 2015, 68, 1199–1212 CrossRef CAS; (e) M. L. Foo, R. Matsuda and S. Kitagawa, Chem. Mater., 2014, 26, 310–322 CrossRef CAS.
- L. Chen, R. Luque and Y. Li, Dalton Trans., 2018, 47, 3663–3668 RSC.
- (a) A. J. Rieth and M. Dincă, J. Am. Chem. Soc., 2018, 140, 3461–3466 CrossRef CAS PubMed; (b) D. Zhao, X. H. Liu, J. H. Guo, H. J. Xu, Y. Zhao, Y. Lu and W. Y. Sun, Inorg. Chem., 2018, 57, 2695–2704 CrossRef CAS PubMed.
- (a) Y. Jiao, J. Pei, D. Chen, C. Yan, Y. Hu, Q. Zhang and G. Chen, J. Mater. Chem. A, 2017, 5, 1094–1102 RSC; (b) C. A. Downes and S. C. Marinescu, ChemSusChem, 2017, 10, 4374–4392 CrossRef CAS PubMed; (c) A. Elsayed, E. Elsayed, R. Al-Dadah, S. Mahmoud, A. Elshaer and W. Kaialy, Appl. Energy, 2017, 186(SI3), 509–519 CrossRef CAS.
- (a) Y.-S. Kang, Y. Lu, K. Chen, Y. Zhao, P. Wang and W.-Y. Sun, Coord. Chem. Rev., 2018 DOI:10.1016/j.ccr.2018.02.009; (b) Metal-Organic Frameworks: Applications in Separation and Catalysis, ed. H. Garcia and S. Navalon, Wiley-VCH Verlag GmbH & Co. KGaA, Weinheim, Germany, 1st edn, 2018 Search PubMed; (c) G. Xiong, X.-L. Chen, L.-X. You, B.-Y. Ren, F. Ding, I. Dragutan, V. Dragutan and Y.-G. Sun, J. Catal., 2018, 361, 116–125 CrossRef CAS; (d) H. Kaur, M. Venkateswarulu, S. Kumar, V. Krishnan and R. R. Koner, Dalton Trans., 2018, 47, 1488–1497 RSC; (e) Y.-B. Huang, J. Liang, X.-S. Wang and R. Cao, Chem. Soc. Rev., 2017, 46, 126 RSC; (f) L.-X. You, H.-J. Liu, L.-X. Cui, F. Ding, G. Xiong, S.-J. Wang, Ba.-Y. Ren, I. Dragutan, V. Dragutan and Y.-G. Sun, Dalton Trans., 2016, 45, 18455–18458 RSC.
- (a) T. Gong, P. Li, Q. Sui, J. Chen, J. Xu and E.-Q. Gao, J. Mater. Chem. A, 2018, 6, 9236–9244 RSC; (b) P. Samanta, A. V. Desai, S. Sharma, P. Chandra and S. K. Ghosh, Inorg. Chem., 2018, 57, 2360–2364 CrossRef CAS PubMed.
- (a) U.-J. Ryu, J. Yoo, W. Kwon and K. M. Choi, Inorg. Chem., 2017, 56, 12859–12865 CrossRef CAS PubMed; (b) L. Wang, W. Wang, X. Zheng, Z. Li and Z. Xie, Chem.–Eur. J., 2017, 23, 1379–1385 CrossRef CAS PubMed; (c) W. Chen and C. Wu, Dalton Trans., 2018, 47, 2114–2133 RSC.
- (a) L. L. Luo, X. L. Qu, Z. Li, X. Li and H. L. Sun, Dalton Trans., 2018, 47, 925–934 RSC; (b) P. Tao, C.-H. Zeng, K. Zheng, C.-Q. Huang and S. L. Zhong, J. Inorg. Organomet. Polym. Mater., 2016, 26, 1087–1094 CrossRef CAS; (c) Y.-N. Sun, G. Xiong, V. Dragutan, I. Dragutan, F. Ding and Y.-G. Sun, Inorg. Chem. Commun., 2015, 62, 103–106 CrossRef CAS; (d) Z. Xiang and D. Cao, J. Mater. Chem. A, 2013, 1, 2691–2718 RSC.
- (a) L. Tan and B. Tan, Chem. Soc. Rev., 2017, 46, 3322–3356 RSC; (b) W. Zhang, B. Aguila and S. Ma, J. Mater. Chem. A, 2017, 5, 8795–8824 RSC; (c) R. Castaldo, G. Gentile, M. Avella, C. Carfagna and V. Ambrogi, Polymers, 2017, 9, 651 CrossRef; (d) C. Lu, S. Liu, J. Xu, Y. Ding and G. Ouyang, Anal. Chim. Acta, 2016, 902, 205–211 CrossRef CAS PubMed; (e) C. Perego and R. Millini, Chem. Soc. Rev., 2013, 42, 3956–3976 RSC.
- M. T. Yagub, T. K. Sen, S. Afroze and H. M. Ang, Adv. Colloid Interface Sci., 2014, 209, 172–184 CrossRef CAS PubMed.
- M. Rafatullah, O. Sulaiman, R. Hashim and A. Ahmad, J. Hazard. Mater., 2010, 177, 70–80 CrossRef CAS PubMed.
- (a) E. M. Dias and C. Petit, J. Mater. Chem. A, 2015, 3, 22484–22506 RSC; (b) A. A. Adeyemo, I. O. Adeoye and O. S. Bello, Toxicol. Environ. Chem., 2012, 94, 1846–1863 CrossRef CAS.
- (a) M. Ge and H. Liu, J. Mater. Chem. A, 2016, 4, 16714–16722 RSC; (b) X. Liu, W. Gong, J. Luo, C. Zou, Y. Yang and S. Yang, Appl. Surf. Sci., 2016, 362, 517–524 CrossRef CAS; (c) L. Liu, X.-N. Zhang, Z.-B. Han, M.-L. Gao, X.-M. Cao and S.-M. Wang, J. Mater. Chem. A, 2015, 3, 14157–14164 RSC; (d) P. Y. Du, H. Li, X. Fu, W. Gu and X.-A. Liu, Dalton Trans., 2015, 44, 13752–13759 RSC; (e) S.-N. Zhao, C. Krishnaraj, H. Jena, D. Poelman and P. Van Der Voort, Dyes Pigm., 2018, 156, 332–337 CrossRef CAS; (f) J. Liu, P. Chen, G. Shao, B. Fan, H. Wang, D. Chen, H. Lu and R. Zhang, J. Inorg. Organomet. Polym. Mater., 2018, 28, 790–799 CrossRef; (g) S. Kaushal, R. Badru, S. Kumar, H. Kaur and P. Singh, J. Inorg. Organomet. Polym. Mater., 2018, 28, 968–977 CrossRef CAS; (h) C. H. Liu, L. J. Zhang, F. Y. Bai, Y. Wang, Y. Z. Hong, C. R. Li and Y. H. Xing, J. Inorg. Organomet. Polym. Mater., 2018, 28, 1839–1849 CrossRef CAS.
- (a) S. Zhang, J. Li, D. Y. Du, J. S. Qin, S. L. Li, W. W. He, Z. M. Su and Y. Q. Lan, J. Mater. Chem. A, 2015, 3, 23426–23434 RSC; (b) J. J. Li, C. C. Wang, H. F. Fu, J. R. Cui, P. Xu, J. Guo and J. R. Li, Dalton Trans., 2017, 46, 10197–10201 RSC; (c) Z. Zhu, Y. L. Bai, L. Zhang, D. Sun, J. Fang and S. Zhu, Chem. Commun., 2014, 50, 14674–14677 RSC.
- (a) K. Gupta and O. P. Khatri, J. Colloid Interface Sci., 2017, 501, 11–21 CrossRef CAS PubMed; (b) Z. Jia, Z. Li, S. Li, Y. Li and R. Zhu, J. Mol. Liq., 2016, 220, 56–62 CrossRef CAS; (c) T. Ma, P. R. Chang, P. Zheng, F. Zhao and X. Ma, Chem. Eng. J., 2014, 240, 595–600 CrossRef CAS.
- (a) X. Zhao, X. Bu, T. Wu, S. T. Zheng, L. Wang and P. Feng, Nat. Commun., 2013, 4, 2344 CrossRef PubMed; (b) Y. C. He, J. Yang, W. Q. Kan, H. M. Zhang, Y. Y. Liu and J. F. Ma, J. Mater. Chem. A, 2015, 3, 1675–1681 RSC; (c) D. M. Chen, J. Y. Tian, Z. W. Wang, C. S. Liu, M. Chen and M. Du, Chem. Commun., 2017, 53, 10668–10671 RSC; (d) H. Hahm, S. Kim, H. Ha, S. Jung, Y. Kim, M. Yoon and M. Kim, CrystEngComm, 2015, 17, 8418–8422 RSC.
- S.-N. Zhao, C. Krishnaraj, H. Sekhar Jena, D. Poelman and P. Van Der Voort, Dyes Pigm., 2018, 156, 332–337 CrossRef CAS.
- (a) Z. Li, H. Li, X. Guan, J. Tang, Y. Yusran, Z. Li, M. Xue, Q. Fang, Y. Yan, V. Valtchev and S. Qiu, J. Am. Chem. Soc., 2017, 139, 17771–17774 CrossRef CAS PubMed; (b) Y. Liu and K. Landskron, J. Mater. Chem. A, 2017, 5, 23523–23529 RSC; (c) Z. Xiang and D. Cao, J. Mater. Chem. A, 2013, 1, 2691–2718 RSC.
- (a) J. Roeser, D. Prill, M. J. Bojdys, P. Fayon, A. Trewin, A. N. Fitch, M. U. Schmidt and A. Thomas, Nat. Chem., 2017, 9, 977–982 CrossRef CAS PubMed; (b) H. Ma, B. Liu, B. Li, L. Zhang, Y. G. Li, H. Q. Tan, H. Y. Zang and G. Zhu, J. Am. Chem. Soc., 2016, 138, 5897–5903 CrossRef CAS PubMed; (c) S. Fischer, J. Schmidt, P. Strauch and A. Thomas, Angew. Chem., Int. Ed., 2013, 52, 12174–12178 CrossRef CAS PubMed; (d) H. Zhu, D. Liu, D. Zou and J. Zhang, J. Mater. Chem. A, 2018, 6, 6130–6154 RSC.
- (a) L. Xiao, D. C. Sun, T. Li Niu and Y.-W. Yao, Phosphorus, Sulfur Silicon Relat. Elem., 2014, 189, 1564–1571 CrossRef CAS; (b) M. Thommes, K. Kaneko, A. V. Neimark, J. P. Olivier, F. Rodriguez-Reinoso, J. Rouquerol and K. S. W. Sing, Pure Appl. Chem., 2015, 87, 1051–1069 CAS.
- (a) Y. Xie, D. Kocaefe, C. Chen and Y. Kocaefe, J. Nanomater., 2016, 2302595, DOI:10.1155/2016/2302595; (b) S. Aghamohammadi and M. Haghighi, Chem. Eng. J., 2015, 264, 359–375 CrossRef CAS.
- A. A. Narvekar, J. B. Fernandes and S. G. Tilve, J. Environ. Chem. Eng., 2018, 6, 1714–1725 CrossRef CAS.
- Q. Li, Y. Li, X. Ma, Q. Du, K. Sui, D. Wang, C. Wang, H. Li and Y. Xia, Chem. Eng. J., 2017, 316, 623–630 CrossRef CAS.
- X. Wei, T. Huang, J. H. Yang, N. Zhang, Y. Wang and Z. W. Zhou, J. Hazard. Mater., 2017, 335, 28–38 CrossRef CAS PubMed.
- S. Thakura, S. Pandeya and O. Arotibaa, Carbohydr. Polym., 2016, 153, 34–46 CrossRef PubMed.
- T. Yao, S. Guo, C. Zeng, C. Wang and L. Zhang, J. Hazard. Mater., 2015, 292, 90–97 CrossRef CAS PubMed.
- H. Mittal, A. Maity and S. S. Ray, Chem. Eng. J., 2015, 279, 166–179 CrossRef CAS.
- M. S. Tehrani and Z. D. Rouholah, RSC Adv., 2016, 6, 27416–27425 RSC.
- N. Kannan and M. M. Sundaram, Dyes Pigm., 2001, 51, 25–40 CrossRef CAS.
- Z. Jia, Z. Li, S. Li, Y. Li and R. Zhu, J. Mol. Liq., 2016, 220, 56–62 CrossRef CAS.
- G. McKay, J. F. Porter and G. R. Prasad, Water, Air, Soil Pollut., 1999, 114, 423–438 CrossRef CAS.
- Y. F. Yang, Z. H. Niu, H. Li, Y. H. Ma, Y. Zhang and H. F. Wang, Dalton Trans., 2018, 47, 6538–6548 RSC.
- K. Y. A. Lin and H. A. Chang, Chemosphere, 2015, 139, 624–631 CrossRef CAS PubMed.
- Y. Zheng, Y. Zhu and A. Wang, Chem. Eng. J., 2014, 257, 66–73 CrossRef CAS.
- D. Wang, L. Liu, X. Jiang, J. Yu and X. Chen, Colloids Surf., A, 2015, 466, 166–173 CrossRef CAS.
- H. Sayğılı and F. Güzel, Chem. Eng. Res. Des., 2015, 100, 27–38 CrossRef.
- Y. Liu, J. Chem. Eng. Data, 2009, 54, 1981–1985 CrossRef CAS.
- (a) K. L. Tan and B. H. Hameed, J. Taiwan Inst. Chem. Eng., 2017, 74, 25–48 CrossRef CAS; (b) A. Asfaram, M. R. Fathi, S. Khodadoust and M. Naraki, Spectrochim. Acta, Part A, 2014, 127, 415–421 CrossRef CAS PubMed; (c) O. D. Uluozlu, A. Sari, M. Tuzen and M. Soylak, Bioresour. Technol., 2008, 99, 2972–2980 CrossRef CAS PubMed.
- (a) N. S. A. Mubarak, A. H. Jawad and W. I. Nawawi, Energy Ecol. Environ., 2017, 2, 85–93 CrossRef; (b) M. E. Argun, D. Güclü and M. Karatas, J. Ind. Eng. Chem., 2014, 20, 1079–1084 CrossRef CAS.
- L. dos Santos Silva, J. de Oliveira Carvalho, R. D. de Sousa Bezerra, M. S. da Silva, F. J. L. Ferreira, J. A. Osajima and E. C. da Silva Filho, Molecules, 2018, 23, 743 CrossRef PubMed.
- M. Mon, R. Bruno, J. Ferrando-Soria, D. Armentano and E. Pardo, J. Mater. Chem. A, 2018, 6, 4912–4947 RSC.
- D. S. Tong, C. W. Wu, M. O. Adebajo, G. C. Jin, W. H. Yu, S. F. Ji and C. H. Zhou, Appl. Clay Sci., 2018, 161, 256–264 CrossRef CAS.
- L. Mouni, L. Belkhiri, J.-C. Bollinger, A. Bouzaza, A. Assadi, A. Tirri, F. Dahmoune, K. Madani and H. Remin, Appl. Clay Sci., 2018, 153, 38–45 CrossRef CAS.
Footnote |
| † Electronic supplementary information (ESI) available. See DOI: 10.1039/c8ta07109h |
| This journal is © The Royal Society of Chemistry 2019 |

