 Open Access Article
Creative Commons Attribution 3.0 Unported Licence
Shape segregation in molecular organisation: a combined X-ray scattering and molecular dynamics study of smectic liquid crystals†
Mark T.
Sims‡
 ,
Laurence C.
Abbott
,
John W.
Goodby
and
John N.
Moore
,
Laurence C.
Abbott
,
John W.
Goodby
and
John N.
Moore
 *
*
Department of Chemistry, University of York, Heslington, York YO10 5DD, UK. E-mail: john.moore@york.ac.uk
First published on 11th September 2019
Abstract
Temperature-dependent X-ray scattering studies have been carried out on 4-undecyloxy-4′-cyanobiphenyl (11OCB) and 4-(12,12-dimethyltridecyloxy)-4′-cyanobiphenyl (t-Bu-11OCB) in the smectic A phase, from which their layer spacings and translational order parameters were obtained. Marked differences between the layer structures of the two compounds were demonstrated, showing that the addition of the t-Bu group results in a higher translational order parameter and wider layer spacing for t-Bu-11OCB than 11OCB. Fully atomistic MD simulations of both compounds run for >1000 ns demonstrated the spontaneous formation of smectic mesophases from isotropic starting geometries, and experimental trends in order parameters and absolute layer spacings were shown to be replicated well. Further analysis showed that both the aromatic head-groups and the alkyl tail-groups exhibit interdigitation in the simulated smectic phases of both compounds, and the difference in the layer structures between 11OCB and t-Bu-11OCB could be attributed mainly to a shape segregation effect arising from the addition of the bulky t-Bu end-group to the alkyl chain.
Introduction
Smectic liquid crystal phases are characterised as those that exhibit both orientational and translational order, i.e. molecules within the phase have a tendency to align along a preferred orientation and also to self-organise into diffuse layers. The potential applications of smectic phases are widespread, and they may be found in a number of different types of display devices,1–3 which can offer differing and in many cases favourable properties compared with more conventional devices based on nematic liquid crystal phases. As with any liquid crystal device, the tuning of the properties of the materials used within these devices is crucial to optimise their performance.Of the subclasses of smectic phases, the simplest is the uniaxial smectic A (SmA) phase, in which the molecules organise into layers with layer-normal vectors coincident with the preferred molecular orientation. The smectic A phase has received significant attention because of the ability to use it in ion-doped systems to produce bistable displays that act in light-scattering mode,4–6 and also in flexible displays.7,8 In the context of display applications, the chiral smectic C (SmC*) phase, in which the molecules are tilted with respect to the layer normals, is perhaps the most studied because it may exhibit ferroelectric behaviour under suitable confinement conditions, enabling rapid switching of the molecular orientations to give extremely fast response times.9 Although compounds exhibiting SmA and SmC* phases may both be found in commercial displays, there are material properties that limit their use. For example, defect-free domains are typically required in optical devices,10 and layer instabilities are problematic for many applications of SmC* materials.11 Additionally in SmA devices, the nature of the layer structure has a large impact on the conductivity anisotropy of ion-doped systems, influencing their threshold switching voltages.12 Hence, a detailed understanding of the relationship between the structures of the constituent molecules and the layer structures within smectic phases is vital to overcoming issues with defect formation and performance in smectic devices.13,14 Furthermore, understanding the response of the layer structure to external forces is crucial for the development of practical flexible displays.15
A significant amount of research has been carried out with the aim of optimising smectic materials for display applications, and in particular the effects of molecular structure on smectic phase stability and layer formation have been studied. One particular area of interest has been the influence of bulky end-groups, and a whole range of different effects have been reported. For example, an early study of chlorosilane-terminated liquid crystals proposed that the bulky polar end-groups favour smectic mesophases when compared with their alkyl-terminated analogues,16 but later studies suggested that smectic phases are destabilised by the addition of epoxy17 and halogen18 end-groups. Phenoxy end-groups have been reported to suppress SmC phases,19 and the positions of fluorine substituents on phenoxy end-groups have been shown to influence the relative stabilities of the SmA and SmC phases.20 In some cases, bulky non-polar end-groups have been proposed to preclude liquid-crystalline phases16 and weaken interlayer interactions21 due to their volume, but other studies have suggested that such groups may increase the temperature range over which the SmA phase is stable,18 or enhance the stability of the SmC phase over the SmA phase.22 It has also been reported that SmC stabilisation by bulky non-polar groups may only occur if the bulky group is not too large.23 This range of effects arising from altering the steric and electrostatic properties of the end-groups illustrates the complexity in terms of phase structure and behaviour arising from relatively subtle changes in molecular structure, and demonstrates a need for improved understanding of structure–property relationships in this field.
Perhaps the most studied and well understood class of smectic liquid crystals is that of the interdigitated SmAd phase formed by cyanobiphenyl molecules, in which there is significant overlap of molecules between the layers. The driving force for the formation of this phase has been attributed primarily to the dichotomy of the molecules, which favours self-association of the polarizable, polar cyanobiphenyl groups and of the non-polar aliphatic chains, resulting in chemically distinct regions in the layers.24 This separation on a molecular scale is termed nanosegregation, and it is the nature of this effect that determines the exact structure of the phases exhibited by these compounds. The favoured antiparallel molecular configuration of neighbouring molecules combined with nanosegregation enables material properties such as the layer spacing of ca. 1.4 times the molecular length in cyanobiphenyl compounds to be rationalised.25
The influence of bulky end-groups on the properties of the smectic phases of cyanobiphenyls has been studied, with much work focusing on bulky siloxane end-groups.26 These groups have been reported to promote layer formation, and this effect has been attributed primarily to the additional chemical incompatibility of the siloxane groups with both the aliphatic and aromatic regions of the molecules.26,27 This reported three-way chemical incompatibility has been widely used to explain phase behaviour and material properties of siloxane-terminated cyanobiphenyls,28–33 such as their small degree of out-of-layer fluctuations.34 One of the primary reasons these compounds have been studied is the favourable threshold switching voltages and response times of mixtures comprising these compounds in devices.35 Molecular theories of these materials based on nanosegregation promoting translational order have also been developed.36
However, this additional chemically driven nanosegregation in liquid crystals with bulky siloxane end-groups has been called into question as a result of similar properties being exhibited by mesogens with bulky alkyl end-groups,18,37 suggesting that steric effects may be dominant. Although steric interactions were thought to be important in early work on siloxanes, these interactions were not considered to be the driving force behind the formation and properties of their smectic phases.26 It appears that some of the discussion of nanosegregation within low molecular weight liquid crystals may originate from segregation in di-block copolymers comprising aromatic and siloxane units;27,38 however, in compounds of low molecular weight these units have been shown to be miscible,39 and low molecular weight polydimethylsiloxane oligomers have also been shown to be soluble in both aromatic and aliphatic solvents.40 These apparently conflicting aspects of interpretation and observed behaviour raise questions over whether the material properties of siloxane-substituted liquid-crystalline systems originate primarily from the chemical or the topological properties of the molecules.
The range of effects reported for bulky end-groups, polar end-groups, and potentially chemically incompatible end-groups demonstrates a high degree of complexity in rationalising the properties of smectic phases, and raises fundamental questions relating to the driving forces of self-organisation. Quantitative conclusions at an atomic level are not readily obtained from experimental studies, but would provide an important route towards understanding the subtleties of self-organisation processes and ultimately to designing smectic materials with specific properties.
Molecular dynamics (MD) simulations provide a potential route towards such atomic-level understanding, and united-atom and fully-atomistic molecular dynamics simulations of thermotropic liquid crystals are becoming increasingly widespread as computational power increases and force-fields are developed and improved. The nematic phase has been the subject of many of these studies due to its relative simplicity, and research has typically focused on replicating and rationalising many experimental observables such as orientational order parameters, transition temperatures, densities, diffusion coefficients, molecular conformations and molecular associations.41–44 Simulations of smectic phases provide a significantly greater challenge than nematic phases, largely as a result of the long-range translational order they exhibit, which preferably requires correspondingly large simulations that result in long computation times. Early united-atom and fully-atomistic simulations of smectic phases were therefore limited to <10 ns simulations of up to ca. 100 molecules,45–48 providing only limited information on the smectic phase structure. The more recent ability to simulate larger systems of up to a few thousand molecules has prompted investigations into a wide range of systems exhibiting smectic phases, such as semi-fluorinated alkanes,49,50 azobenzene-containing moieties,51 and large aromatic species such as sexithiophene52,53 and quinquephenyl.54
A significant focus of MD studies has also been on force field parameterisation and verification, most commonly for the ubiquitous cyanobiphenyl-based liquid crystals, enabling experimental transition temperatures, orientational order parameters, and translational order parameters of the smectic phases to be replicated.43,55–60 Force-fields that have been parameterised for specific families of liquid-crystalline compounds unsurprisingly tend to replicate experimental properties somewhat better than general force fields, but depending on the method of parameterisation this may be at the significant cost of losing transferability to other families of compounds, limiting their use in a predictive context. Conversely, general force fields are typically less capable of predicting absolute experimental values, but nevertheless may successfully predict experimental trends, providing a valuable predictive method for tuning properties. Recently, adjustments to the General Amber Force Field (GAFF) have been shown to give a significant improvement in the prediction of transition temperatures, potentially providing a general atomistic force field suitable for the simulation of liquid crystal phases.61
In this work, our aim was to investigate the role of steric effects in the self-organisation of smectic liquid crystals through a combination of experimental X-ray scattering studies and fully atomistic MD simulations. As described above, much of the work on cyanobiphenyl compounds with bulky end-groups has focused on siloxane-containing moieties, but a comparison between alkyl- and siloxane-terminated molecules would not readily provide a distinction between chemically driven and sterically driven effects. Furthermore, molecules containing silicon may currently present a challenge for MD simulations because relatively little parameterisation has been carried out to date for silicon-containing species. In this work, we therefore chose to study two alkyl-terminated cyanobiphenyl compounds; one straight-chain compound (11OCB) and one with a bulky tertiary-butyl end-group (t-Bu-11OCB), as shown in Fig. 1, which are both known to exhibit only SmA mesophases with similar clearing points, but with significantly different layer spacings.18 A study of these two compounds essentially enables an assessment of the effect of adding a bulky end-group, and its role in determining the structure of the smectic phase.
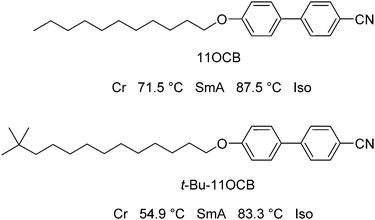 | ||
| Fig. 1 Structures, names and phase-sequences of the compounds studied in this work.18 | ||
We initially present results of temperature-dependent X-ray scattering experiments on the materials, enabling a quantitative characterisation of the SmA phases in terms of their layer spacings and translational order parameters. We then present and analyse fully-atomistic molecular dynamics simulations of the two systems, which provide direct comparisons with the experimental data that enable the observed differences in material properties of these two compounds to be rationalised.
Methods
The syntheses of 11OCB and t-Bu-11OCB have been reported previously.182D X-ray scattering experiments were performed using a Bruker D8 Discover X-ray diffractometer (λ = 1.5406 Å) with a 2048 × 2048 pixel Bruker VANTEC 500 area detector and a custom-built graphite furnace for temperature control (±0.1 K). Samples were held in borosilicate glass capillaries (0.9 mm outer-diameter) and all scattering patterns were obtained using 180 s scans on cooling of the unaligned samples, with some data recorded in the supercooled regions below the melting points of the compounds. Integrated scattering intensities were fitted using R,62 and distances determined from X-ray scattering were defined as λ/2![[thin space (1/6-em)]](https://www.rsc.org/images/entities/char_2009.gif) sin
sin![[thin space (1/6-em)]](https://www.rsc.org/images/entities/char_2009.gif) θ.
θ.
Fully atomistic molecular dynamics simulations were performed using GROMACS 5.1.2,63–69 employing the General Amber Force Field70 with modifications reported for liquid crystal molecules.61 Initial topologies were produced using AmberTools 1471,72 and converted into formats compatible with GROMACS using Acpype.73 Atomic charges were determined using the RESP method74 for structures optimised at the B3LYP/6-31G(d) level75,76 using the Gaussian 09 software package.77
Simulations were run using 2 fs steps, with periodic boundary conditions, and with all bonds constrained at their equilibrium lengths using the LINCS algorithm.78 Trajectory frames were recorded every 50 ps. The temperature of each system was controlled using a Nosé–Hoover thermostat79,80 and a pressure of 1 bar was maintained using anisotropic Parrinello–Rahman pressure coupling,81,82 enabling the relative dimensions of the simulation box to vary during each simulation. A van der Waals cut-off of 1.2 nm was employed, and long-range electrostatic interactions were calculated by using the Particle Mesh Ewald method,83 also with a cut-off of 1.2 nm.
Initial gas-phase density lattices of 1008 molecules were constructed with random head–tail molecular orientations before being compressed over ca. 70 ps to a liquid-phase density, resulting in the essentially isotropic starting geometries for the simulations reported here. This method ensured that little of the original order was maintained, providing confidence in the thermodynamic stability of the ordered phases that formed in the simulations reported here.
Second-rank orientational order parameters, P2, were calculated for each trajectory frame as −2 × the middle eigenvalue of the ordering tensor, Qαβ,61 defined by eqn (1),42,84 where N is the number of molecules, j is the molecule number in the simulation, α and β represent the Cartesian x, y and z axes, δ is the Kronecker delta, and a is the component of the principal molecular axis vector defined in the text. The director at each frame was defined as the eigenvector associated with the largest eigenvalue of the ordering tensor.
 | (1) |
The MD trajectories were visualised using VMD v1.9.387 and Paraview v4.4.0.88
Experimental results
Layer spacings
Plots of X-ray scattering intensity against distance are shown across a range of temperatures for both compounds in Fig. 2, along with the layer spacings, d, corresponding to the associated intensity maxima. These results demonstrate that 11OCB has a significantly smaller layer spacing, of ca. 3.7 nm, than that of t-Bu-11OCB, for which the layer-spacing is ca. 4.3–4.4 nm. Both compounds exhibit some contraction of the layer spacing with increasing temperature, and this effect is more pronounced for t-Bu-11OCB than for 11OCB. These observations are consistent with previous reported values and trends,18 which were attributed to the way in which the bulky end-groups are incorporated into the aliphatic region of the smectic layers.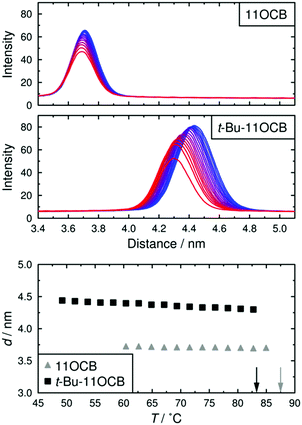 | ||
| Fig. 2 Plots of scattered X-ray intensity against distance for 11OCB and t-Bu-11OCB with decreasing temperature from red to blue (top). The layer spacings corresponding to the intensity maxima are shown plotted against temperature for both compounds (bottom); vertical arrows show the clearing points of the compounds.18 | ||
Order parameters
The translational order parameter, τ, provides a means of quantifying translational order in a system,89 and may take values between 0 for a system with no translational order, and 1 for a system that exhibits perfect layers. The expression given for the translational order parameter in eqn (2) was derived by Leadbetter,90 relating it to the integrated intensity I(T) of the X-ray peak at temperature T and the theoretical integrated intensity, I0, that would be obtained from a perfectly layered configuration. | (2) |
One reported analysis method assumes a power-law dependence of the translational order parameter on the reduced temperature of the system, as given by eqn (3), where β is the order parameter exponent and Tc is the superheating limit of the SmA phase in kelvin, and the temperature-dependence of I is given by eqn (4).91 Fitting the experimental integrated intensities versus temperature to eqn (4) enables β, Tc and I0 to be determined, hence enabling τ to be determined from eqn (2).
 | (3) |
 | (4) |
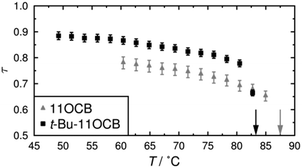
The translational order parameters obtained here by this method are plotted against temperature in Fig. 3, and further details, including plots showing the fits and the fitted values, are given in the ESI.† The translational order parameter values of up to 0.78 obtained here for 11OCB are comparable to reported values derived from experimental data for 8OCB, whereas the values of up to 0.89 obtained here for t-Bu-11OCB are significantly higher than those reported for many compounds.91,92
Bulk alignment of the samples was not readily achieved in the X-ray capillaries, preventing the determination of experimental orientational order parameters of the compounds in this work.
Computational results
Fully atomistic molecular dynamics simulations of 1008 molecules of 11OCB and t-Bu-11OCB, respectively, were run at 353 K (79.85 °C), corresponding to a temperature at which both compounds exhibit the SmA phase experimentally. Each simulation was run for >1000 ns after the phase developed.Orientational order parameters
The presence and determination of orientational order is crucial to confirm the successful simulation of a mesophase. Orientational order in liquid-crystalline systems is typically quantified by the second-rank orientational order parameter, P2, which is defined in eqn (5) in terms of the angle θ between the principal molecular axis of each molecule and the director, which is the average orientation of the principal molecular axes of all the molecules, and where the angular brackets denote an ensemble average. P2 takes values of 0 for an isotropic system, and 1 for a system of perfectly ordered molecules.89 | (5) |
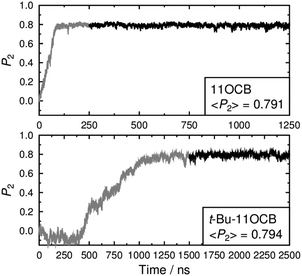
For meaningful results and comparisons, the choice of the principal molecular axis is an important consideration.93 Our recent simulations have indicated that the surface tensor axis may provide a good approximation of the most aligned molecular axis for cyanobiphenyl and other molecules, but this approach is computationally expensive and was considered prohibitive for the relatively large, long simulations presented here. A more usual and computationally less expensive approach in MD studies is to define the principal molecular axis as either that of the minimum moment of inertia (MOI), or as a vector between two atoms along the rigid core of each molecule.42,44,94 In the studies reported here, the presence of the heavy tertiary-butyl end-group of t-Bu-11OCB means that the minimum MOI axis of this compound will be more influenced by the chain conformation than that of 11OCB. Hence, for the purpose of making a clear comparison using an axis that is consistent between these two molecules, we chose the vector between the N and O atoms as the principal molecular axis. The second-rank orientational order parameters of these axes during the simulations are presented in Fig. 4, which shows that the order for 11OCB develops over ca. 100 ns from the start of the simulation, whereas the order develops over a much longer time of ca. 1000 ns for t-Bu-11OCB and its onset does not occur until ca. 300 ns after the start of the simulation. Firm conclusions on the reasons for this difference cannot be drawn from these plots alone, but they do suggest that there are significant differences in the self-assembly of the phases arising from the presence of the additional t-Bu group in t-Bu-11OCB. The orientational order is maintained at a consistent value after it develops in each simulation, confirming the presence of an ordered phase in each case. The average P2 values of ca. 0.8 for both compounds are consistent with reported values for 11OCB determined from birefringence measurements.95
Translational order parameters
The translational order parameter, τ, was determined for each trajectory frame using the expression given in eqn (6),43 where L is the length of the box used in the analysis. In this expression, z is the position of an identical point within each molecule that is chosen to represent the molecular position, projected onto the layer normal, which is the average orientation of the local layer normals centred on all of the molecules, d is the overall layer spacing, which is optimised to give the highest value of τ for each trajectory frame, and the angular brackets denote an ensemble average for that frame. | (6) |
For trajectory frames which have a non-uniform cross-sectional area of the simulation box along the director, some correction for this variation must be made prior to calculating τ. In reported work,43 the simulation box was replicated to give a larger cubic cell, within which a cylinder was defined with its long axis parallel to the director, giving a sampling region with uniform cross-section within which the analysis could be carried out. In the work we report here, each contribution to the average terms in eqn (6) was simply divided by the normalised cross sectional area of the simulation box perpendicular to the layer normal at position z, omitting terms for which the cross-sectional area was <10% of the maximum cross-sectional area for the trajectory frame, for which the influence of the correction becomes very large.
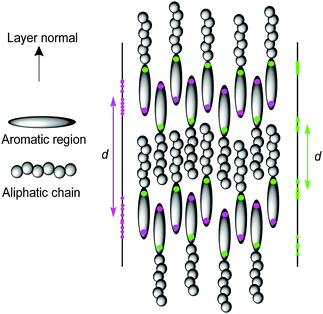
Previous studies calculating smectic order parameters from MD simulations have typically used the molecular centre of mass to define the molecular position.43,56,57 For a perfectly layered configuration of identically aligned molecules, the translational order parameter and layer spacing should be invariant with respect to how the molecular position is defined, providing it is consistent between molecules. However, in some systems, particularly those that exhibit the interdigitated SmAd phase, such as cyanobiphenyls,96 the definition of the molecular position may have a significant influence on the calculated translational order parameter and calculated layer spacing. This difference is shown schematically in Fig. 5, where the projections (z) of two different definitions of the molecular position are shown for the same molecular configuration, leading to very different projections of the molecular positions along the layer normal. This difference is particularly relevant for a comparison of 11OCB with t-Bu-11OCB, where the bulky end-group in t-Bu-11OCB results in a centre of mass in a different position relative to the aromatic core in comparison with that of 11OCB. In this work, the C4′ biphenyl carbon atom, to which the CN group is attached, was found to be the atom in the aromatic region of the molecule with the highest translational order parameter in both systems and it was used to define the molecular positions to calculate the layer normals and values of τ.
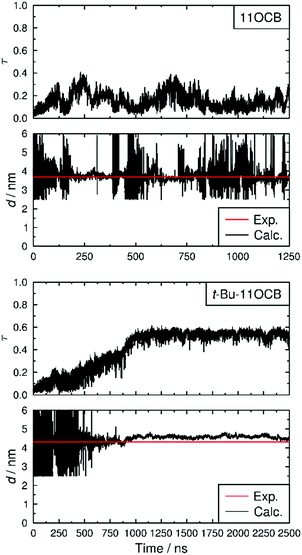
The translational order parameters of the C4′ biphenyl atoms along with the associated layer spacings calculated for each trajectory frame are shown in Fig. 6, showing that the translational order in both simulations increases from initial τ values of <0.1 to values of 0.15 and 0.54 for 11OCB and t-Bu-11OCB, respectively, determined as averages over the last 1000 ns of each simulation, respectively. Both simulated systems were characterised as SmA phases by analysing the calculated angle between the director and the layer normal for each frame of each simulation, as discussed in the ESI.†
The τ value obtained for 11OCB is very close to that of ca. 0.14 reported for united-atom simulations of 8CB,43 but both are much lower than the respective values derived from experimental data. The significant discrepancy reported between calculated and experimentally derived translational order parameters has been discussed in some detail previously, and has been ascribed to the approximations necessarily applied in deriving the values from experimental data,43 such as the extrapolation to a hypothetical structure at absolute zero represented by eqn (4).91
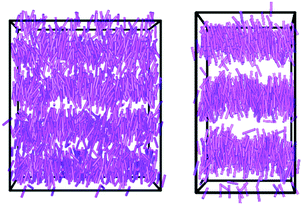
It can be seen from Fig. 6 that, after the phase has developed, the translational order parameter of t-Bu-11OCB is more consistent over the course of the simulation than that of 11OCB. This consistency is likely to be attributable, at least in part, to the higher translational order parameter of t-Bu-11OCB, which demonstrates a better defined layer structure that may be less susceptible to fluctuations. This consistency is reflected more strongly in the associated layer spacings of the phases, also shown in Fig. 6, and the contrast in layer structures between the simulations is evident from the snapshots of the equilibrated configurations shown in Fig. 7. The average values of the calculated layer spacings of 3.76 nm and 4.58 nm for 11OCB and t-Bu-11OCB, respectively, provide a very close match with the experimental values, with differences of 0.07 nm and 0.27 nm from the measured values of 3.69 nm and 4.31 nm. This match between the calculated and experimental layer spacings further supports the conclusions discussed above, that differences between calculated and experimental translational order parameters may arise from the respective methods used to obtain them.
The close match between the experimental and calculated layer spacings, as well as the match between the trends in the experimental and calculated translational order parameters of these compounds, demonstrates the success of the simulations in replicating the general nature of the physical properties of these smectic A phases. The MD trajectories therefore provide a dataset with which the driving forces giving rise to the marked differences in material properties exhibited by these compounds may be assessed.
Molecular interdigitation
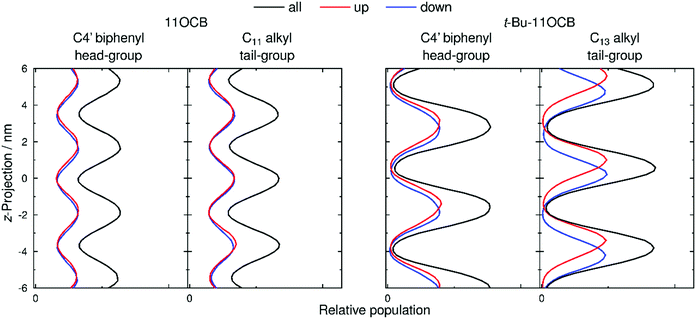
Populations of atoms within the 11OCB and t-Bu-11OCB molecules along the layer normals were determined for 50 ns windows of each simulation. This analysis window was chosen because the population maxima (i.e. layer positions) in both simulations were found to vary by <0.2 nm along the respective layer normals, which is small compared with the layer spacings of ca. 4 nm, and thus represents a timescale without significant effects arising from translation of the layers within the simulation box while also providing sufficient data for meaningful analysis. The relative populations of the C4′ biphenyl (head-group) atoms used for the translational order parameter determination, and of the terminal C11 or C13 alkyl (tail-group) atoms of the aliphatic chains, are plotted as black lines in Fig. 8. For both 11OCB and t-Bu-11OCB, the populations of these head-group and tail-group atoms are shown to be out of phase, demonstrating the presence of distinct aromatic and aliphatic regions along the layer normals. In comparison with 11OCB, the populations for t-Bu-11OCB show sharper peaks with larger amplitudes and greater peak-to-peak separations, along with minima that approach zero between the peaks, all of which is consistent with its higher calculated translational order parameter and wider layer spacing discussed in the previous section. Hence, these plots clearly demonstrate the greater degree of nanosegregation for t-Bu-11OCB than 11OCB.Fig. 8 also shows separate plots for molecules pointing “up” (i.e. the vector between the C and N atoms of the CN group has a positive projection on to the layer normal, given by the z-axis), and for molecules pointing “down”. These plots enable an assessment of the degrees of interdigitation of the molecules from the relative overlaps of the population peaks arising from the up and down molecules.
For the head-group atoms of both 11OCB and t-Bu-11OCB there is little difference in the positions of the up and down molecules along the layer normals, demonstrating that there is a significant degree of interdigitation of the aromatic head-groups in both of the simulations. This similarity between the simulations suggests that the nature of the aromatic regions within the layer structures formed by the two compounds is comparable, and therefore that it is unlikely to contribute significantly to the differences in the observed properties of the compounds.
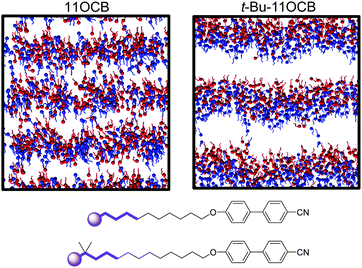
In the case of the tail-group atoms of 11OCB, the relative offsets of the projections of up and down molecules show that there is again little difference between the populations of the up and down molecules, which are comparable to those of the aromatic head-group atoms. By contrast, the tail-group atoms of t-Bu-11OCB show populations of the up and down molecules that are clearly offset along the z-axis, indicating that the degree of interdigitation is far lower. This difference suggests that the inter-layer boundary between oppositely oriented molecules is much better defined for t-Bu-11OCB than for 11OCB in the aliphatic regions, and a different degree of interdigitation in these regions is also clear from views of the final frame of each simulation given in Fig. 9, in which only the ends of the alkyl chains of the molecules are shown.
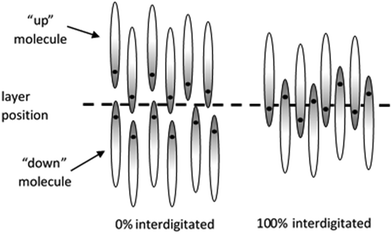
For a given definition of the molecular (reference) position, the layer positions may be defined by the population maxima of these molecular positions along the layer normal, as shown by the maxima of the black curves in Fig. 8, and the number of molecules within each layer is given by the total population between the two respective minima along the layer normal. Interdigitation may be defined as occurring when a molecule that is pointing “up” has its reference position below this defined layer position, or when a molecule that is pointing “down” has its reference position above the defined layer position. The degree of interdigitation may then be quantified as the percentage of molecules that show such interdigitation across all the molecules (and layers) in the simulation box. Using this definition, systems that exhibit no overlap of molecular positions corresponding to “up” and “down” molecules within each layer would yield a value of 0%, whereas systems in which all the molecules have their reference positions located beyond those of opposite orientation within each layer would yield a value of 100%, as shown schematically in Fig. 10.
The simulations here give the degree of interdigitation for the head-group atoms as 49% for 11OCB and 50% for t-Bu-11OCB, demonstrating significant interdigitation that is very similar between the two materials. For the tail-group atoms, the degree of interdigitation is 47% for 11OCB, similar to that for the head groups of both molecules, whereas it is only 28% for t-Bu-11OCB, demonstrating a significantly lower degree of interdigitation at this this end of the molecule.
The carbon atoms comprising the alkyl chains in the two simulations all have the same Lennard-Jones parameters and the sum of the charges of the atoms comprising the end-groups (–CH2–CH2–CH3 and –CH2–CH2–tBu) are within 0.009 between the two molecules. Therefore the tendency of the t-Bu groups to separate into discrete layers cannot be attributed to chemical inequivalence, and the significant difference in the nature of the self-organisation of these compounds must therefore be driven by the difference in molecular shape.
The influence of the shape of the bulky end-group in lowering the degree of interdigitation and stabilising the layer structure observed here also provides a consistent picture with the experimental properties reported for cyanobiphenyls with bulky siloxane end-groups, as discussed in the introduction. The marked difference observed and rationalised here, which is attributable to a relatively modest difference in molecular shape, potentially resolves the apparent contradiction between the miscibility of siloxanes with hydrocarbons and their nanosegregation in liquid-crystalline phases.
The separation of the terminal alkyl groups into better defined layers in t-Bu-11OCB than 11OCB may also provide a rationale for the greater temperature dependence of the layer spacing in t-Bu-11OCB than 11OCB, shown in Fig. 2. In both compounds, the alkyl chains may be expected to favour elongated trans conformations as the temperature is reduced, increasing the average molecular lengths. In the case of 11OCB, the small increase in layer spacing on lowering the temperature may arise from any elongation being largely offset by further interdigitation of the chains. For t-Bu-11OCB, the larger increase in layer spacing on lowering the temperature may arise from a lower capacity for interdigitation of the bulky t-Bu groups to offset any elongation of the chains.
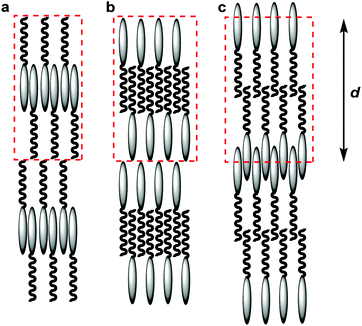
The values quantifying the degrees of interdigitation presented above may also be of significance in the context of the traditional classification of smectic phases, in which the SmAd phase is typically considered to comprise layers of paired interdigitated molecules.24 In considering such phases there is a tendency to consider a “unit cell” as comprising only complete molecules, resulting by necessity in there only being one end of the molecule interdigitated, as shown schematically by assemblies (a) and (b) in Fig. 11. Indeed, many studies of cyanobiphenyl compounds have used such models to explain the observed molecular spacing, where either the cyanobiphenyl units or the alkyl chains have been shown to be interdigitated between layers.25,97–100 The results presented in this work suggest that significant interdigitation may potentially occur between both ends of the molecules, as proposed Leadbetter et al in an early model,101 and as shown schematically by assembly (c) in Fig. 11, and it is the specific structures of these molecular assemblies that underpin the structure of the phase.
In this work, we have shown how the layer structure may be controlled by the size and shape of the alkyl end-group. In general, it would seem that interdigitation may be controlled by interactions between the polar aromatic groups in neighbouring layers and also by interactions between aliphatic chains in neighbouring layers, enabling the properties of layer structures to be tuned through chemically dominated or shape dominated interactions that can be modified at either end of the molecules.
Conclusions
X-ray scattering studies of 11OCB and t-Bu-11OCB samples have shown the large difference in smectic layer spacing of the two compounds to be accompanied by a significant difference in their translational order parameters. MD simulations of 11OCB and t-Bu-11OCB were shown to replicate absolute experimental layer spacings closely, as well as replicating the trend in translational order parameters between these two compounds. A detailed analysis of interdigitation of the molecules showed that the aromatic regions of the smectic layers were very similar for both compounds, whereas the alkyl regions of the layers differed significantly. The alkyl chains of 11OCB were shown to exhibit a higher degree of interdigitation than those of t-Bu-11OCB, which had a tendency to separate into more discrete layers, and this effect is attributed here to the bulky shape of the tertiary-butyl group. The underlying driving force for these differences may be considered to be the layer structure accommodating the molecules in a way that maximises the packing efficiency of the system, thus minimising the free volume;37 whether this effect is primarily enthalpic, driven by favourable interactions between the molecules, or primarily entropic, driven by the maximisation of the number of accessible states of the system, is the subject of future work.The effect of bulky end-groups reducing the degree of chain interdigitation may be important to a wide range of materials, given the variety of compounds that have been reported to show behaviour that is similar to those studied here.18 The results of these simulations also provide strong support for many of the conclusions drawn from experimental work on both these compounds and other smectic materials,18 showing that the organisation of molecules in the interfaces between the non-polar end-groups is crucial to the nature of the phases formed. The steric effect demonstrated in this work may be expected to be present for any smectic or similar self-organising material comprising molecules with bulky end-groups, and therefore the favourable material properties reported for compounds such as cyanobiphenyls with bulky siloxane end-groups may potentially be exhibited by a wider range of molecules. This potential may provide the opportunity for the rational shape-based design of mesogens with more diverse structural units than those conventionally associated with nanosegregation driven by chemical effects, whilst still retaining favourable material properties.
More generally, the MD studies reported here provide an understanding of the quantitative structure–property relationship at an atomic and molecular level that may open a pathway to the nanoscale engineering of compounds with improved material properties. Such computational studies may be expected to provide an increasingly accessible way of assessing the influence of molecular features on the bulk properties of functional materials.
Conflicts of interest
There are no conflicts to declare.Acknowledgements
This work was supported by The Engineering and Physical Sciences Research Council (EPSRC) under grant EP/M020584/1 for the development of dyes for liquid crystal applications and the Core Capability grant EP/K039660/1. We thank Dr Richard Mandle for supplying the materials used in this work and Dr Stephen Cowling for experimental assistance. Data from this article are available by request from the University of York Research Database: DOI: 10.15124/42e530cf-ca08-40ce-b182-cdeefe317801.References
- W. A. Crossland, A. B. Davey, D. P. Chu and T. V. Clapp, Handbook of Liquid Crystals, Wiley-VCH Verlag GmbH & Co. KGaA, 2014, ch. 6, vol. 8, part I, pp. 1–38 Search PubMed.
- S. T. Lagerwall, Handbook of Liquid Crystals, Wiley-VCH Verlag GmbH & Co. KGaA, 2014, ch. 7, vol. 8, part I, pp. 1–24 Search PubMed.
- Y. Yamada and A. Fukuda, Handbook of Liquid Crystals, Wiley-VCH Verlag GmbH & Co. KGaA, 2014, ch. 9, vol. 8, part I, pp. 1–40 Search PubMed.
- D. Coates, W. A. Crossland, J. H. Morrisy and B. Needham, J. Phys. D: Appl. Phys., 1978, 11, 2025–2034 CrossRef CAS.
- D. J. Gardiner and H. J. Coles, J. Phys. D: Appl. Phys., 2006, 39, 4948–4955 CrossRef CAS.
- D. J. Gardiner, C. J. Davenport, J. Newton and H. J. Coles, J. Appl. Phys., 2006, 99, 113517 CrossRef.
- Y. Lu, J. Guo, H. Wang and J. Wei, Adv. Condens. Matter Phys., 2012, 843264 Search PubMed.
- H. Y. Chen and J. S. Wu, J. Soc. Inf. Disp., 2010, 18, 415–420 CrossRef CAS.
- N. A. Clark and S. T. Lagerwall, Appl. Phys. Lett., 1980, 36, 899–901 CrossRef CAS.
- N. M. Abukhdeir and A. D. Rey, Soft Matter, 2010, 6, 1117–1120 RSC.
- I. Dierking, M. Mitov and M. A. Osipov, Soft Matter, 2015, 11, 819–837 RSC.
- D. J. Gardiner and H. J. Coles, J. Appl. Phys., 2006, 100, 124903 CrossRef.
- J. P. F. Lagerwall and F. Giesselmann, ChemPhysChem, 2006, 7, 20–45 CrossRef CAS.
- C. Müller, C. P. J. Schubert, R. P. Lemieux and F. Giesselmann, ChemPhysChem, 2018, 19, 2703–2708 CrossRef.
- F. Hideo, S. Hiroto, I. Fumito, M. Takeshi, K. Hiroshi, K. Taiichiro and S. Fumio, Jpn. J. Appl. Phys., 2004, 43, 8161–8167 CrossRef.
- G. Subramaniam, Mol. Cryst. Liq. Cryst. Sci. Technol., Sect. A, 1997, 308, 121–132 CrossRef CAS.
- E. Białecka-Florjańczyk, I. Śledzińska, I. Stolarzewicz, A. Makal and E. Górecka, Liq. Cryst., 2009, 36, 67–73 CrossRef.
- R. J. Mandle, E. J. Davis, C.-C. A. Voll, D. J. Lewis, S. J. Cowling and J. W. Goodby, J. Mater. Chem. C, 2015, 3, 2380–2388 RSC.
- M. Thompson, C. Carkner, A. Bailey, N. J. Mosey, N. Kapernaum and R. P. Lemieux, Liq. Cryst., 2014, 41, 1246–1260 CrossRef CAS.
- M. Thompson, C. Carkner, N. J. Mosey, N. Kapernaum and R. P. Lemieux, Soft Matter, 2015, 11, 3860–3868 RSC.
- S. J. Cowling, A. W. Hall and J. W. Goodby, Liq. Cryst., 2005, 32, 1483–1498 CrossRef CAS.
- I. A. Radini and M. Hird, Liq. Cryst., 2009, 36, 1417–1430 CrossRef CAS.
- R. J. Mandle, E. J. Davis, J. P. Sarju, N. Stock, M. S. Cooke, S. A. Lobato, S. J. Cowling and J. W. Goodby, J. Mater. Chem. C, 2015, 3, 4333–4344 RSC.
- J. W. Goodby, E. J. Davis, R. J. Mandle and S. J. Cowling, Handbook of Liquid Crystals, Wiley-VCH Verlag GmbH & Co. KGaA, 2014, ch. 8, vol. 1, part II, pp. 1–30 Search PubMed.
- A. J. Leadbetter, J. C. Frost, J. P. Gaughan, G. W. Gray and A. Mosley, J. Phys., 1979, 40, 375–380 CrossRef CAS.
- M. Ibn-Elhaj, H. J. Coles, D. Guillon and A. Skoulios, J. Phys. II, 1993, 3, 1807–1817 CrossRef CAS.
- C. Tschierske, J. Mater. Chem., 1998, 8, 1485–1508 RSC.
- E. Corsellis, D. Guillon, P. Kloess and H. Coles, Liq. Cryst., 1997, 23, 235–239 CrossRef CAS.
- T. Murias, A. C. Ribeiro, D. Guillon, D. Shoosmith and H. J. Coles, Liq. Cryst., 2002, 29, 627–633 CrossRef CAS.
- W. K. Robinson, C. Carboni, P. Kloess, S. P. Perkins and H. J. Coles, Liq. Cryst., 1998, 25, 301–307 CrossRef CAS.
- J. Z. Vlahakis, K. E. Maly and R. P. Lemieux, J. Mater. Chem., 2001, 11, 2459–2464 RSC.
- M. Ibn-Elhaj, A. Skoulios, D. Guillon, J. Newton, P. Hodge and H. J. Coles, J. Phys. II, 1996, 6, 271–279 CrossRef CAS.
- H. Yoon, D. M. Agra-Kooijman, K. Ayub, R. P. Lemieux and S. Kumar, Phys. Rev. Lett., 2011, 106, 087801 CrossRef.
- L. Li, C. D. Jones, J. Magolan and R. P. Lemieux, J. Mater. Chem., 2007, 17, 2313–2318 RSC.
- D. J. Gardiner and H. J. Coles, Proc. Soc. Photo-Opt. Instrum. Eng., 2005, 5741, 239–247 CrossRef CAS.
- M. V. Gorkunov, M. A. Osipov, N. Kapernaum, D. Nonnenmacher and F. Giesselmann, Phys. Rev. E: Stat., Nonlinear, Soft Matter Phys., 2011, 84, 051704 CrossRef CAS.
- J. W. Goodby, R. J. Mandle, E. J. Davis, T. Zhong and S. J. Cowling, Liq. Cryst., 2015, 42, 593–622 CrossRef CAS.
- B. Wang and S. Krause, Macromolecules, 1987, 20, 2201–2208 CrossRef CAS.
- H. Tenhu and K. Vaahtera, Eur. Polym. J., 1991, 27, 717–722 CrossRef CAS.
- J. N. Lee, C. Park and G. M. Whitesides, Anal. Chem., 2003, 75, 6544–6554 CrossRef CAS.
- M. R. Wilson, Chem. Soc. Rev., 2007, 36, 1881–1888 RSC.
- J. Pelaez and M. Wilson, Phys. Chem. Chem. Phys., 2007, 9, 2968–2975 RSC.
- M. F. Palermo, A. Pizzirusso, L. Muccioli and C. Zannoni, J. Chem. Phys., 2013, 138, 204901 CrossRef.
- G. Tiberio, L. Muccioli, R. Berardi and C. Zannoni, ChemPhysChem, 2009, 10, 125–136 CrossRef CAS.
- H. Toriumi, M. Yoshida, N. Kamiya and M. Takeuchi, Mol. Cryst. Liq. Cryst., 2003, 402, 31–42 CrossRef.
- Y. Lansac, M. A. Glaser and N. A. Clark, Phys. Rev. E: Stat., Nonlinear, Soft Matter Phys., 2001, 64, 051703 CrossRef CAS.
- P. Styring, Mol. Cryst. Liq. Cryst. Sci. Technol., Sect. A, 1999, 332, 199–206 CrossRef.
- K.-J. Lee, G.-H. Hsiue, J.-L. Wu and J.-H. Chen, Liq. Cryst., 1999, 26, 469–482 CrossRef CAS.
- M. Fujiwara, K. Satoh and S. Mita, Mol. Cryst. Liq. Cryst., 2005, 441, 307–317 CrossRef CAS.
- F. D. Tsourtou, O. Alexiadis, V. G. Mavrantzas, V. Kolonias and E. Housos, Chem. Eng. Sci., 2015, 121, 32–50 CrossRef CAS.
- M. Böckmann, C. Peter, L. D. Site, N. L. Doltsinis, K. Kremer and D. Marx, J. Chem. Theory Comput., 2007, 3, 1789–1802 CrossRef.
- A. Pizzirusso, M. Savini, L. Muccioli and C. Zannoni, J. Mater. Chem., 2011, 21, 125–133 RSC.
- G. D'Avino, L. Muccioli and C. Zannoni, Adv. Funct. Mater., 2015, 25, 1985–1995 CrossRef.
- Y. Olivier, L. Muccioli and C. Zannoni, ChemPhysChem, 2014, 15, 1345–1355 CrossRef CAS.
- I. Cacelli, L. De Gaetani, G. Prampolini and A. Tani, J. Phys. Chem. B, 2007, 111, 2130–2137 CrossRef CAS.
- L. De Gaetani and G. Prampolini, Soft Matter, 2009, 5, 3517–3526 RSC.
- J. G. Zhang, J. Y. Su and H. X. Guo, J. Phys. Chem. B, 2011, 115, 2214–2227 CrossRef CAS.
- M. F. Palermo, L. Muccioli and C. Zannoni, Phys. Chem. Chem. Phys., 2015, 17, 26149–26159 RSC.
- A. Pizzirusso, M. E. Di Pietro, G. De Luca, G. Celebre, M. Longeri, L. Muccioli and C. Zannoni, ChemPhysChem, 2014, 15, 1356–1367 CrossRef CAS.
- F. Chami, M. R. Wilson and V. S. Oganesyan, Soft Matter, 2012, 8, 6823–6833 RSC.
- N. J. Boyd and M. R. Wilson, Phys. Chem. Chem. Phys., 2015, 17, 24851–24865 RSC.
- R: A language and environment for statistical computing (2014) R Foundation for Statistical Computing, Vienna, Austria.
- M. J. Abraham, T. Murtola, R. Schulz, S. Páll, J. C. Smith, B. Hess and E. Lindahl, SoftwareX, 2015, 1–2, 19–25 CrossRef.
- S. Páll, M. J. Abraham, C. Kutzner, B. Hess and E. Lindahl, in Solving Software Challenges for Exascale: International Conference on Exascale Applications and Software, EASC 2014, Stockholm, Sweden, April 2-3, 2014, Revised Selected Papers, ed. S. Markidis and E. Laure, Springer International Publishing, Cham, 2015, pp. 3–27 Search PubMed.
- S. Pronk, S. Páll, R. Schulz, P. Larsson, P. Bjelkmar, R. Apostolov, M. R. Shirts, J. C. Smith, P. M. Kasson, D. van der Spoel, B. Hess and E. Lindahl, Bioinformatics, 2013, 29, 845–854 CrossRef CAS.
- B. Hess, C. Kutzner, D. van der Spoel and E. Lindahl, J. Chem. Theory Comput., 2008, 4, 435–447 CrossRef CAS.
- D. Van Der Spoel, E. Lindahl, B. Hess, G. Groenhof, A. E. Mark and H. J. C. Berendsen, J. Comput. Chem., 2005, 26, 1701–1718 CrossRef CAS PubMed.
- E. Lindahl, B. Hess and D. van der Spoel, Molecular Modeling Annual, 2001, 7, 306–317 CrossRef CAS.
- H. J. C. Berendsen, D. Vanderspoel and R. Vandrunen, Comput. Phys. Commun., 1995, 91, 43–56 CrossRef CAS.
- J. Wang, R. M. Wolf, J. W. Caldwell, P. A. Kollman and D. A. Case, J. Comput. Chem., 2004, 25, 1157–1174 CrossRef CAS.
- D. A. Case, T. E. Cheatham, T. Darden, H. Gohlke, R. Luo, K. M. Merz, A. Onufriev, C. Simmerling, B. Wang and R. J. Woods, J. Comput. Chem., 2005, 26, 1668–1688 CrossRef CAS.
- J. Wang, W. Wang, P. A. Kollman and D. A. Case, J. Mol. Graphics Modell., 2006, 25, 247–260 CrossRef CAS.
- A. W. Sousa da Silva and W. F. Vranken, BMC Res. Notes, 2012, 5, 367 CrossRef.
- C. I. Bayly, P. Cieplak, W. Cornell and P. A. Kollman, J. Phys. Chem., 1993, 97, 10269–10280 CrossRef CAS.
- A. D. Becke, J. Chem. Phys., 1993, 98, 5648–5652 CrossRef CAS.
- C. T. Lee, W. T. Yang and R. G. Parr, Phys. Rev. B: Condens. Matter Mater. Phys., 1988, 37, 785–789 CrossRef CAS PubMed.
- M. J. Frisch, G. W. Trucks, H. B. Schlegel, G. E. Scuseria, M. A. Robb, J. R. Cheeseman, G. Scalmani, V. Barone, B. Mennucci, G. A. Petersson, H. Nakatsuji, M. Caricato, X. Li, H. P. Hratchian, A. F. Izmaylov, J. Bloino, G. Zheng, J. L. Sonnenberg, M. Hada, M. Ehara, K. Toyota, R. Fukuda, J. Hasegawa, M. Ishida, T. Nakajima, Y. Honda, O. Kitao, H. Nakai, T. Vreven, J. J. A. Montgomery, J. E. Peralta, F. Ogliaro, M. Bearpark, J. J. Heyd, E. Brothers, K. N. Kudin, V. N. Staroverov, R. Kobayashi, J. Normand, K. Raghavachari, A. Rendell, J. C. Burant, S. S. Iyengar, J. Tomasi, M. Cossi, N. Rega, J. M. Millam, M. Klene, J. E. Knox, J. B. Cross, V. Bakken, C. Adamo, J. Jaramillo, R. Gomperts, R. E. Stratmann, O. Yazyev, A. J. Austin, R. Cammi, C. Pomelli, J. W. Ochterski, R. L. Martin, K. Morokuma, V. G. Zakrzewski, G. A. Voth, P. Salvador, J. J. Dannenberg, S. Dapprich, A. D. Daniels, Ö. Farkas, J. B. Foresman, J. V. Ortiz, J. Cioslowski and D. J. Fox, Gaussian 09, Revision B.01, Gaussian Inc., Wallingford, CT, 2009 Search PubMed.
- B. Hess, H. Bekker, H. J. C. Berendsen and J. G. E. M. Fraaije, J. Comput. Chem., 1997, 18, 1463–1472 CrossRef CAS.
- S. Nosé, Mol. Phys., 1984, 52, 255–268 CrossRef.
- W. G. Hoover, Phys. Rev. A: At., Mol., Opt. Phys., 1985, 31, 1695–1697 CrossRef.
- M. Parrinello and A. Rahman, J. Appl. Phys., 1981, 52, 7182–7190 CrossRef CAS.
- S. Nosé and M. L. Klein, Mol. Phys., 1983, 50, 1055–1076 CrossRef.
- T. Darden, D. York and L. Pedersen, J. Chem. Phys., 1993, 98, 10089–10092 CrossRef CAS.
- C. Zannoni, in Molecular Physics of Liquid Crystals, ed. G. R. Luckhurst and G. W. Gray, Academic Press, London, 1979, pp. 51–84 Search PubMed.
- I. M. Withers, C. M. Care and D. J. Cleaver, J. Chem. Phys., 2000, 113, 5078–5090 CrossRef CAS.
- R. Pecheanu and N. M. Cann, Phys. Rev. E: Stat., Nonlinear, Soft Matter Phys., 2010, 81, 041704 CrossRef CAS PubMed.
- W. Humphrey, A. Dalke and K. Schulten, J. Mol. Graphics, 1996, 14, 33–38 CrossRef CAS PubMed.
- J. Ahrens, B. Geveci and C. Law, in Visualization Handbook, ed. C. R. Johnson, Butterworth-Heinemann, Burlington, 2005, pp. 717–731 Search PubMed.
- C. Zannoni, in The Molecular Dynamics of Liquid Crystals, ed. G. R. Luckhurst and C. A. Veracini, Kluwer Academic, Dordrecht, 1994, pp. 11–40 Search PubMed.
- A. J. Leadbetter, in The Molecular Physics of Liquid Crystals, ed. G. R. Luckhurst and G. W. Gray, Academic Press, London, 1979, pp. 285–316 Search PubMed.
- N. Kapernaum and F. Giesselmann, Phys. Rev. E: Stat., Nonlinear, Soft Matter Phys., 2008, 78, 062701 CrossRef.
- Y. Takanishi, A. Ikeda, H. Takezoe and A. Fukuda, Phys. Rev. E: Stat., Nonlinear, Soft Matter Phys., 1995, 51, 400–406 CrossRef CAS.
- M. T. Sims, L. C. Abbott, S. J. Cowling, J. W. Goodby and J. N. Moore, Phys. Chem. Chem. Phys., 2017, 19, 813–827 RSC.
- M. R. Wilson, J. Mol. Liq., 1996, 68, 23–31 CrossRef CAS.
- P. D. Roy, M. K. Das and R. Paul, Mol. Cryst. Liq. Cryst. Sci. Technol., Sect. A, 2001, 365, 607–615 CrossRef CAS.
- J. W. Goodby, Handbook of Liquid Crystals, Wiley-VCH Verlag GmbH & Co. KGaA, 2014, ch. 2, vol. 4, part I, pp. 1–26 Search PubMed.
- J. E. Lydon and C. J. Coakley, J. Phys. Colloq., 1975, 36, C1-45–C1-48 Search PubMed.
- P. E. Cladis, R. K. Bogardus, W. B. Daniels and G. N. Taylor, Phys. Rev. Lett., 1977, 39, 720–723 CrossRef CAS.
- Y. Yamamura, R. Tsuchiya, S. Fujimura, M. Hishida and K. Saito, J. Phys. Chem. B, 2017, 121, 1438–1447 CrossRef CAS PubMed.
- G. G. Alexander, S. M. King, R. M. Richardson and H. Zimmermann, Liq. Cryst., 2010, 37, 961–968 CrossRef CAS.
- A. J. Leadbetter, J. L. A. Durrant and M. Rugman, Mol. Cryst. Liq. Cryst., 1977, 34, 231–235 CrossRef CAS.
Footnotes |
| † Electronic supplementary information (ESI) available. See DOI: 10.1039/c9sm01527b |
| ‡ Current address: Department of Applied Sciences, Faculty of Health and Life Sciences, Northumbria University, Newcastle Upon Tyne, NE1 8ST, UK. |
| This journal is © The Royal Society of Chemistry 2019 |

