 Open Access Article
Load-dependent surface nanomechanical properties of poly-HEMA hydrogels in aqueous medium†
Gen
Li
 *a,
Illia
Dobryden
 a,
Eric Johansson
Salazar-Sandoval
b,
Mats
Johansson
 c and
Per M.
Claesson
 ab
ab
aKTH Royal Institute of Technology, School of Engineering Sciences in Chemistry, Biotechnology and Health, Department of Chemistry, Division of Surface and Corrosion Science, Drottning Kristinas väg 51, SE 10044 Stockholm, Sweden. E-mail: genl@kth.se
bRISE Research Institutes of Sweden, Division of Bioscience and Materials, Box 5607, SE 114 86 Stockholm, Sweden
cKTH Royal Institute of Technology, School of Engineering Sciences in Chemistry, Biotechnology and Health, Department of Fibre & Polymer Technology, Teknikringen 48, SE 10044 Stockholm, Sweden
First published on 27th August 2019
Abstract
The mechanical properties of hydrogels are of importance in many applications, including scaffolds and drug delivery vehicles where the release of drugs is controlled by water transport. While the macroscopic mechanical properties of hydrogels have been reported frequently, there are less studies devoted to the equally important nanomechanical response to local load and shear. Scanning probe methods offer the possibility to gain insight on surface nanomechanical properties with high spatial resolution, and thereby provide fundamental insights on local material property variations. In this work, we investigate the local response to load and shear of poly(2-hydroxyethyl methacrylate) hydrogels with two different cross-linking densities submerged in aqueous solution. The response of the hydrogels to purely normal loads, as well as the combined action of load and shear, was found to be complex due to viscoelastic effects. Our results show that the surface stiffness of the hydrogel samples increased with increasing load, while the tip–hydrogel adhesion was strongly affected by the load only when the cross-linking density was low. The combined action of load and shear results in the formation of a temporary sub-micrometer hill in front of the laterally moving tip. As the tip pushes against such hills, a pronounced stick-slip effect is observed for the hydrogel with low cross-linking density. No plastic deformation or permanent wear scar was found under our experimental conditions.
1 Introduction
Hydrogels are hydrophilic three-dimensional cross-linked polymeric networks that can retain significant amounts of water within their structure without dissolution. There are many applications of hydrogel materials, particularly in the biomedical field.1,2 The mechanical and frictional properties of hydrogels are of significant importance in many applications such as scaffolds,3 tissue engineering1 and liquid flow control,4 and here, the mechanical response at different length scales should be considered. Hydrogels based on 2-hydroxyethyl methacrylate (HEMA) are common, and such materials show good biocompatibility and have been utilized, e.g., as dental bonding resins4 and contact lens materials.5Atomic force microscopy (AFM) is a powerful tool to characterize surface nanomechanical properties, and different approaches have been discussed in recent review articles.6–9 One informative way to extract such information is to analyze force–displacement curves (FDCs) at each pixel of an image. This is possible using well-known AFM modes such as force volume (FV),10 Peakforce QNM,11 and quantitative Imaging (QI).12 Data are often interpreted within the quasi-static assumption that neglects viscosity effects and thus utilizes standard elastic contact mechanics models for analysis.8 When the response is elastic, these models are well-suited for determining the surface elastic modulus of polymer samples. For instance, Huang et al. investigated the temperature-dependence of the surface nanomechanical properties of a polymer composite with QI mode, and elucidated the properties of the interphase between matrix and filler nanoparticles.13 In another work, Young et al. studied polymer samples with Youngs moduli in the range of 0.2–4.8 GPa and compared the data obtained using the Peakforce QNM mode with results from a conventional nanoindentation method.14 They found that the Peakforce QNM mode provides a surface elastic modulus that in most cases compares favorably with data from nanoindentation. However, it is important to calibrate the cantilever against a reference sample with a known elastic modulus, and one should keep in mind that it is not uncommon that the surface mechanical properties are different from the corresponding bulk properties.15
For viscoelastic materials, such as hydrogels, analysis of FDCs using elastic contact mechanics models is questionable. As an alternative, one may choose to probe the local creep response16 and stress relaxation17–19 of soft samples by AFM based methods. Here, the tip rests on the surface of the sample, and then either the change in tip deflection with time or the change in force required to keep the deflection constant with time is monitored. The obtained data can be interpreted using viscous models to extract viscous parameters.20 For instance, Efremov et al.21 fitted the indentation time history recorded simultaneously with FDC into a viscoelastic model, and found good agreement between experimental results and computer simulations. In another study on bacterial surfaces, the integral under the force curve measured during decompression was used as a measure of the elastic energy of compression, and the difference in the integrals of the force curves measured on compression and decompression was used to estimate the viscous energy.22 However, for our system, we cannot regard the response on decompression to be purely elastic, so this approach was not used in the present study. The effect of relative humidity on polyHEMA contact lenses has also been explored, and the data suggested that even though the bulk material was hydrated, the surface could become dyhydrated at relative humidities below about 50%.23
At the early stage of AFM development, tapping mode, a dynamic AFM mode, was used to probe surface topography and qualitatively map mechanical properties. Here, the phase of the detected signal is affected by the tip–surface interactions. However, it is not straightforward to extract and quantify standard nanomechanical properties of the samples, and for this reason, multi-frequency methods were developed, where the viscous and elastic response of the sample can be separated.24–27 Since multi-frequency methods are able to distinguish between viscous and elastic contributions, they are well-suited for characterizing soft and viscoelastic samples, such as hydrogels. However, these methods rely on a high quality factor of the cantilever to obtain reliable results.28 This is a limitation when the measurements should be conducted in aqueous media, even though it was recently demonstrated that the intermodulation AFM method can be successfully applied to measure and map tip–surface interactions in water.27
Lateral force measurements, related to the friction properties, of hydrogels have been studied at the macroscale using different methods.29–31 At the microscale, the colloidal probe AFM method has been applied to study friction properties of poly-HEMA,32 cartilage33 and other soft materials. Probing lateral forces at the nanoscale and distinguishing effects of heterogeneous surface properties require the use of a sharp AFM tip. This will lead to a large indentation into the soft material and a rather complex response to lateral forces, as will be shown in this study.
In this work, the surface nanomechanical responses at different applied loads of poly-HEMA hydrogels with two different cross-linking densities were studied in aqueous solution using AFM methods. The nanoscale surface mechanical response of the hydrogel with resolution down to the tens of nanometer length scale was studied utilizing sharp AFM probes. In our study, QI mode was applied to allow accurate control over the small forces used during the experiments. The normal load-dependence of surface mechanical properties and response to lateral forces were elucidated, and the influence of the viscoelastic nature of the hydrogel material is discussed.
2 Materials and methods
2.1 Material
HEMA with a molecular weight of 130.14 g mol−1 and poly(ethylene glycol)diacrylate (PEGDA) with an average molecular weight of 575 g mol−1 were obtained from Sigma-Aldrich. This cross-linker has about 10 ethylene glycol units between the two acrylate groups, giving a spacer length of about 4 nm. The ammonium persulfate (APS) initiator was obtained from Sigma-Aldrich. N,N,N′,N′-Tetramethylethylenediamine (TEMED) was obtained from Sigma-Aldrich and used as a catalyst to accelerate the curing process. MilliQ purified water with a resistivity of 18 MΩ cm (Millipore Corporation) and ethanol (99.9%) were used for sample preparation. Poly-HEMA was cured in a 1 × 2 × 0.2 cm Teflon mold. The mold was covered by a glass slide (Thermo Scientific, Germany) silanized by (3,3-dimethylbutyl)dimethylchlorosilane (95%, Sigma Aldrich) to reduce the surface energy.2.2 Preparation of poly-HEMA hydrogels
Poly-HEMA hydrogel samples were prepared by free radical polymerization. Five grams of HEMA was mixed with 0.125 g or 0.5 g of the PEGDA cross-linker (2.5 wt% or 10 wt% relative to the HEMA monomer, corresponding to 0.58 and 2.45 mol%, respectively) in a vial, and 0.025 g of the APS initiator was dissolved in 5 g of MilliQ water in another vial. The two solutions were mixed and purged with nitrogen gas for 5 minutes. Next, 0.015 g of TEMED was added to the degassed solution that was gently shaken. The final solution was then cast into the mold and covered by a silanized glass slide for 2 hours. The polymerized samples, with dimensions of 1 × 2 × 0.2 cm, were taken out of the mold and cleaned with a 1![[thin space (1/6-em)]](https://www.rsc.org/images/entities/char_2009.gif) :
:![[thin space (1/6-em)]](https://www.rsc.org/images/entities/char_2009.gif) 1 water/ethanol solution to remove eventual residual unpolymerized monomers. The samples were stored in MilliQ water. The prepared hydrogel samples will be referred to as polyHEMA-2.5 and polyHEMA-10 to specify the wt% of cross-linker added. On average, these hydrogels have 85 and 19 HEMA groups between cross-links, corresponding to a contour length of about 13 and 3 nm along the polyHEMA chain. The water content of the 1 × 2 × 0.2 cm samples was estimated as follows: The wet sample was removed from MilliQ water and gently wiped with a tissue to remove surface water. Next, the sample was dried at 150 °C for 48 hours and the weight of the sample was determined again. This resulted in a water content of 48 and 44 wt% for polyHEMA-2.5 and polyHEMA-10, respectively. Previously, a slightly lower water content has been reported for poly-HEMA with a slightly shorter cross-linker (38.3 wt% for poly-HEMA with 2 wt% ethyl dimethacrylate and 34.3 wt% for 5 wt% cross-linker), and it has been concluded that the water content of a fully swollen homogeneous pHEMA hydrogel is about 40%.34 Similarly, the water content of polyHEMA hydrogels cross-linked with tetraethylene glycol was found to be about 40% for cross-linking densities of 1–12 mol%.35 This small effect of cross-linking density is a consequence of the limited water solubility of polyHEMA.
1 water/ethanol solution to remove eventual residual unpolymerized monomers. The samples were stored in MilliQ water. The prepared hydrogel samples will be referred to as polyHEMA-2.5 and polyHEMA-10 to specify the wt% of cross-linker added. On average, these hydrogels have 85 and 19 HEMA groups between cross-links, corresponding to a contour length of about 13 and 3 nm along the polyHEMA chain. The water content of the 1 × 2 × 0.2 cm samples was estimated as follows: The wet sample was removed from MilliQ water and gently wiped with a tissue to remove surface water. Next, the sample was dried at 150 °C for 48 hours and the weight of the sample was determined again. This resulted in a water content of 48 and 44 wt% for polyHEMA-2.5 and polyHEMA-10, respectively. Previously, a slightly lower water content has been reported for poly-HEMA with a slightly shorter cross-linker (38.3 wt% for poly-HEMA with 2 wt% ethyl dimethacrylate and 34.3 wt% for 5 wt% cross-linker), and it has been concluded that the water content of a fully swollen homogeneous pHEMA hydrogel is about 40%.34 Similarly, the water content of polyHEMA hydrogels cross-linked with tetraethylene glycol was found to be about 40% for cross-linking densities of 1–12 mol%.35 This small effect of cross-linking density is a consequence of the limited water solubility of polyHEMA.
2.3 Attenuated total reflection Fourier transform infrared (ATR-IR) spectroscopy
The attenuated total reflection Fourier transform infrared (ATR-IR) spectra were measured with a Bruker tensor 37 FTIR spectrometer with a platinum ATR-IR accessory. A diamond crystal with the angle of incidence for the IR beam of 45° was used. The resolution of the IR spectrum was 4 cm−1, and 256 scans were collected and averaged for each sample. The hydrogel samples were kept in MilliQ water prior to the measurements.2.4 Atomic force microscopy (AFM)
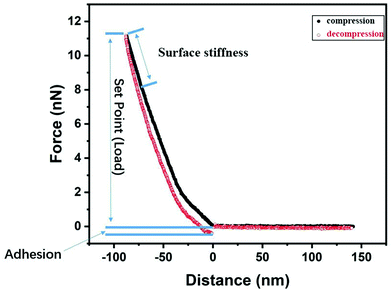
Nanomechanical and lateral force properties were measured with a commercial AFM instrument (NanoWizard 3, JPK Instruments AG). Commercial AFM probes, Contact G (BudgetSensors), were used for measurements of topography and mechanical properties. The nominal spring constant was 0.2 N m−1. The actual spring constant and optical lever sensitivity of each cantilever were determined with the thermal tune method36 before each experiment, and the tip radius was determined from scanning electron microscopy images to typically be below 19 nm (ESI,† Fig. S1). All AFM experiments were conducted in MiliQ water with a resistivity of 18 MΩ cm and pH ≈ 5.6, and the same environment was used for storage of the hydrogel samples.We utilized the Quantitative Imaging mode (QI), and here, the mechanical properties, such as adhesion and surface stiffness, were extracted from the captured force–displacement curves and the corresponding images (with 128 × 128 pixels) were reconstructed by utilizing the JPK Data Processing software (version 6.1.102). The reconstruction of stiffness and adhesion maps is done by analysis of force curves as illustrated in Fig. 1. The surface stiffness37 was defined as the slope of the FDC in the 20 nm distance range closest to the maximum applied load on approach and, alternatively, on retraction. The adhesion is defined as the difference between the lowest point in the decompression curve and the zero force region. The mechanical response of the studied hydrogels is viscoelastic, and this is illustrated by the difference in surface stiffness evaluated from force curves measured on compression and decompression.
It was found that the nanomechanical response of the hydrogel samples was load-dependent, and it is thus not sufficient to use a single set point. Thus, QI experiments were conducted at different applied loads (from 1 to 11 nN) at each investigated surface area. The application of different loads means that different indentation depths were achieved, and thus the nanomechanical properties as a function of the indentation depth were obtained. The measurements were conducted at a piezo expansion rate of 5 μm s−1 to minimize cantilever hydrodynamic drag forces, and this is sufficiently slow as evidenced by overlapping data on approach and retraction at large separations (Fig. 1).
The lateral force response of the hydrogel samples was investigated with the same sharp probe in contact mode using 128 separate lines, each with a pixel resolution of 128, different normal loads (2, 5 and 10 nN), and a line scan rate of 1 Hz. Each area was scanned once during the wear test. The lateral deflection of the tip during sliding along the surface was also recorded. The area challenged by the combined action of normal and shear forces was imaged in QI mode (128 × 128 pixels) with a low imaging force (5 nN) before and after the lateral force experiment to visualize the extent of eventual wear and plastic deformation. These images were recorded at a scan speed of 60 μm s−1, and the area exposed to lateral forces was located in the middle of these images and occupies 1/4 of the image area.
3 Results and discussion
3.1 ATR-IR spectra
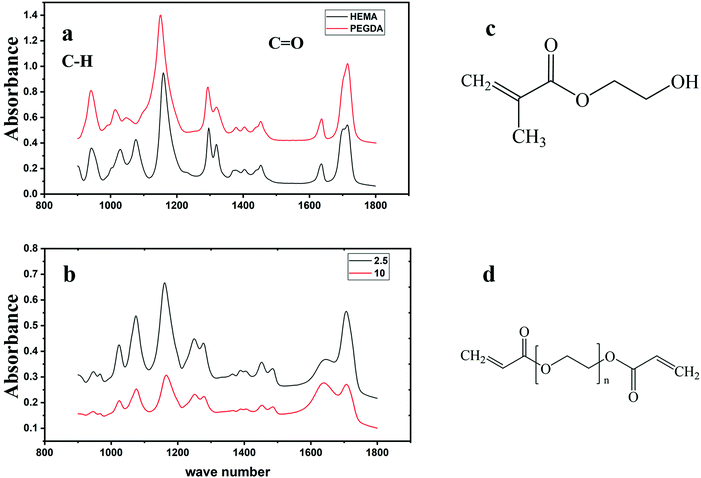
ATR-IR spectra, as shown in Fig. 2, were recorded to obtain chemical information of the samples with different cross-linking densities, and here, the structures of the HEMA monomer and the PEGDA crosslinking agent are also illustrated. Assignments of the most important peaks are provided in Table 1 and they correspond to those previously reported.38| Vibration mode | Peak value (cm−1) | |
|---|---|---|
| polyHEMA-2.5 | polyHEMA-10 | |
ν(C![[double bond, length as m-dash]](https://www.rsc.org/images/entities/char_e001.gif) O) O) |
1706 | 1708 |
ν(C![[double bond, length as m-dash]](https://www.rsc.org/images/entities/char_e001.gif) C) C) |
1642 | 1638 |
| β(H–O–H)33 | 1635 | 1635 |
| δ(CH2) | 1486 | 1486 |
| δ(CH2), δ(CH3)as | 1452 | 1453 |
| δ(CH3)s | 1388 | 1388 |
| ω(CH2) | 1365 | 1365 |
| ω(CH2), δ(CH) | 1278 | 1279 |
| ν(CO) | 1251 | 1251 |
| γ(CH3), T(OH) | 1161 | 1164 |
| ν(O–C), alcohol | 1074 | 1075 |
| ν(C–O), ester | 1023 | 1023 |
| δ(C–H), vinyl | 944 | 944 |
From Fig. 2, we noticed that the most pronounced difference between the two hydrogel samples with different cross-linking densities is the peak located at 1642 cm−1, which is due to ν(C![[double bond, length as m-dash]](https://www.rsc.org/images/entities/char_e001.gif) O), but it also overlaps with the peak from H–O–H scissor-bending in water.39
O), but it also overlaps with the peak from H–O–H scissor-bending in water.39
The conversion of the monomer, X, can be roughly calculated by the decrease of the height of the peak located at 944 cm−1, which represents the vinyl C–H out-of-plane bending vibration. The peak located at 1706 cm−1, which represents the C![[double bond, length as m-dash]](https://www.rsc.org/images/entities/char_e001.gif) O stretching mode, is used to normalize the vinyl peak since there should be no change to this peak during polymerization.40 The conversion was calculated as:
O stretching mode, is used to normalize the vinyl peak since there should be no change to this peak during polymerization.40 The conversion was calculated as:
| X = [1 − (H944/H1706)p/(H944/H1706)m] × 100% | (1) |
3.2 Topography
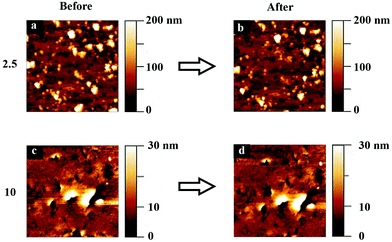
Topography images of polyHEMA-2.5 and polyHEMA-10 samples imaged over a 10 × 10 μm2 area are shown in Fig. 3. Both samples display some porous structures and particles present on the surface. To facilitate studies of the load dependence of the nanomechanical properties of the hydrogel samples, smooth areas of 1 × 1 μm2 without larger particles or pores were selected.3.3 Force curves
Since the nanomechanical properties are extracted from FDCs, it is appropriate to first look at typical FDCs recorded between the tip and surface in aqueous solution, and examples are shown in Fig. 4. The compression force–displacement curve measured between the tip and polyHEMA-2.5 shows no strong attractive or repulsive interaction until the tip touches the surface. Further compression leads to a repulsive force as the soft hydrogel deforms and the tip indents the surface. We note that the slope of the repulsive force increases with indentation depth. On retraction, the force decays rapidly and there is a clear hysteresis between the force curve measured on compression and decompression. The hysteresis between the force curves indicates significant energy dissipation during the measurement, which we attribute to viscoelastic relaxation in the poly-HEMA hydrogel sample including local expulsion and reentrance of water. On further retraction, the force reaches negative values, which means that the tip–sample force is now net attractive. The attraction extends to large distances, and the irregular steps seen in the force curve are signs of polymers being attached to and stretched by the retracting tip.42,43 The measured forces between the tip and the polyHEMA-10 sample show similar features to those for polyHEMA-2.5, but with a smaller force hysteresis, higher slope of the repulsive part of the force curve, and lower adhesion. The larger slope demonstrates that the surface of the polyHEMA-10 hydrogel is stiffer than the surface of polyHEMA-2.5, as expected due to the higher cross-linking density.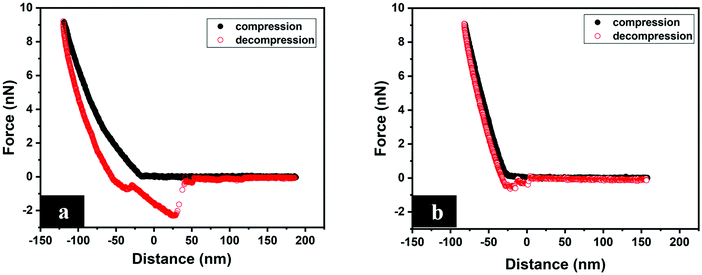 | ||
| Fig. 4 Typical FDCs measured between the tip and (a) polyHEMA-2.5, and (b) polyHEMA-10. The measurements were carried out in water. | ||
As shown in Fig. 4, there is a clear difference between the FDCs recorded on compression and decompression, and this means that the deformation of the sample induced by the tip is not recovered on the time scale of the measurements (one force curve is recorded within 0.16 s). Thus, over this time scale, the samples show a viscoelastic response to the applied load. Meanwhile, we did not observe any permanent change of the sample surface before and after the measurement. The presence of FDC hysteresis means that contact mechanics models that only consider the elastic response, such as the Hertz,44,45 DMT46 and JKR47 models, are not valid without additional modifications to take into account the viscous contribution. Thus, we report the surface stiffness, defined as the slope of the FDC at high force, instead of the Young's modulus, and the surface stiffness is extracted from both the approach and retraction curves to illustrate the viscoelastic nature of the interaction.
3.4 Load dependent nanomechanical properties
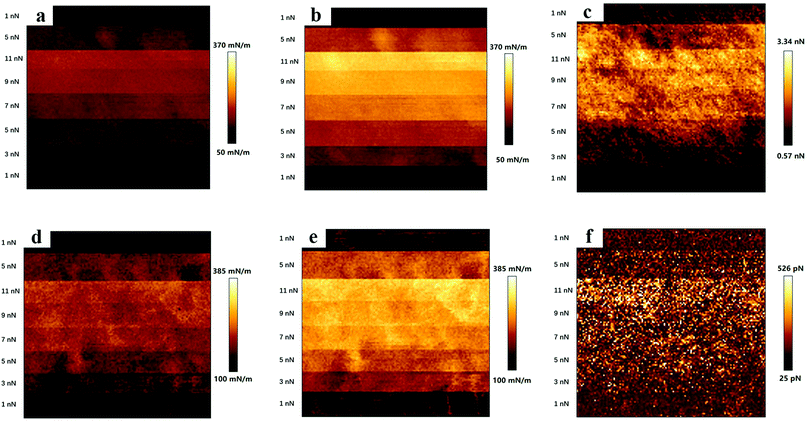
Surface stiffness and adhesion maps evaluated for polyHEMA-2.5 and polyHEMA-10 on compression and decompression at varying loads are shown in Fig. 5.The surface stiffness increases with increasing normal load (up to the maximum load of 11 nN used in the experiment) for both samples, and only small variations are observed at any given load (see error bars in Fig. 7). There are some possible reasons for the load dependent response. First, the surface of hydrogels is commonly less cross-linked than the core volume due to oxygen invasion during the polymerization process.48 This can result in the presence of dangling polymer tails at the surface, and a sign of stretching polymer chains was observed in the force curves on retraction, as shown in Fig. 4. Second, the compressed volume becomes larger when the tip indents at higher loads and deforms the sample. This results in more extensive water flow out of the compressed volume. If such a flow occurs over a similar or longer time scale than the experiment (0.16 s for capturing one force curve), it will contribute to the viscoelastic response of the material as manifested in the hysteresis between force curves measured on compression and decompression.
The surface stiffness evaluated from compression and decompression force curves is illustrated in Fig. 6, and in all cases, it increases with load. The surface stiffness determined on decompression is higher than that determined on compression for both samples at all investigated loads. The surface stiffness of polyHEMA-10 is always higher than that of polyHEMA-2.5 due to the higher cross-linking density. Interestingly, the difference between the surface stiffness evaluated from the decompression curve of the two samples decreases with increasing load. We interpret this as being due to similar slow water diffusion back into the compressed volume when the load is released.
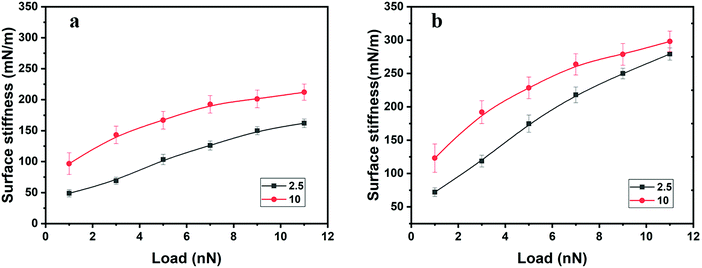 | ||
| Fig. 6 Surface stiffness as a function of load in water determined on (a) compression and (b) decompression. The lines in the figure are guides to the eye. | ||
The load dependence of the adhesion force was found to be different for polyHEMA-2.5 and polyHEMA-10, as illustrated in Fig. 7a. While the adhesion force for polyHEMA-2.5 increases significantly with increasing load, it was found to be much less affected by the load for polyHEMA-10. This can hardly be attributed to a significantly larger deformation for the polyHEMA-2.5 sample, as shown in Fig. 7b. Though the average deformation of the polyHEMA-2.5 sample is larger than that of polyHEMA-10, the difference between them is not as significant as the difference in adhesion force. This suggests that the higher cross-linking density in polyHEMA-10, which reduces the flexibility of polymer chains, reduces the chain's ability to adopt conformations that allow favorable interactions with the tip.
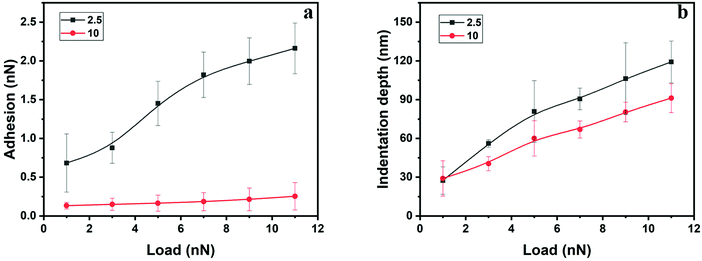 | ||
| Fig. 7 Adhesion force (a) and indentation depth (b) as a function of load for polyHEMA-2.5 and polyHEMA-10. The lines in the figure are guides to the eye. | ||
In indentation measurements, it is often assumed that decompression curves represent the elastic response of the material,37 an assumption that is not necessarily correct for our hydrogels. Nevertheless, such an analysis returns an elastic modulus of polyHEMA-2.5 in the range of 1.1–2.4 MPa, and 2.3–3.1 MPa for polyHEMA-10, but these values should be used with care.
3.5 Load-dependent response to lateral forces
In these experiments, defined loads were applied between the tip and the sample at the same time as the tip was moved along the surface. Thus, the sample is deformed both by the applied load and by the lateral motion of the tip. The topography images of the hydrogel surfaces were recorded before and after this experiment, and these are shown in Fig. 8.No clear wear scars or pile up of worn materials is visible on the edges of the area scanned in contact mode. Only some particle removal or repositioning can be observed for polyHEMA-2.5. This suggests that over the time scale between wear measurements and imaging (the image was recorded about one minute after conducting the wear experiment), the deformation is predominantly elastic. However, this does not mean that the response is predominantly elastic during the much shorter tip–sample contact during measurements of one force curve, and we instead argue that in this case, the sample displays a viscoelastic behavior.
Height and lateral force maps captured during application of a lateral force, and typical line profiles recorded at normal loads of 2, 5 and 10 nN for a polyHEMA-2.5 sample are shown in Fig. 9. Let us first consider the results obtained at a load of 2 nN, as reported in Fig. 9c. Initially, the tip sinks into the hydrogel material under the constant load of 2 nN, and the hydrogel also deforms in the direction of the tip movement. This results in the formation of a stress-induced hill of hydrogel material in front of the tip. During this process, it becomes progressively more difficult to deform the hydrogel, which causes an increased lateral force. At some point, the energy required for the tip to climb up from the created trench becomes less than the energy required to further deform the sample. As the tip leaves the trench, the tip–hydrogel contact area decreases and the lateral force reaches a maximum value before the tip completely leaves the trench. Once the lateral force has reached its maximum value, the tip slips while it is still climbing out of the trench. When the tip is out of the trench, the stress in the hydrogel material relaxes (no permanent deformation is observed) and the process starts in a second cycle. We note that the height at the beginning of the second cycle is slightly larger than at the beginning of the first cycle, suggesting that the stress in the hydrogel material is not completely relaxed as the tip has climbed out of the trench, but a small hill remains. When the loads become larger (Fig. 9d and e), several stick-slip phenomena are observed in the lateral force channel as the tip climbs upwards along the side of the hill created by the lateral force. In contrast to what was observed at a load of 2 nN, the tip never manages to climb over the hill, but only slips upwards along the hill. It thus appears that the hill increases in height more rapidly compared to the rate at which the tip climbs upwards.
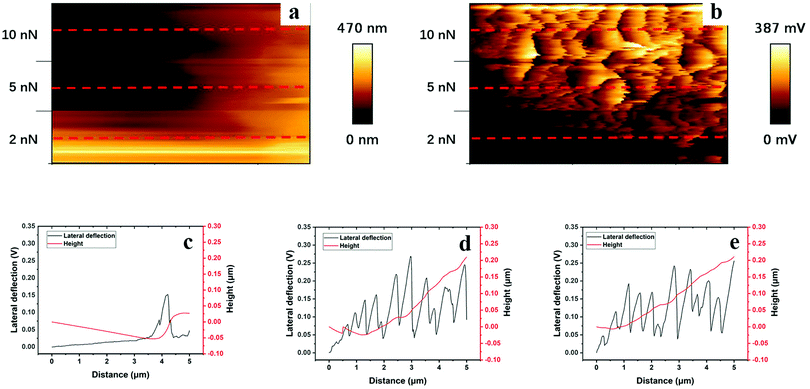 | ||
| Fig. 9 Height (a) and lateral cantilever deflection (b) maps (1 × 0.6 μm2), and typical line profiles taken along the red dashed lines under loads of 2 nN (c), 5 nN (d), and 10 nN (e) of polyHEMA-2.5 (the images consist of about 150 such lines). For additional line scans and images, see the ESI.† | ||
Clear surface waves can be observed in the lateral force map, and these are caused by frictional stick-slip.49 Stick-slip is very commonly observed, and for polymer samples, it sometimes results in the creation of periodic surface structures caused by plastic deformation.49 Deformation due to the action of load and shear is also observed for polyHEMA-2.5, but here, a hill of the hydrogel material forms in front of the moving tip and the tip does not manage to climb over this hill fully (except at very low forces). Further, the deformation is fully recovered for the soft hydrogel material.
The corresponding data for the more cross-linked hydrogel, polyHEMA-10, are shown in Fig. 10. The increased cross-linking density results in a smaller depth of the trench and a smaller height of the hill in front of the moving tip (Fig. 10c–e). An initial sink-in followed by a climb upwards can, however, be noticed. The lateral force increases as the stress in the material increases and the tip climbs upwards against the hill. No large amplitude stick-slip effect is observed for polyHEMA-10, but rather there are a large number of low amplitude stick-slip events. Thus, the response to a lateral force is significantly changed by increasing the content of the cross-linker from 2.5 wt% to 10 wt%. Both the higher indentation depth (Fig. 7b) and the higher tip–sample adhesion (Fig. 7a) for the polyHEMA-2.5 sample are expected to contribute to the enhanced stick-slip effect found at the lower cross-linking density.50
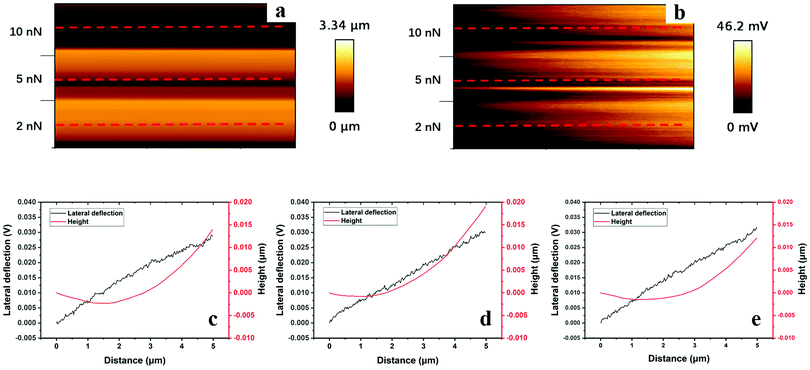 | ||
| Fig. 10 Height (a) and lateral cantilever deflection (b) maps (1 × 0.6 μm2), and typical line profiles taken along the red lines under loads of 2 nN (c), 5 nN (d), and 10 nN (e) of polyHEMA-10 samples (the images consist of about 150 such lines). For additional line scans and images, see the ESI.† | ||
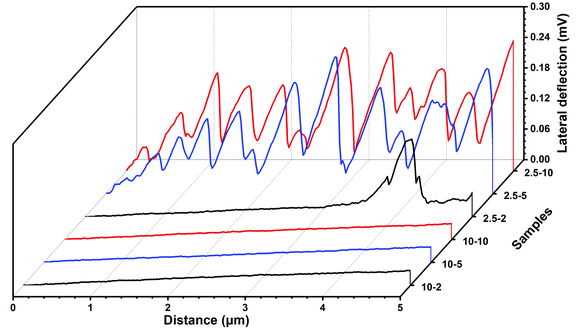
In Fig. 11, we illustrate the much stronger lateral forces observed for polyHEMA-2.5 compared to those for polyHEMA-10 in plots of the lateral cantilever deflection using the same scale for the two samples. Clearly, with increasing cross-linking density, the hydrogel network becomes less deformable and poly-HEMA-10 allows much less deformations under the combined action of load and shear used in this investigation. Further, the fact that the topography of the sample surface did not change after the measurement suggests the absence of plastic deformations and wear for both hydrogels.
4 Conclusions
The understanding of nanomechanical responses of hydrogel materials is of importance in many applications, where tissue engineering, scaffold materials and drug delivery vehicles for controlled delivery via controlled flow are examples from the biomedical field. In this work, we emphasize the importance of investigating the load-dependent nanomechanical properties under both pure normal load and under the combined action of load and shear. We also show that a similar material, differing only in cross-linking density, displays significantly different nanomechanical responses. In particular, we elucidated how two kinds of polyHEMA hydrogel samples with different cross-linking densities respond to local deformation in normal and lateral directions induced by an AFM tip with an end radius of about 19 nm. For both types of hydrogels, a viscoelastic response arising from chain relaxation and water flow was found, and we evaluated the load-dependence of the surface stiffness of the samples from the force distance curves. Due to the viscoelastic nature of the samples, the surface stiffness on decompression was found to be significantly larger than that on compression, and both measures of surface stiffness increased with load. By increasing the amount of cross-linker by a factor of 4 (2.5 wt% in polyHEMA-2.5 and 10 wt% in polyHEMA-10), the surface stiffness on compression increased by a factor of 2 at low loads (1 nN), and decreased to a factor of 1.4 at high loads (11 nN). The relative increase in surface stiffness with increasing cross-linking density evaluated on decompression was smaller, a factor of 1.6 at 1 nN and a factor of 1.1 at 11 nN.The tip–sample adhesion was found to be higher for polyHEMA-2.5 than for polyHEMA-10. We attribute this to larger chain flexibility that facilitates polymer attachment to the tip. The tip–sample adhesion showed a pronounced load dependence only for polyHEMA-2.5 samples.
The different cross-linking densities in polyHEMA-2.5 and polyHEMA-10 resulted in significant differences in the local response to the combined action of normal load and shear. Even though the tip initially sinks into the material and the hydrogel deforms to form a hill at the front side of the moving tip for both types of hydrogels, the magnitudes of these effects are very different. For instance, at a load of 10 nN, the sink-in during sliding for polyHEMA-2.5 is about 10 nm, whereas it is only 1 nm for polyHEMA-10. As the lateral deformation is increased at this load, the tip climbs 200 nm up the hill accompanied with pronounced stick-slip features for polyHEMA-2.5. In contrast, for polyHEMA-10, the upward climb by the tip is only 10 nm, and the stick-slip effect features are minuscule in comparison. No remaining plastic deformation or remaining wear scar was observed for these hydrogels. Thus, on the time scale of minutes, the nanomechanical response is predominantly elastic. In contrast, on the time scale of a fraction of seconds, the nanomechanical response is viscoelastic (as observed by hysteresis in FDCs and different surface stiffness on compression and decompression).
Conflicts of interest
There are no conflicts to declare.Acknowledgements
Gen Li acknowledges the China Scholarship Council (CSC) for financial support for PhD study at KTH. Nanxuan Mei is acknowledged for their help with ATR-IR experiments.References
- Y. Li, G. Huang, X. Zhang, B. Li, Y. Chen, T. Lu, T. J. Lu and F. Xu, Magnetic hydrogels and their potential biomedical applications, Adv. Funct. Mater., 2013, 23(6), 660–672 CrossRef CAS.
- E. Caló and V. V. Khutoryanskiy, Biomedical applications of hydrogels: A review of patents and commercial products, Eur. Polym. J., 2015, 65, 252–267 CrossRef.
- J. L. Drury and D. J. Mooney, Hydrogels for tissue engineering: scaffold design variables and applications, Biomaterials, 2003, 24(24), 4337–4351 CrossRef CAS.
- F.-X. Reichl, J. Durner, K. Kehe, J. Manhart, M. Folwaczny, N. Kleinsasser, W. Hume and R. Hickel, Toxicokinetic of HEMA in guinea pigs, J. Dent., 2002, 30(7–8), 353–358 CrossRef CAS.
- C. Karlgard, N. Wong, L. Jones and C. Moresoli, In vitro uptake and release studies of ocular pharmaceutical agents by silicon-containing and p-HEMA hydrogel contact lens materials, Int. J. Pharm., 2003, 257(1–2), 141–151 CrossRef CAS.
- C. Charitidis, Nanoscale deformation and nanomechanical properties of soft matter study cases: polydimethylsiloxane, cells and tissues, ISRN Nanotechnol., 2011, 2011, 719512 Search PubMed.
- S. R. Cohen and E. Kalfon-Cohen, Dynamic nanoindentation by instrumented nanoindentation and force microscopy: A comparative review, Beilstein J. Nanotechnol., 2013, 4(1), 815–833 CrossRef CAS.
- P. M. Claesson, I. Dobryden, G. Li, Y. He, H. Huang, P.-A. Thorén and D. B. Haviland, From force curves to surface nanomechanical properties, Phys. Chem. Chem. Phys., 2017, 19(35), 23642–23657 RSC.
- N. E. Kurland, Z. Drira and V. K. Yadavalli, Measurement of nanomechanical properties of biomolecules using atomic force microscopy, Micron, 2012, 43(2-3), 116–128 CrossRef CAS.
- D. Wang, S. Fujinami, K. Nakajima and T. Nishi, True surface topography and nanomechanical mapping measurements on block copolymers with atomic force microscopy, Macromolecules, 2010, 43(7), 3169–3172 CrossRef CAS.
- M. E. Dokukin and I. Sokolov, Quantitative mapping of the elastic modulus of soft materials with HarmoniX and PeakForce QNM AFM modes, Langmuir, 2012, 28(46), 16060–16071 CrossRef CAS.
- L. Chopinet, C. Formosa, M. Rols, R. Duval and E. Dague, Imaging living cells surface and quantifying its properties at high resolution using AFM in QI™ mode, Micron, 2013, 48, 26–33 CrossRef CAS.
- H. Huang, I. Dobryden, N. Ihrner, M. Johansson, H. Ma, J. Pan and P. M. Claesson, Temperature-dependent surface nanomechanical properties of a thermoplastic nanocomposite, J. Colloid Interface Sci., 2017, 494, 204–214 CrossRef CAS.
- T. Young, M. Monclus, T. Burnett, W. Broughton, S. Ogin and P. Smith, The use of the PeakForceTM quantitative nanomechanical mapping AFM-based method for high-resolution Young's modulus measurement of polymers, Meas. Sci. Technol., 2011, 22(12), 125703 CrossRef.
- S. Cuenot, C. Frétigny, S. Demoustier-Champagne and B. Nysten, Surface tension effect on the mechanical properties of nanomaterials measured by atomic force microscopy, Phys. Rev. B: Condens. Matter Mater. Phys., 2004, 69(16), 165410 CrossRef.
- A. Yango, J. Schäpe, C. Rianna, H. Doschke and M. Radmacher, Measuring the viscoelastic creep of soft samples by step response AFM, Soft Matter, 2016, 12(40), 8297–8306 RSC.
- R. Garcia and R. Proksch, Nanomechanical mapping of soft matter by bimodal force microscopy, Eur. Polym. J., 2013, 49(8), 1897–1906 CrossRef CAS.
- F. M. Hecht, J. Rheinlaender, N. Schierbaum, W. H. Goldmann, B. Fabry and T. E. Schäffer, Imaging viscoelastic properties of live cells by AFM: power-law rheology on the nanoscale, Soft Matter, 2015, 11(23), 4584–4591 RSC.
- C. Ganser, C. Czibula, D. Tscharnuter, T. Schöberl, C. Teichert and U. Hirn, Combining adhesive contact mechanics with a viscoelastic material model to probe local material properties by AFM, Soft Matter, 2018, 14(1), 140–150 RSC.
- J. De Sousa, J. Santos, E. Barros, L. Alencar, W. Cruz, M. Ramos and J. Mendes Filho, Analytical model of atomic-force-microscopy force curves in viscoelastic materials exhibiting power law relaxation, J. Appl. Phys., 2017, 121(3), 034901 CrossRef.
- Y. M. Efremov, W.-H. Wang, S. D. Hardy, R. L. Geahlen and A. Raman, Measuring nanoscale viscoelastic parameters of cells directly from AFM force-displacement curves, Sci. Rep., 2017, 7(1), 1541 CrossRef.
- H. Wang, J. J. Wilksch, L. Chen, J. W. Tan, R. A. Strugnell and M. L. Gee, Influence of fimbriae on bacterial adhesion and viscoelasticity and correlations of the two properties with biofilm formation, Langmuir, 2016, 33(1), 100–106 CrossRef.
- A. Opdahl, S. H. Kim, T. S. Koffas, C. Marmo and G. A. Somorjai, Surface mechanical properties of pHEMA contact lenses: viscoelastic and adhesive property changes on exposure to controlled humidity, J. Biomed. Mater. Res., Part A, 2003, 67(1), 350–356 CrossRef.
- R. Garcia and E. T. Herruzo, The emergence of multifrequency force microscopy, Nat. Nanotechnol., 2012, 7(4), 217 CrossRef CAS.
- R. Borgani, P.-A. Thorén, D. Forchheimer, I. Dobryden, S. M. Sah, P. M. Claesson and D. B. Haviland, Background-force compensation in dynamic atomic force microscopy, Phys. Rev. Appl., 2017, 7(6), 064018 CrossRef.
- H. Huang, I. Dobryden, P.-A. Thorén, L. Ejenstam, J. Pan, M. Fielden, D. B. Haviland and P. M. Claesson, Local surface mechanical properties of PDMS-silica nanocomposite probed with Intermodulation AFM, Compos. Sci. Technol., 2017, 150, 111–119 CrossRef CAS.
- F. Crippa, P.-A. Thorén, D. Forchheimer, R. Borgani, B. Rothen-Rutishauser, A. Petri-Fink and D. B. Haviland, Probing nano-scale viscoelastic response in air and in liquid with dynamic atomic force microscopy, Soft Matter, 2018, 14(19), 3998–4006 RSC.
- D. B. Haviland, Quantitative force microscopy from a dynamic point of view, Curr. Opin. Colloid Interface Sci., 2017, 27, 74–81 CrossRef CAS.
- J. K. Katta, M. Marcolongo, A. Lowman and K. A. Mansmann, Friction and wear behavior of poly(vinyl alcohol)/poly(vinyl pyrrolidone) hydrogels for articular cartilage replacement, J. Biomed. Mater. Res., Part A, 2007, 83(2), 471–479 CrossRef.
- L. Bostan, A.-M. Trunfio-Sfarghiu, L. Verestiuc, M. Popa, F. Munteanu, J.-P. Rieu and Y. Berthier, Mechanical and tribological properties of poly(hydroxyethyl methacrylate) hydrogels as articular cartilage substitutes, Tribol. Int., 2012, 46(1), 215–224 CrossRef CAS.
- V. Ngai, J. Medley, L. Jones, J. Forrest and J. Teiehroeb, Friction of contact lenses: silicone hydrogel versus conventional hydrogel, Tribology and Interface Engineering Series, Elsevier, 2005, vol. 48, pp. 371–379 Search PubMed.
- S. H. Kim, A. Opdahl, C. Marmo and G. A. Somorjai, AFM and SFG studies of pHEMA-based hydrogel contact lens surfaces in saline solution: adhesion, friction, and the presence of non-crosslinked polymer chains at the surface, Biomaterials, 2002, 23(7), 1657–1666 CrossRef CAS.
- S. Park, K. D. Costa and G. A. Ateshian, Microscale frictional response of bovine articular cartilage from atomic force microscopy, J. Biomech., 2004, 37(11), 1679–1687 CrossRef.
- W. Roorda, J. Bouwstra, M. De Vries and H. Junginger, Thermal analysis of water in p(HEMA) hydrogels, Biomaterials, 1988, 9(6), 494–499 CrossRef CAS.
- A. Guiseppi-Elie, C. Dong and C. Z. Dinu, Crosslink density of a biomimetic poly(HEMA)-based hydrogel influences growth and proliferation of attachment dependent RMS 13 cells, J. Mater. Chem., 2012, 22(37), 19529–19539 RSC.
- J. E. Sader, J. W. Chon and P. Mulvaney, Calibration of rectangular atomic force microscope cantilevers, Rev. Sci. Instrum., 1999, 70(10), 3967–3969 CrossRef CAS.
- W. C. Oliver and G. M. Pharr, Measurement of hardness and elastic modulus by instrumented indentation: Advances in understanding and refinements to methodology, J. Mater. Res., 2004, 19(1), 3–20 CrossRef CAS.
- L. Ferreira, M. Vidal and M. Gil, Evaluation of poly(2-hydroxyethyl methacrylate) gels as drug delivery systems at different pH values, Int. J. Pharm., 2000, 194(2), 169–180 CrossRef CAS.
- B. L. Mojet, S. D. Ebbesen and L. Lefferts, Light at the interface: the potential of attenuated total reflection infrared spectroscopy for understanding heterogeneous catalysis in water, Chem. Soc. Rev., 2010, 39(12), 4643–4655 RSC.
- T. J. Kashi, M. Erfan and D. Watts, Effect of water on HEMA conversion by FT-IR spectroscopy, J. Dent. Tehran Univ. Med. Sci., 2007, 4(3), 123–129 Search PubMed.
- J. P. Folley, Systematic errors in the measurement of peak area and peak height for overlapping peaks, J. Chromatogr. A, 1987, 384, 301–313 CrossRef.
- H. Li, B. Liu, X. Zhang, C. Gao, J. Shen and G. Zou, Single-molecule force spectroscopy on poly(acrylic acid) by AFM, Langmuir, 1999, 15(6), 2120–2124 CrossRef CAS.
- E. Thormann, D. R. Evans and V. S. Craig, Experimental studies of the dynamic mechanical response of a single polymer chain, Macromolecules, 2006, 39(18), 6180–6185 CrossRef CAS.
- H. R. Hertz, Uber die Beruhrung fester elastischer Korper und Uber die Harte. Verhandlung des Vereins zur Beforderung des GewerbefleiBes, Berlin, 1882, p. 449 Search PubMed.
- M. Machado, P. Moreira, P. Flores and H. M. Lankarani, Compliant contact force models in multibody dynamics: Evolution of the Hertz contact theory, Mech. Mach. Theor., 2012, 53, 99–121 CrossRef.
- B. V. Derjaguin, V. M. Muller and Y. P. Toporov, Effect of contact deformations on the adhesion of particles, J. Colloid Interface Sci., 1975, 53(2), 314–326 CrossRef CAS.
- K. L. Johnson, K. Kendall and A. Roberts, Surface energy and the contact of elastic solids, Proc. R. Soc. London, Ser. A, 1971, 324(1558), 301–313 CrossRef CAS.
- P. Menter, Acrylamide Polymerization—A Practical Approach, Bio-Rad. Tech. Note, 2000, 1156, 24 Search PubMed.
- Y. He, I. Dobryden, J. Pan, A. Ahniyaz, T. Deltin, R. W. Corkery and P. M. Claesson, Nano-scale mechanical and wear properties of a waterborne hydroxyacrylic-melamine anti-corrosion coating, Appl. Surf. Sci., 2018, 457, 548–558 CrossRef CAS.
- T. Shoaib, J. Heintz, J. A. Lopez-Berganza, R. Muro-Barrios, S. A. Egner and R. M. Espinosa-Marzal, Stick–slip friction reveals hydrogel lubrication mechanisms, Langmuir, 2017, 34(3), 756–765 CrossRef.
Footnote |
| † Electronic supplementary information (ESI) available. See DOI: 10.1039/c9sm01113g |
| This journal is © The Royal Society of Chemistry 2019 |

