 Open Access Article
Creative Commons Attribution 3.0 Unported Licence
Isotropic–isotropic phase separation and spinodal decomposition in liquid crystal–solvent mixtures†
Catherine G.
Reyes
 a,
Jörg
Baller
 a,
Takeaki
Araki
 *b and
Jan P. F.
Lagerwall
 *a
*a
aPhysics and Materials Science Research Unit, University of Luxembourg, 162a, Avenue de la Faencerie, L-1511, Luxembourg. E-mail: jan.lagerwall@lcsoftmatter.com
bDepartment of Physics, Kyoto University, Kitashirakawa-Oiwakecho, Sakyo-ku, Kyoto 606-8502, Japan. E-mail: araki.takeaki.5a@kyoto-u.ac.jp
First published on 14th June 2019
Abstract
Phase separation in mixtures forming liquid crystal (LC) phases is an important yet under-appreciated phenomenon that can drastically influence the behaviour of a multi-component LC. Here we demonstrate, using polarising microscopy with active cooling as well as differential scanning calorimetry, that the phase diagram for mixtures of the LC-forming compound 4′-n-pentylbiphenyl-4-carbonitrile (5CB) with ethanol is surprisingly complex. Binary mixtures reveal a broad miscibility gap that leads to phase separation between two distinct isotropic phases via spinodal decomposition or nucleation and growth. On further cooling the nematic phase enters on the 5CB-rich side, adding to the complexity. Significantly, water contamination dramatically raises the temperature range of the miscibility gap, bringing up the critical temperature for spinodal decomposition from ∼ 2 °C for the anhydrous case to >50 °C if just 3 vol% water is added to the ethanol. We support the experiments with a theoretical treatment that qualitatively reproduces the phase diagrams as well as the transition dynamics, with and without water. Our study highlights the impact of phase separation in LC-forming mixtures, spanning from equilibrium coexistence of multiple liquid phases to non-equilibrium effects due to persistent spatial concentration gradients.
1 Introduction
Many aspects of research in liquid crystals (LCs)—liquids of anisotropic molecules (mesogens) that spontaneously develop long-range order in molecular orientation—and essentially all commercial applications, utilise mixtures containing multiple components. Even basic consequences of this mixing, like equilibrium phase separation, are frequently overlooked. An exception is the phase separation which occurs in the context of polymer-dispersed liquid crystals (PDLCs), as it is this phenomenon that induces the heterogeneous structure characteristic of PDLCs.1 Phase separation in LC–polymer mixtures has thus been thoroughly studied, experimentally2–4 and theoretically.5–10For LC mixtures of exclusively low molar mass components the situation is different. It is not uncommon to see reports of a single clearing temperature of multicomponent mixtures such as E7, which develops the nematic LC phase (exhibiting no long-range order beyond the orientational one). This neglects the extension of the first-order nematic–isotropic transition over a significant temperature range, within which the two phases coexist in equilibrium. Even less attention is given to the fact that the compositions of the two coexisting phases can be very different, and that spatial concentration gradients induced by phase separation remain for long times. The consequences are significant, not least if functional molecules such as a chiral dopant, reactive monomer, photoinitiator or dye are part of the mixture.
When working with mixtures it is therefore generally advisable to avoid first-order transitions and the resulting phase separation. This may not be possible, however, for instance when an LC and an organic solvent are processed together during microfluidic preparation of multiple emulsions,11–16 printing of solvent-dissolved LCs,17,18 or in the formation of LC-core filled polymer fibres.11,19–22 Since the current trend in soft matter and LC research to advance flexible and responsive soft devices and composites renders such procedures popular, solvent-induced phase separation needs to be considered. In some cases, the phase separation may be helpful, as in the study of LC-based gels,23,24 and it might find technical use in applications that take advantage of the behavior of LCs with incorporated isotropic droplets.25
Here we establish the phase diagram of, arguably, the most studied mesogenic compound, 4′-n-pentylbiphenyl-4-carbonitrile (5CB), and the equally common solvent ethanol, finding a much richer phase diagram than anticipated. We identify a large miscibility gap that causes two distinct isotropic phases with different compositions to coexist. The phase separation takes place via spinodal decomposition or nucleation and growth, depending on the mixture composition. (For readers unaccustomed to these concepts, a summary is provided in the ESI.†) Significantly, a small fraction of water raises the temperature range of isotropic–isotropic phase separation by several tens of degrees. This gives the phase separation strong practical relevance since water may enter mesogen–solvent mixtures through condensation from humid air due to cooling as the solvent evaporates. We support our experimental findings with a theoretical treatment and numerical simulations that qualitatively reproduce the observed phase diagrams and the dynamics of the phase transitions, also with spatial concentration gradients.
To the best of our knowledge, this is the first combined experimental–theoretical investigation of isotropic–isotropic phase separation in LC mixtures without a polymer component. Coincidentally, while our study was on-going, Serrano et al. published the first experimental report describing phase separation in 5CB–solvent mixtures.26 The solvent in that case was methanol instead of ethanol, and the authors did not consider the effect of water added to the mixture. The Serrano et al. phase diagram was based mainly on macroscopic optical observation of samples in cuvettes and they also studied an interesting potential application in extraction of target molecules. Our work is based primarily on polarising microscopy, placing the emphasis on elucidating the phase diagrams in detail, with and without water. We pay particular attention to phenomena where the LC character plays a central role, and we also consider the important practical consequences that the phase separation-induced concentration gradients has for LC research.
2 Results and discussion
The majority of the observations discussed below occur in the supercooled regime, as the melting point of pure 5CB is 24 °C. We avoid crystallisation throughout the study and conduct all experiments on cooling from a fully homogeneous isotropic state, and on re-heating from a suitable low temperature prior to any crystallisation occurring. This is motivated by the fact that 5CB has a very strong tendency for supercooling and that this thus corresponds to practical work with the mixtures. Complementing the texture micrographs below, Supporting Movies SM1–SM8 show the dynamics of all experiments (ESI†).2.1 5CB in anhydrous ethanol
An overview of all mixture compositions investigated is provided in Table 1, together with the methods used to study each composition. Initial screening of macroscopic samples at room temperature showed that all samples with ≤75 mol% 5CB are fully isotropic, whereas the sample with 95 mol% 5CB is predominantly nematic. Isotropic–isotropic phase separation is not observed to occur at room temperature for any fraction of 5CB mixed with anhydrous ethanol. To see the separation in these mixtures, we need to cool them to lower temperatures.| Mol% 5CB | Mass% 5CB | Macro. | POM | DSCs |
|---|---|---|---|---|
| 9.9 | 37.3 | Y | Y | N |
| 14.8* | 48.5* | N | N | Y |
| 18.6 | 55.3 | N | Y | Y |
| 27.8* | 67.6* | N | N | Y |
| 29.0 | 68.9 | N | Y | N |
| 30 | 69.8 | Y | N | N |
| 40 | 78.3 | Y | N | N |
| 49.2* | 84.8* | N | Y | Y |
| 77.2* | 94.8* | N | Y | Y |
| 95 | 99.1 | Y | Y | N |
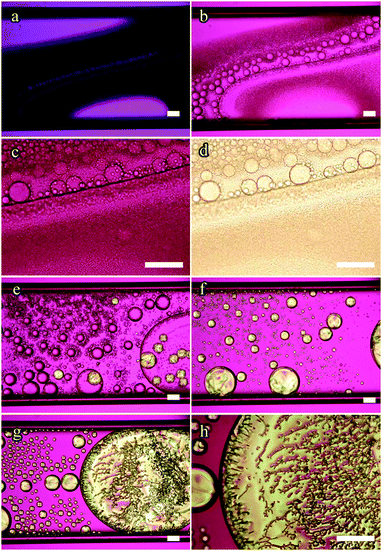 | ||
| Fig. 2 POM images of the 18.6 mol% 5CB mixture in a 100 μm thick flat capillary on cooling from the uniform isotropic phase (see also ESI† SM1). Two new phases emerge via spinodal decomposition at roughly −4.5 °C, (a). Boundaries between the original and new isotropic phases are visible through crossed polarisers with first-order λ plate (pink background), (b and c), or without polarisers, (d). The nematic phase nucleates from one of the new isotropic phases between −7.2 °C, (e), and −8.0 °C, (f). Isotropic droplets in chains nucleate below −4.8 °C, (g) in the nematic domains, and continually accumulate (−16.5 °C, h). The 20 and 29 mol% samples show the same features on cooling (see ESI†). Scale bars: 100 μm. | ||
Since the temperature control equipment is of high quality and has been calibrated, we do not believe that this discrepancy is due to experimental error. Instead, we attribute the “too low” transition temperature during POM investigation as well as the unexpected combination of spinodal decomposition and supercooled original phase to significant spatial concentration gradients that persist within the sample, following phase separation occurring prior to the POM experiments. The capillaries used for these experiments are 100 μm thick, 1 mm wide and about 3 cm long, hence the sample volume is so large that removal of concentration gradients by diffusion takes long time. This means that we have regions in the capillary with lower 5CB content than 18.6 mol% as well as regions where the 5CB content is higher. Regions with less 5CB retain a uniform isotropic phase that is stable at lower temperatures, while regions with higher 5CB content cross the spinodal curve on cooling and separate into two new isotropic phases. This situation allows significant supercooling of the original isotropic phase and explains the discrepancies from the DSC experiments, which were done using aluminum pans providing better heat conduction and less spreading-out of the sample.
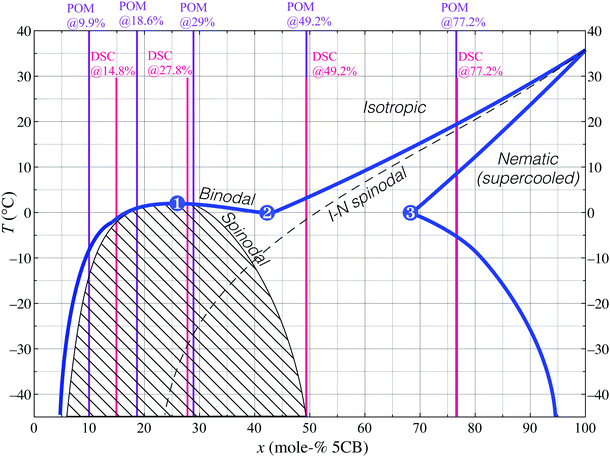
Unlike the simplicity of one nematic and one isotropic phase in coexistence at 9.9 mol% 5CB, the situation on cooling the 18.6 mol% and 29 mol% mixtures increases in complexity. First, for both mixtures one of the new isotropic phases that previously emerged begins changing into nematic at −7.2 °C. These droplets become birefringent and develop a typical nematic schlieren texture (Fig. 2e and f). Once again, the transition temperature appears too low in the POM experiments, as the minimum temperature of equilibrium isotropic phase at intermediate composition (the eutectic point, (2)) should be around 0 °C according to Fig. 1. We interpret this as a sign of the now unstable isotropic phase being supercooled to temperatures below point (2), allowed until the isotropic–nematic spinodal transition is met, here thus at −7.2 °C.
Cooling further we eventually see isotropic droplets nucleate within large domains of nematic phase (Fig. 2g and h). These tiny isotropic droplets tend to line up as chains in order to minimise distortion energy within the surrounding nematic phase.27 Small nematic domains, in contrast, simply shrink, the isotropic surrounding growing in prominence. Since the temperature is now below that of the point labeled (3) in Fig. 1, the nematic phase must continuously increase its 5CB content on cooling. Small nematic droplets achieve this easily by exchanging with their immediate isotropic surrounding, shrinking somewhat in the process. For larger nematic domains (on the order of several hundreds of microns wide) the border to the isotropic phase is too far away, hence many small isotropic droplets with greater ethanol content nucleate within the nematic domain.
It is important to realise that the isotropic phase of these tiny droplets dispersed in the nematic domains is identical in composition to the background isotropic phase, i.e., it is on the far left side of the coexistence region in the phase diagram. The spatial separation from the background isotropic phase that we observe is of purely kinetic origin, resulting from the nucleating isotropic droplets being trapped within the large nematic phase domains. If the temperature is held constant, then these isotropic droplets gradually move to the edge of the domain where they merge with the surrounding, but this can take several hours or days.
For mixtures containing fractions of 5CB in anhydrous ethanol of about 50 mol% (ESI† SM5) or greater—thus the right half of the phase diagram in Fig. 1, encompassing the ordinary nematic–isotropic phase separation—the nematic phase nucleates directly from the uniform isotropic phase (Fig. 3). In the phase diagram we are now to the right of the eutectic point of the isotropic phase with intermediate composition, hence the two-phase region we encounter on cooling is not between two new isotropic phases, but between the original isotropic phase and the nematic phase.
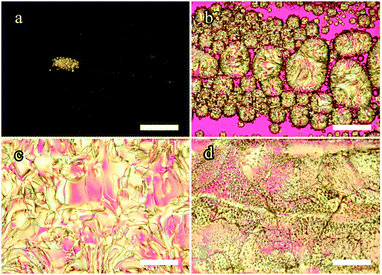 | ||
| Fig. 3 POM images of the 49.2 mol% 5CB mixture in a 100 μm thick flat capillary on cooling from uniform isotropic phase, with nematic phase entering just below 0 °C (see also ESI† SM5). Image (a) was taken at −0.7 °C. The nematic phase grows in prominence when cooled to −4.8 °C, (b). At −5.5 °C, (c), the nematic phase fills the capillary almost entirely. If the sample is cooled to −7.8 °C the 5CB content of the nematic phase increases and chains of small isotropic droplets nucleate, (d). Qualitatively, the 77.2 mol% sample exhibits similar features (see ESI† for details). Pink background is due to a first-order λ plate inserted. Scale bars: 100 μm. | ||
For the mixture containing 77.2 mol% 5CB (ESI† SM6), the nematic phase nucleates from the uniform isotropic phase at roughly 16 °C. As this mixture has more 5CB than the composition at point 3 in the phase diagram, the cooling experiment crosses the range in which the nematic is the sole thermodynamically stable phase. According to Fig. 1 this range should start at about 8 °C, yet a minority isotropic phase still remains until 5 °C where the full sample becomes nematic. We attribute this to the concentration gradients that built up during prior cooling experiments, and non-equilibrium phenomena while these are slowly evened out. For the same reason, it is not until about −11 °C that we see the first isotropic droplets nucleate within the nematic phase. The lower boundary of the stable nematic phase range in Fig. 1 for this mixture is higher, about −5 °C, as established by DSC.
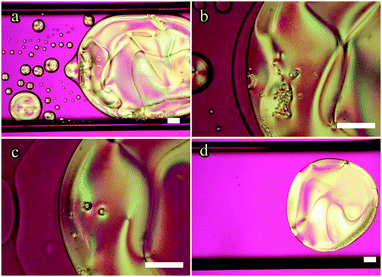 | ||
| Fig. 4 POM images of the 18.6 mol% 5CB mixture in a 100 μm thick flat capillary on heating. Between roughly −6.3 °C and −7.0 °C, (a and b), the isotropic droplets within the nematic domains disappear and a new isotropic phase begins replacing the small nematic droplets as well as making a boundary around the large nematic domains. At −0.7 °C the two isotropic domains merge, (c), leaving the remaining nematic domains to clear last, (d). Qualitatively, the 29 mol% sample exhibits the same features on heating (see ESI† for details). Pink background is due to a first-order λ plate inserted. Scale bars: 100 μm. | ||
However, as is frequently observed during the POM investigations, there is again a considerable transition temperature difference compared to the results seen from the DSC experiments. We consider this another piece of evidence of the impact of the local concentration gradients established by the phase separation at low temperatures. These non-equilibrium phenomena mean that it is very challenging to draw quantitative conclusions regarding transition temperatures from experiments on mixtures in large-scale samples such as capillaries.
As we heat further, the composition of the new isotropic phase rapidly decreases its 5CB content, moving along the boundary from (2) to (1) in Fig. 1. Since the overall mixture composition has only 18.6 mol% 5CB, according to the phase diagram, we ought to only have the two isotropic phases coexisting during this process. Indeed, this is what we saw earlier when cooling at these temperatures. However, as is shown in Fig. 4c and d, it is not the case on heating, where nematic phase remains past the temperature where the two isotropic phases coalesce to one uniform isotropic phase. The fact that on heating we see a persistent nematic phase even up to +10 °C is yet another strong indication of the significant concentration gradients occurring within the capillary sample. Some regimes clearly have a much higher 5CB content than the overall 18.6 mol% for a long time. The isotropic–isotropic phase coexistence disappears slightly above 0 °C (Fig. 4c), as the temperature is now in the uniform isotropic phase range for a large composition range, apparently spanning the gradients existing within the sample. Similar observations were made for the 29 mol% 5CB mixture (see ESI† for details).
Notably, the mixtures containing 49.2 mol% and 77.2 mol% do not show phases coexisting longer than they should upon heating, like the 18.6 mol% and 29 mol% mixtures do. Since there is no isotropic–isotropic coexistence to begin with, the nematic phase, once all the isotropic droplets have disappeared, and as expected from Fig. 1, clears uniformly to a single isotropic phase.
Of key importance for understanding the origin of the persistent concentration gradients is the very large width of the miscibility gap: below −10 °C the nematic phase has more than 80 mol% 5CB while the isotropic has less than 10 mol% 5CB, regardless of what the overall sample composition is. If the samples would have been kept for several days at a temperature where the full sample is isotropic, possibly the concentration gradients would have been evened out and a behaviour more in line with the phase diagram (and with the DSC experiments) would have been observed in the POM investigation of the capillary.
2.2 The effect of water impurity: 5CB in aqueous ethanol
While bottles of spectroscopic grade anhydrous ethanol having a purity of ≥99.8% can be purchased from many distributors, it is not uncommon to work with 95–97% ethanol, where the dominant impurity is typically water. It is thus of interest to investigate whether the phase diagram in Fig. 1 changes significantly if the ethanol is contaminated with a small fraction of water. For this reason, we also examine several mixtures of 5CB mixed with a solvent (referred to as “aqueous ethanol” from this point on) consisting of 96 mass% anhydrous ethanol and 4 mass% deionized water, corresponding to roughly 97 and 3 vol%, respectively. An overview of these mixture compositions, with the methods used to study each, is shown in Table 2. We prepare a bulk mixture of this aqueous ethanol rather than using commercial 97 vol% ethanol, so as to avoid the influence of other unknown impurities (such as methanol or benzene) on the phase diagram.| Mol% 5CB | Mass% 5CB | Macro. | POM | DSC |
|---|---|---|---|---|
| 9.6 | 38 | Y | N | N |
| 11 | 41 | N | N | Y |
| 21 | 60 | Y | Y | N |
| 32 | 73 | N | N | Y |
| 51 | 86 | Y | N | N |
| 74 | 94 | N | N | Y |
| 77 | 95 | Y | Y | N |
| 85 | 97 | Y | Y | N |
While all mixtures listed in Table 2 examined using the POM and temperature control stage qualitatively show the same phase behaviour as the mixtures containing only 5CB and anhydrous ethanol, a crucial difference concerns the onset temperatures for isotropic–isotropic phase separation. In contrast to the mixtures discussed in Section 2.1.1, mixtures using aqueous ethanol with a 5CB content in the range 10–20 mol% show macroscopically visible separation between immiscible isotropic phases at room temperature, as shown in Fig. 5. The photos show three mixtures containing 9.6 mol%, 21 mol% and 51 mol% 5CB, respectively, in aqueous ethanol, observed close to room temperature (∼23 °C). The figure demonstrates that increasing the fraction of 5CB has the effect of raising the isotropic–isotropic phase separation line towards the concave meniscus line until a critical concentration of 5CB is met (based on the approximate phase diagram in Fig. 6, about 43 mol%). At 51 mol% 5CB only one isotropic phase is stable at room temperature, as evidenced through a macroscopically uniform transparent liquid with no line below the meniscus to the air. Aqueous ethanol mixtures containing 77 mol% and 85 mol% 5CB follow the same trend, appearing uniformly isotropic at room temperature as well.
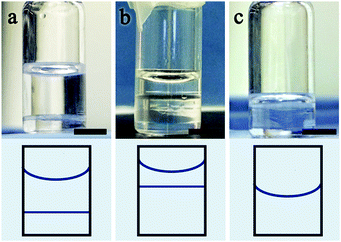 | ||
| Fig. 5 Macroscopic photographs at room temperature of three mixtures of 5CB with ethanol to which 3 vol% water was added. Isotropic–isotropic phase separation is seen in the first two vials, with 9.6 mol% 5CB (a), and 21 mol% 5CB (b), respectively. The third vial, containing a 51 mol% 5CB mixture, has a single isotropic phase. Sketches showing the change in the isotropic–isotropic separation line relative to the meniscus with air qualitatively reflect the phase diagram in Fig. 6 as the composition of 5CB moves from the left side (lower 5CB fraction) to the right side (higher 5CB fraction). Scale bars: 0.5 cm. | ||
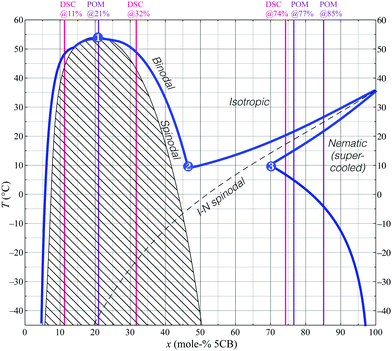 | ||
| Fig. 6 Slice of the ternary experimental phase diagram for the 5CB–ethanol–water system; 3 vol% water is added to anhydrous ethanol to create a 97 vol% ethanol–water mixture for mixing with 5CB. The same three points of interest as in Fig. 1 have been highlighted, and DSC and POM measurement compositions are indicated in the same way. | ||
When observed in capillaries through the POM with a λ plate inserted, the mixtures with 9.6 mol% and 21 mol% 5CB show several boundary lines confirming the separation of two isotropic liquid phases (ESI† SM7), even after heating to above the clearing temperature of pure 5CB (35 °C). In fact, it is only after the capillary samples are heated to roughly 45 °C that the coexisting isotropic phases merge to a single phase.
What does the introduction of water mean for the phase diagram between 5CB and ethanol? For simplicity, in addition to not varying the pressure of the 5CB–ethanol–water system, we do not vary the fraction of water added to the mixtures. Thus, while our revised phase diagram shown in Fig. 6 only demonstrates a slice of the full ternary diagram, it is enough to conclude that adding at least 3 vol% of water to the ethanol dramatically increases the temperature at which the coexisting isotropic phases are stable, to the left of the eutectic point initially seen in Fig. 1. This is confirmed by POM and DSC investigations of selected mixtures, complementing the macroscopic observations in Fig. 5. DSC traces on cooling mixtures of the same composition as in Fig. 5(a) and (b) clearly reveal a highly reproducible peak at 44 °C (see ESI†) that signifies the isotropic–isotropic phase separation, most likely by spinodal decomposition. The transition to a nematic phase is also raised compared to the corresponding mixtures with anhydrous ethanol, two partially overlapping peaks repeatedly being detected at 9 °C and 7 °C, respectively. We attribute these peaks to the passing of the eutectic point (2) and the isotropic–nematic spinodal, respectively. The DSC measurements conform well with the heating and cooling observations made at the POM using capillaries containing similar mixture compositions.
As for the mixture in Fig. 5(c), containing 51 mol% 5CB, the DSC traces indicate that an isotropic–nematic transition occurs between 14 °C and ∼9 °C on cooling. This is in rather good agreement with the nucleation of nematic seen through the POM for the 51 mol% aqueous ethanol mixture from ∼6 °C. The significant difference in the DSC traces for this mixture compared to the two mixtures with less 5CB indicates that this mixture has a composition to the right of the eutectic point (2), whereas the former ones are both to the left of that point.
Considering that the critical temperature of spinodal decomposition is far below room temperature for the mixture with anhydrous ethanol, it is interesting to note that the critical temperature for isotropic–isotropic phase separation reported by Serrano et al. for 5CB–methanol mixtures was located at about 25 °C.26 As methanol has a boiling point about 14 °C lower than ethanol, it is not obvious why the temperature of phase separation would be much higher with methanol as solvent than with ethanol. While Serrano et al. used HPLC grade methanol, thus taking care not to introduce any water deliberately, the low boiling point of methanol may perhaps have led to some evaporation-induced cooling and water condensation from the air28 during sample preparation, thus bringing a small amount of water into the mixtures inadvertently. Considering the strong effects of water in the ethanol–5CB system seen by comparing Fig. 1 and 6, this might be a means of reconciling the large differences in temperature ranges between our study and that of Serrano et al.
2.3 Theory and simulations
 | (1) |
 | (2) |
 | (3) |
Knowing f, we obtain the (rescaled) entropy from the translational and rotational degrees of freedom of mesogens as:
 | (4) |
![[scr S, script letter S]](https://www.rsc.org/images/entities/char_e532.gif) meso as a functional of ϕ and qij as,
meso as a functional of ϕ and qij as, | (5) |
![[scr S, script letter S]](https://www.rsc.org/images/entities/char_e532.gif) is given by
is given by | (6) |
The second term of the right hand side in eqn (6) represents the translational entropy of the solvent molecule, whose volume is ν′.
The energy ![[scr E, script letter E]](https://www.rsc.org/images/entities/char_e140.gif) is also given by a functional of ϕ and qij as
is also given by a functional of ϕ and qij as
 | (7) |
The free energy is given by
![[scr F, script letter F]](https://www.rsc.org/images/entities/char_e141.gif) = = ![[scr E, script letter E]](https://www.rsc.org/images/entities/char_e140.gif) − T − T![[scr S, script letter S]](https://www.rsc.org/images/entities/char_e532.gif) . . | (8) |
The concentration field and the nematic order parameter are determined to minimise ![[scr F, script letter F]](https://www.rsc.org/images/entities/char_e141.gif) at each temperature T. We note that ϕ is a conserved variable, while qij is not. When two phases (1 and 2) coexist, their concentrations and nematic order parameters are determined by the following conditions.
at each temperature T. We note that ϕ is a conserved variable, while qij is not. When two phases (1 and 2) coexist, their concentrations and nematic order parameters are determined by the following conditions.
 | (9) |
 | (10) |
In a pure mesogenic system (ϕ = 1), this free energy is consistent with the Landau-de Gennes free energy. Thus, the isotropic–nematic transition temperature T0IN is given by
 | (11) |
If the concentration is homogeneous, the isotropic–nematic transition temperature is given by a function of ϕ as,
| TIN(ϕ) = T0INϕ. | (12) |
When the nematic order is zero, on the other hand, eqn (8) reproduces the Flory–Huggins type free energy, describing the isotropic–isotropic phase separation. Its critical point is given by
 | (13) |
 | (14) |
Also, the spinodal temperature Tsp for the isotropic–isotropic phase separation is given as a function of ϕ by
 | (15) |
In our model, only two parameters (J and ν/ν′) determine the shape of the phase diagram. In other words, we can obtain the phase diagram if we know the critical point (ϕc,Tc).
Fig. 7 shows a typical phase diagram of a binary mixture containing the mesogenic component. It is obtained solving eqn (9) and (10) numerically. Here we set Tc/T0IN = 0.8 and ϕc = 0.39 (J/T0IN = 1.06 and ν/ν′ = 2.5) (black curves). Note that, in order to improve the comparison with the experimentally established phase diagrams, the horizontal axis represents the molar fraction φ = (ϕ/ν)/[ϕ/ν + (1 − ϕ)ν′], not the volume fraction ϕ.
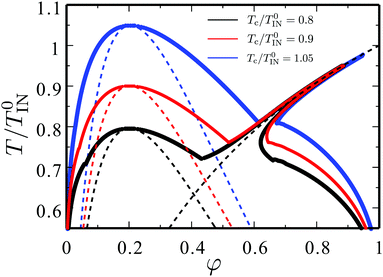 | ||
| Fig. 7 Theoretical phase diagram for the LC–solvent mixtures. The horizontal axis represents the molar fraction φ = (ϕ/ν)/[ϕ/ν + (1 − ϕ)ν′] of the mesogenic compound. The critical point for the isotropic–isotropic phase separation is tuned between the three curves: Tc/T0IN = 0.8 (black), Tc/T0IN = 0.9 (red) and Tc/T0IN = 1.05 (blue), respectively. The spinodal curve for the isotropic–isotropic phase separation (eqn (15)) is shown for all cases, and the isotropic–nematic transition temperature without prior phase separation (eqn (12)) is shown for Tc/T0IN = 0.8. | ||
The calculated phase diagram is similar with the experimental results. Around ϕ ≈ ϕc, the coexistence of the two isotropic liquids can be observed. This isotropic–isotropic coexistence is due to the isotropic part J of the interaction energy between the two components. When the average concentration is large enough, on the other hand, an isotropic phase coexists with a nematic phase. The latter coexistence is realised by the nematic ordering. In Fig. 7, we also explore changing Tc with fixing ϕcTc/T0IN = 0.9 (red curves) and Tc/T0IN = 1.05 (blue curves). The phase diagram can be tuned with these two parameters.
 | (16) |
 | (17) |
![[scr F, script letter F]](https://www.rsc.org/images/entities/char_e141.gif) /δϕ and Hij = −[δ
/δϕ and Hij = −[δ![[scr F, script letter F]](https://www.rsc.org/images/entities/char_e141.gif) /δQij − (δ
/δQij − (δ![[scr F, script letter F]](https://www.rsc.org/images/entities/char_e141.gif) /δQkl)δklδij/3] is the molecular field. The parameters κsij and κaij are the symmetric and asymmetric parts of the velocity gradient tensor ∇ivj, respectively, and D and γ are the diffusion constant and the rotational viscosity of the mesogenic component, respectively. Finally, β is the so-called flow-alignment parameter and θ and ξij represent the thermal noises for ϕ and Qij, respectively.7,37 We ignore the off-diagonal kinetic coefficients for simplicity in this study.
/δQkl)δklδij/3] is the molecular field. The parameters κsij and κaij are the symmetric and asymmetric parts of the velocity gradient tensor ∇ivj, respectively, and D and γ are the diffusion constant and the rotational viscosity of the mesogenic component, respectively. Finally, β is the so-called flow-alignment parameter and θ and ξij represent the thermal noises for ϕ and Qij, respectively.7,37 We ignore the off-diagonal kinetic coefficients for simplicity in this study.
The hydrodynamic equation is given by,
| −ϕ∇iμ + ∇j(QikHkj − HikQkj) + Qjk∇iHkj − β∇jHij − ∇ip + η∇2v = 0 | (18) |
We numerically solve eqn (16)–(18) with explicit Euler schemes and MAC method.7,33 The space and time are scaled by d(≡v1/3) and t0(≡d2/D). The time increment is Δt = 0.005t0. We set γ = η = 0.2T/(Dd) and β = 0.1 in this work. The simulations are carried out in a two dimensional lattice (1024 × 256) with periodic boundary condition.
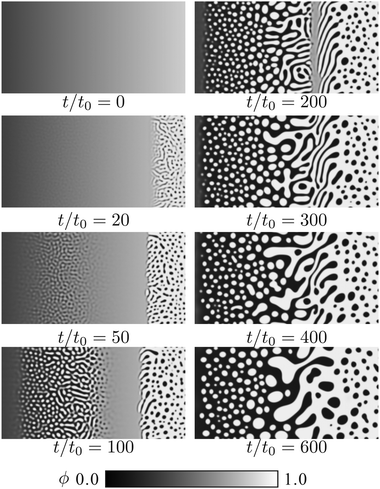 | ||
| Fig. 8 Simulated pattern evolution of the concentration field ϕ during the phase separation under a concentration gradient. The mesogen–solvent mixture corresponds to the black curve in Fig. 7 (Tc/T0IN = 0.8). The quenched temperature is T/T0IN = 0.65. | ||
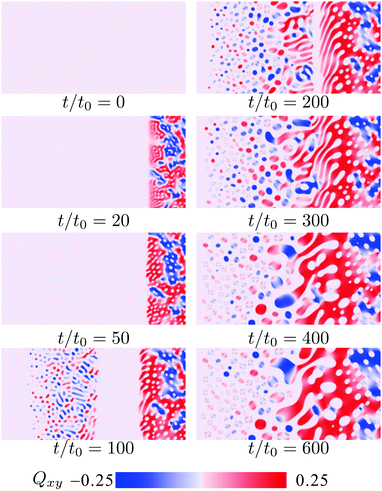 | ||
| Fig. 9 Simulated pattern evolution of the xy-component of the nematic order parameter Qxy during phase separation under a concentration gradient. The mixture is the same as in Fig. 8. | ||
It is shown that the phase separation occurs heterogeneously, and a variety of domain patterns are observed. At t = 0, we quench the system to Tc/T0IN = 0.65. After the quenching, interestingly, phase separation starts around mesogen-rich and mesogen-poor regions. In contrast to the situation without initial concentration gradient, phase separation proceeds slowly around ϕ = 0.5. This behavior reflects the distance between the quenched temperature and the phase separation temperature at each concentration. In the mesogen-rich region, the isotropic–nematic transition occurs prior to the phase separation. This nematic ordering induces the nucleation of mesogen-poor domains. We can see a sharp boundary between the phase separated and mixed regions.
On the other hand, the isotropic–isotropic spinodal decomposition occurs in the mesogen-poor region. In a usual phase separation, the isotropic–isotropic spinodal decomposition leads to a bicontinuous pattern. In this mixture, however, the mesogen-rich domains are formed after the spinodal decomposition, since the phase diagram is asymmetric due to the value of v/v(>1). After the isotropic–isotropic phase separation, the nematic ordering occurs in the mesogen-rich droplets. As a result, mesogen-rich and mesogen-poor domains are observed simultaneously in the system.
As noted above, the phase separation proceeds slowly around the symmetric concentration. Here bicontinuous patterns are formed. It is known that the bicontinuous domain pattern grows with time more quickly than the droplets pattern, because the hydrodynamic flow enhances the domain growth.39,40 In the late stage, the domain patterns around the symmetric region can be larger than those around the asymmetric regions.
 | (19) |
Also, the isotropic part of the interaction energy (the first term in the right hand side of eqn (7)) is replaced by
| Jϕ(1 − ϕ) → JAϕϕA + JBϕϕB + JABϕAϕB, | (20) |
It is known that the behaviours in the ternary mixture are quite complex, even if all the phases are isotropic. If the affinity between the two solvents is sufficiently good, the ternary mixture can be treated as a pseudo-binary mixture, in which the two solvents behave as a mixed solvent. By expressing ϕA and ϕB as ϕA = (1 − ϕ)(1 − ψ) and ϕB = (1 − ϕ)ψ, a single liquid approximation41,42 leads to an effective interaction energy
| Jeff = JA + (JB − JA)ψ + JABψ(1 − ψ), | (21) |
Although we have not calculated the exact phase diagram of the ternary mixture, we can understand why a small amount of the third liquid (i.e. water in the experiments) changes the phase diagram so drastically. In the experiments, we have not confirmed stable coexistence of three phases, so ethanol and water behave as a co-solvent for 5CB. It is considered that water is a poorer solvent for 5CB in comparison with ethanol (Jwater > Jethanol). Thus, the addition of water enlarges the effective interaction Jeff and the mixed solvent becomes poorer for 5CB. As shown in Fig. 7, even a small increase in J will lead to a large shift in the phase diagram. When we use JA/T0IN = 1.06, JB/T0IN = 2.46 and JAB = 0, the black, red and blue curves correspond to Ψ = 0, 0.1 and 0.25, respectively.
3 Conclusions and outlook
Our detailed experimental and theoretical investigation of mixtures containing 5CB and ethanol, with and without a small amount of water added, underscores just how complex LC phase diagrams can be when more than one component is involved. Considering the enormous amounts of published reports utilising 5CB as mesogen, and the ubiquitous use of ethanol as organic solvent, it is surprising that the isotropic–isotropic phase separation has not previously been reported for this mixture combination. This is likely due to the low temperature range in which the phenomenon occurs for the binary mixture, requiring cooling to well below room temperature. Because the nematic phase eventually develops at yet lower temperature, the resulting phase diagram is richer than most studied systems exhibiting liquid–liquid phase separation via spinodal decomposition. This may stimulate future investigations, for instance focusing on the role of the elastic energy of nematic nuclei in delaying phase transitions.The dramatic increase in temperature range of the isotropic–isotropic miscibility gap as a small amount of water is added is remarkable. As only a slice of the ternary 5CB–ethanol–water phase diagram was presented here, there is much room for future studies providing a more complete picture. Our theoretical treatment provides a first attempt at explaining the sensitivity to the co-solvent as a result of the different affinity for the solute. We anticipate to find similar complexities occurring also for other solvent combinations. Possibly, a suitable way forward for handling the large parameter space when multiple solvents and mesogens are considered, may be to combine experimental data with predictive or machine learning algorithms to establish approximate phase diagrams for a variety of relevant LC–solvent compositions.
The discovery that water has such strong impact also has practical implications, since the phase separation with just 3 vol% water occurs at and even well above room temperature. Diluted ethanol or ethanol with a few percent of undeclared contaminants is commonly employed as solvent by experimentalists from various fields. Even if anhydrous solvents are utilised when preparing solutions, exposure to humid air will rapidly lead to water entering the solution, as a result of condensation due to ethanol evaporation-induced cooling.28 Therefore, anomalies or difficulties encountered when attempting to mix polymer solutions or solvent mixtures with LCs may be the consequence of coexisting phases forming in solutions without researchers realising.
A particularly interesting case to further investigate is that of coaxial fibres with 5CB core produced by electrospinning from a single solution of 5CB, polymer and different types of alcohol solvents.20,21 While the outcome has been explained as a result of in situ phase separation, the reason for this has not been fully elucidated. If the origin is the miscibility gap of 5CB and alcohol solvents, then this may explain why recent attempts to produce liquid crystal elastomer core–polymer sheath fibres using reactive mesogens with a chemical structure distinctly different from 5CB (the mesogen contained no cyano group) failed to produce a continuous core that could be separated from the supporting sheath.44 There are thus good reasons to establish phase diagrams also of other mesogens in different solvents, possibly also with co-solvents present. The phase separation phenomenon does not require that the mesogen itself is mixed with the solvent, but it may occur due to contact with polymer solutions, for instance during coaxial electrospinning.19,45,46
Finally, another interesting challenge lies in identifying the ideal techniques for investigating these issues experimentally. While our study provides ample visible evidence of the various phase separation and phase transition phenomena, the frequent difficulties to reconcile transition temperatures with those detected in DSC investigations—in some cases with repeatability problems even in DSC—highlights the severe impact that spatial concentration gradients induced by the phase separation has on experiments. One approach to minimise these effects may be to strongly compartmentalise samples used for POM investigations or to include magnetic microparticles that can be used to mechanically stir the mixture within the test cell using an external magnetic field. We can conclude from our study that standard LC test cells with sample extensions on the order of centimetres otherwise do not allow homogenisation of the mixture even after days of annealing in case of prior phase separation. This situation should be considered for any experiments on LC mixtures in such test cells, as a first-order transition such as melting or clearing will lead to concentration gradients, which may or may not be significant depending on the phase diagram.
4 Experimental
Sample preparation procedures are described in detail in the ESI.†4.1 Materials
5CB was acquired from two sources: Synthon Chemicals GmbH Co. and Yantai Xianhua Chem-Tech. Co. Ltd. The pure compound from both companies share a similar nematic to isotropic clearing point between 35.7 °C and 35.8 °C. Anhydrous ethanol was purchased from Merck KGaA (“ethanol for molecular biology”, purity ≥99.8 vol% by GC, item #: 1.08543.0250). A 40 mL aliquot was stored under molecular sieves (size 4 Å, VWR Chemicals), which had been dried in an oven overnight at 70 °C before use. The aqueous ethanol mixture was based on this anhydrous ethanol, adding 4 mass% deionised water (conductivity: ∼0.055 μS).4.2 POM investigation procedure
Mixtures were filled into square cross section glass capillaries (CM Scientific Ltd) for POM examination, one at a time. The capillaries were placed in a Linkam TMS120E temperature control stage with Peltier cooling, regulated by a Linkam T95PE controller. The stage was mounted onto an Olympus BX51 microscope equipped with a Canon EOS 760D digital camera for video capture (1920 × 1080 resolution, 25 frames per second). The samples were observed in transmission between crossed polarisers, with and without a first-order λ (530 nm) plate inserted, as well as without polarisers, using 4× to 20× objectives.4.3 DSC measurements
Calorimetric measurements were performed with a DSC823e from Mettler-Toledo. The calibration of temperature and heat flow was done with indium and water. The masses of the samples examined by calorimetry ranged between 4 and 8 mg. Samples were filled into aluminum pans closed with a lid (volume: 40 μL; weight: about 50 mg). Tightness of crucibles was checked by weighing before and after the DSC measurements.Conflicts of interest
There are no conflicts of interest to declare.Acknowledgements
We are grateful to Dr C. Schütz for suggesting that we repeat our initial experiments conducted with lab-grade 96 vol% ethanol (leading to our discovery of the coexisting isotropic phases at room temperature) using anhydrous ethanol, to assess the impact of water. We also thank O. Astasheva for help with the DSC experiments. Financial support from the European Research Council under the European Union's Seventh Framework Programme (FP/2007-2013)/ERC Grant Agreement no. 648763 (consolidator project INTERACT) is gratefully acknowledged. T. A. acknowledges the support from JSPS KAKENHI Grants no. JP17K05612, and JST CREST Grant no. JPMJCR1424, Japan.References
- P. S. Drzaic, Liquid crystal dispersions, World Scientific, Singapore, 1995 Search PubMed.
- K. R. Amundson and M. Srinivasarao, Phys. Rev. E: Stat. Phys., Plasmas, Fluids, Relat. Interdiscip. Top., 1998, 58, R1211 CrossRef CAS.
- J. W. Doane, N. A. Vaz, B.-G. Wu and S. Zumer, Appl. Phys. Lett., 1986, 48, 269–271 CrossRef CAS.
- P. S. Drzaic, Liq. Cryst., 1988, 3, 1543–1559 CrossRef CAS.
- Y. Lansac, F. Fried and P. Maïssa, Liq. Cryst., 1995, 18, 829–837 CrossRef CAS.
- H. Tanaka and T. Araki, Chem. Eng. Sci., 2006, 61, 2108–2141 CrossRef CAS.
- T. Araki and H. Tanaka, Phys. Rev. Lett., 2004, 93, 015702 CrossRef.
- H. Nakazawa, S. Fujinami, M. Motoyama, T. Ohta, T. Araki and H. Tanaka, Mol. Cryst. Liq. Cryst., 2001, 366, 871–878 CrossRef CAS.
- H. Nakazawa, S. Fujinami, M. Motoyama, T. Ohta, T. Araki, H. Tanaka, T. Fujisawa, H. Nakada, M. Hayashi and M. Aizawa, Comput. Theor. Polym. Sci., 2001, 11, 445–458 CrossRef CAS.
- P. Palffy-muhoray, J. J. De Bruyn and D. A. Dunmur, Mol. Cryst. Liq. Cryst., 1985, 127, 301–319 CrossRef CAS.
- M. Urbanski, C. G. Reyes, J. Noh, A. Sharma, Y. Geng, V. S. R. Jampani and J. P. F. Lagerwall, J. Phys.: Condens. Matter, 2017, 29, 133003 CrossRef PubMed.
- J. Noh, V. S. R. Jampani, O. Haba, K. Yonetake, H. Takezoe and J. P. F. Lagerwall, J. Mol. Liq., 2018, 267, 197–204 CrossRef CAS.
- V. S. R. Jampani, D. J. Mulder, K. R. De Sousa, A.-H. Gélébart, J. P. F. Lagerwall and A. P. H. J. Schenning, Adv. Funct. Mater., 2018, 28, 1801209 CrossRef.
- J.-G. Kim and S.-Y. Park, Adv. Opt. Mater., 2017, 5, 1700243 CrossRef.
- S. Lee, H. Seo, Y. Kim and S. Kim, Adv. Mater., 2017, 29, 1606894 CrossRef PubMed.
- J. Kang, S. Kim, A. Fernandez-Nieves and E. Reichmanis, J. Am. Chem. Soc., 2017, 139, 5708–5711 CrossRef CAS PubMed.
- J. D. Davies, D. R. Vaccaro, A. M. Morris, S. N. Herzer, A. P. H. J. Schenning and C. W. M. Bastiaansen, Adv. Funct. Mater., 2013, 23, 2723–2727 CrossRef.
- C. L. van Oosten, C. W. M. Bastiaansen and D. J. Broer, Nat. Mater., 2009, 8, 677–682 CrossRef CAS PubMed.
- C. G. Reyes, A. Sharma and J. P. F. Lagerwall, Liq. Cryst., 2016, 43, 1986–2001 CrossRef CAS.
- E. A. Buyuktanir, M. W. Frey and J. L. West, Polymer, 2010, 51, 4823–4830 CrossRef CAS.
- J. Wang, A. Jákli and J. West, ChemPhysChem, 2016, 17, 3080–3085 CrossRef CAS PubMed.
- J. Wang, A. Jákli and J. West, ChemPhysChem, 2015, 16, 1839–1841 CrossRef CAS PubMed.
- V. Anderson, E. M. Terentjev, S. P. Meeker, J. Crain and W. C. K. Poon, Eur. Phys. J. E: Soft Matter Biol. Phys., 2001, 4, 11–20 CrossRef CAS.
- T. Wood, J. Lintuvuori, A. Schofield, D. Marenduzzo and W. Poon, Science, 2011, 333, 79–83 CrossRef PubMed.
- Y. Kim, X. Wang, P. Mondkar, E. Bukusoglu and N. Abbott, Nature, 2018, 557, 539–544 CrossRef CAS PubMed.
- L. Serrano, M. Fornerod, Y. Yang, S. Gaisford, F. Stellacci and S. Guldin, Soft Matter, 2018, 14, 4615–4620 RSC.
- P. Poulin, H. Stark, T. C. Lubensky and D. A. Weitz, Science, 1997, 275, 1770–1773 CrossRef CAS PubMed.
- C. Law, T. Xiong and C. Wang, Int. J. Heat Mass Transfer, 1987, 30, 1435–1443 CrossRef CAS.
- S. Yabunaka and T. Araki, Phys. Rev. E: Stat., Nonlinear, Soft Matter Phys., 2011, 83, 061711 CrossRef PubMed.
- A. J. Liu and G. Fredrickson, Macromolecules, 1993, 26, 2817 CrossRef CAS.
- C. Schen and T. Kyu, J. Chem. Phys., 1995, 102, 556 CrossRef.
- M. Doi, T. Shimada and K. Okano, J. Chem. Phys., 1988, 88, 4070 CrossRef CAS.
- T. Araki and H. Tanaka, J. Phys.: Condens. Matter, 2006, 18, L305 CrossRef CAS.
- J.-I. Fukuda, Phys. Rev. E: Stat., Nonlinear, Soft Matter Phys., 1999, 59, 3275 CrossRef CAS.
- A. Matsuyama, R. Evans and M. Cates, Phys. Rev. E: Stat., Nonlinear, Soft Matter Phys., 2000, 61, 2977 CrossRef CAS.
- A. Lapena, C. Gloctzer, S. Langer and A. J. Liu, Phys. Rev. E: Stat., Nonlinear, Soft Matter Phys., 1999, 60, R29 CrossRef CAS.
- P. Olmsted and P. Goldbart, Phys. Rev. A: At., Mol., Opt. Phys., 1990, 41, 4578 CrossRef.
- A. Lacasta, J. Sancho and C. Yeung, EPL, 1994, 27, 291 CrossRef CAS.
- E. D. Siggia, Phys. Rev. A: At., Mol., Opt. Phys., 1979, 20, 595 CrossRef CAS.
- A. Onuki, Phase transition dynamics, Cambridge University Press, 2002 Search PubMed.
- R. L. Scott, J. Chem. Phys., 1948, 17, 268 CrossRef.
- J. A. Gonzalez-Leon and A. M. Mayes, Macromolecules, 2003, 36, 2508–2515 CrossRef CAS.
- Y. Uematsu and T. Araki, J. Chem. Phys., 2012, 137, 024902 CrossRef PubMed.
- A. Sharma and J. P. F. Lagerwall, Materials, 2018, 11, 393 CrossRef PubMed.
- J. Lin, C. Chen, L. Chen, Y. Chuang, S. Huang and C. Lee, Opt. Express, 2016, 24, 3112–3126 CrossRef CAS PubMed.
- Y. Kye, C. Kim and J. Lagerwall, J. Mater. Chem. C, 2015, 3, 8979–8985 RSC.
Footnote |
| † Electronic supplementary information (ESI) available: DSC data and analysis for 5CB–anhydrous ethanol and 5CB–aqueous ethanol mixtures, detailed heating and cooling analysis and fast-forwarded POM movies of significant 5CB–ethanol mixtures. See DOI: 10.1039/c9sm00921c |
| This journal is © The Royal Society of Chemistry 2019 |

