 Open Access Article
Collective dynamics in a monolayer of squirmers confined to a boundary by gravity†
Jan-Timm
Kuhr
 *,
Felix
Rühle
 and
Holger
Stark
 *
*
Institut für Theoretische Physik, Technische Universität Berlin, Hardenbergstr. 36, 10623 Berlin, Germany. E-mail: jan-timm.kuhr@tu-berlin.de; holger.stark@tu-berlin.de
First published on 21st June 2019
Abstract
We present a hydrodynamic study of a monolayer of squirmer model microswimmers confined to a boundary by strong gravity using the simulation method of multi-particle collision dynamics. The squirmers interact with each other via their self-generated hydrodynamic flow fields and thereby form a variety of fascinating dynamic states when density and squirmer type are varied. Weak pushers, neutral squirmers, and pullers have an upright orientation. With their flow fields they push neighbors away and thereby form a hydrodynamic Wigner fluid at lower densities. Furthermore, states of fluctuating chains and trimers, of kissing, and at large densities a global cluster exist. Finally, pushers at all densities can tilt against the wall normal and their in-plane velocities align to show swarming. It turns into chaotic swarming for strong pushers at high densities. We characterize all these states quantitatively.
1 Introduction
Research of active matter has made much progress in the past decade as documented, e.g., by the following review articles1–5 but it keeps on challenging natural scientists including physicists. One reason is the nonequilibrium nature of active matter and the novel and diverse emergent behavior in many of the observed phenomena. While the microscopic constituents can often be characterized fairly easily, a collection of them shows interesting collective dynamics, which can be altered by external stimuli or geometrical constraints. One important example for an active system is a collection of microswimmers. They have a propulsion mechanism that enables them to actively move through a fluid at low Reynolds number without any applied external force.6 However, in the presence of external fields,7,8 such as flow fields,9–14 light fields,15,16 or simple harmonic potentials,17–19 microswimmers show a plethora of fascinating dynamics, especially if they are coupled to each other by hydrodynamic interactions.2,7,8,19–25An ubiquitous example of an external field is gravity, which affects every swimmer that is not neutrally buoyant. Already a range of diverse phenomena has been observed such as bound swimmer states,26 polar order in sedimenting swimmers, which in turn can be described by an effective temperature,27–29 gravitaxis of asymmetric swimmers,30 and inverted sedimentation profiles of bottom-heavy swimmers.31 Very appealing patterns occur during bioconvection32 and more recent work addresses the formation of thin phytoplankton layers in the coastal ocean33 or rafts of active emulsion droplets, where the role of phoretic interactions has to be clarified.34,35 In realistic settings non-buoyant swimmers will naturally interact with bounding surfaces. Their impact has already been studied in several works.36–45
In recent articles we focussed on single microswimmers in moderate gravitational fields42 and on their collective sedimentation.46 For our studies we used squirmers as model microswimmers,47–50 the swimmer type of which can be continuously tuned from pushers over neutral swimmers to pullers. To fully integrate hydrodynamic interactions between squirmers and also between squirmers and bounding walls, we employed the method of multi-particle collision dynamics (MPCD), a particle-based solver of the Navier–Stokes equations.51,52
In this article we address a monolayer of squirmers that forms under strong gravity at the bottom surface of the simulation box by performing parallelized simulations with up to 108 fluid particles and up to several thousand squirmers. In contrast to our previous work42,46 where the squirmers can leave the bottom surface to swim upwards, in this article gravity is so strong that they are constrained to the bottom surface. Here, the squirmers either point upwards or tilt against the surface normal so that they move along the surface. They interact with each other via their self-generated flow fields and thereby induce an intriguing variety of dynamic states when density and squirmer type are varied. We categorize them in a state diagram. The most fascinating state is the hydrodynamic Wigner fluid. It is formed by weak pushers, neutral squirmers, and pullers at lower densities due to an effective hydrodynamic repulsion and it shows a glassy relaxation dynamics. We also observe states of fluctuating chains and trimers, of kissing, and at large densities a global cluster. Furthermore, pushers over the whole density range can tilt against the normal and the in-plane velocities align to show swarming, which turns into chaotic swarming for strong pushers at high densities.
The article is organized as follows. In Section 2 we present the squirmer model for microswimmers, introduce the MPCD simulation method, and give the relevant parameters of our simulations. In Section 3 we first present the state diagram for the squirmer monolayer and discuss the different states in subsequent subsections. Finally, in Section 4 we summarize our findings and conclude.
2 Model and method
In this work we investigate the collective behavior of many squirmers, which are coupled to each other and to a confining surface by hydrodynamic interactions. In the following we first introduce the squirmer and then our hydrodynamic simulation method of multi-particle collision dynamics.2.1 The squirmer model swimmer
In our simulations we use the squirmer47–50,53 as a versatile model for a microswimmer. It describes a sphere of radius R, which has a prescribed slip velocity field on its surface, whereby it propels itself forward without any external force acting on it. The surface velocity in the co-moving frame of the squirmer is given byvs(rs) = B1(1 + βê·![[r with combining circumflex]](https://www.rsc.org/images/entities/b_char_0072_0302.gif) s) s)![[thin space (1/6-em)]](https://www.rsc.org/images/entities/char_2009.gif) [(ê· [(ê·![[r with combining circumflex]](https://www.rsc.org/images/entities/b_char_0072_0302.gif) s) s)![[r with combining circumflex]](https://www.rsc.org/images/entities/b_char_0072_0302.gif) s − ê], s − ê], | (1) |
![[r with combining circumflex]](https://www.rsc.org/images/entities/b_char_0072_0302.gif) s = rs/R is the corresponding unit vector, and the unit vector ê gives the direction in which the squirmer propels in bulk fluid. Of course, the surface velocity generates a hydrodynamic flow field in the fluid in which the squirmer swims. This flow must satisfy the no-slip boundary condition at bounding walls and agree with the surface velocity fields of other squirmers. Therefore, the squirmer interacts hydrodynamically with other squirmers and bounding walls and thereby experiences additional linear and rotational velocities. Eqn (1) only takes into account the first two terms in the expansion of the slip velocity field of the general squirmer model.47,48 These terms suffice to determine both the bulk swimming speed v0 = 2/3B1 and the squirmer type through parameter β with its characteristic hydrodynamic far field. Many biological microorganisms, such as E. coli or Chlamydomonas, and artificial microswimmers, like active droplets,43,54–58 can be characterized by these two parameters. While a squirmer with β = 0 is a neutral squirmer with the hydrodynamic far field of a source dipole (∼r−3), β < 0 and β > 0 refer to pushers or pullers, respectively, with the far field of a force dipole (∼r−2).24,59 Note that β ≠ 0 also generates a source quadrupole term decaying as r−4.
s = rs/R is the corresponding unit vector, and the unit vector ê gives the direction in which the squirmer propels in bulk fluid. Of course, the surface velocity generates a hydrodynamic flow field in the fluid in which the squirmer swims. This flow must satisfy the no-slip boundary condition at bounding walls and agree with the surface velocity fields of other squirmers. Therefore, the squirmer interacts hydrodynamically with other squirmers and bounding walls and thereby experiences additional linear and rotational velocities. Eqn (1) only takes into account the first two terms in the expansion of the slip velocity field of the general squirmer model.47,48 These terms suffice to determine both the bulk swimming speed v0 = 2/3B1 and the squirmer type through parameter β with its characteristic hydrodynamic far field. Many biological microorganisms, such as E. coli or Chlamydomonas, and artificial microswimmers, like active droplets,43,54–58 can be characterized by these two parameters. While a squirmer with β = 0 is a neutral squirmer with the hydrodynamic far field of a source dipole (∼r−3), β < 0 and β > 0 refer to pushers or pullers, respectively, with the far field of a force dipole (∼r−2).24,59 Note that β ≠ 0 also generates a source quadrupole term decaying as r−4.
2.2 Multi-particle collision dynamics
The flow fields generated by squirmers are governed by the Navier–Stokes equations, which we solve numerically by employing the particle-based method of multi-particle collision dynamics (MPCD),51,52,60–62 which includes thermal noise. In this article we are concerned with microswimmers, which move at low Reynolds numbers. In this regime the Navier–Stokes equations reduce to the Stokes equation since inertia is negligible.In our MPCD simulations the fluid is composed of up to 108 point particles of mass m0, which perform alternating streaming and collision steps. In the streaming step the position ri of each particle i is updated using its velocity vi and the time step Δt: ri(t + Δt) = ri(t) + viΔt. In the collision step the simulation volume is divided into cubical cells of edge length a0. All fluid particles within one cell exchange momentum according to the MPC-AT+a rule.61 It ensures linear and angular momentum conservation as well as a thermalization of particle velocities to temperature T. On average there are nfl = 10 fluid particles in each collision cell. We choose the duration of the streaming step as  , with Boltzmann constant kB, which sets the shear viscosity to
  .63 Note that in a recent work the authors of ref. 64 used a larger number of fluid particles per unit cell, nfl = 80, where the MPCD fluid is less compressible. For neutral squirmers confined between two plates, they do not observe motility-induced phase separation (MIPS) into a dilute and a cluster phase, which occurs for nfl = 10.37,40 Since in our system MIPS does not occur and clustering at medium densities is only transient as in the simulations of ref. 64, we used the lower value for nfl = 10, which makes our simulations feasible.
In the streaming step momentum is transferred from the fluid particles to the squirmers. Fluid particles that enter a squirmer or a bounding surface are repositioned outside of the obstacle by updating their positions and velocities. We apply the “bounce-back rule”65 to make sure the updated velocity fulfills the surface flow field of eqn (1) and the no-slip boundary condition at bounding walls, respectively. Between squirmers and walls as well as between pairs of squirmers also steric interactions are implemented, which we take into account in a molecular dynamics step. Further details of our implementation are described in ref. 37 and 40. Since we simulate large systems with many squirmers, we employ the parallelized version of ref. 40.
As in earlier works,42,46 we are interested in squirmers moving under gravity but now make it so strong that all squirmers are constrained to the bottom surface with very little variation in z-direction as discussed in the beginning of Section 3.3. Gravity acts on each squirmer with a force F = −mgez. Here m is the squirmer mass and g the acceleration. Through g = g0(1 − ρf/ρs) it depends on the mismatch of fluid and squirmer densities (ρf and ρs) and the gravitational acceleration g0. The buoyant squirmer mass then is m(1 − ρf/ρs). The force F adds a contribution of F/(2m)Δt2 to the update of the squirmer's position during the streaming step. Since the influence of gravity on a fluid on the micron scale is negligible, the update of the fluid particles’ positions does not include F.
The MPCD method is known to reproduce analytic results, e.g., the flow field around passive colloids,60 fluid friction as a particle approaches a wall,66 the active velocity of squirmers,50 or hydrodynamic torques acting on them close to walls.39 Even in systems with many particles, such as a dense colloidal suspension under Poiseuille flow, it correctly predicts velocity oscillations and particle segregation.67,68
Finally, MPCD resolves flow fields on time and length scales large compared to the duration of the streaming step Δt and the mean free path of the fluid particles, respectively. Using a squirmer radius of R = 4a0, we are therefore able to resolve flow fields even if squirmers approach each other closely.
2.3 Parameters
We simulate the collective behavior of up to N = 3136 squirmers of radius R = 4a0. They are initialized with random orientation and position within a box of height h = 56a0 and a quadratic base with linear extension L = 112a0 or L = 448a0. We employ periodic boundary conditions in the two horizontal directions (x and y) while the box is confined by no-slip walls at the top (z = h) and bottom (z = 0). Note we expect our box height h = 14R to be sufficiently large so that hydrodynamic interactions with the top boundary should be negligible against hydrodynamic interactions between the squirmers moving at the bottom surface. In particular, any flow disturbance initiated at the bottom surface decays at least with 1/r2. For a mean squirmer distance of 4R at a density of ϕ ≈ 0.3 this means that the influence from the top surface is a factor 10 smaller than the direct hydrodynamic interactions between the squirmers.Similar to our earlier works42,46 there are two velocities that characterize squirmer dynamics. These are the bulk sedimentation velocity vg = mg/(6πηR) of a single squirmer, where m is the squirmer mass, and its swimming velocity v0 = 2/3B1. Their ratio α = v0/vg is a dimensionless number, which we fix throughout this work to α = 0.06 by setting  and
and  . Without activity these squirmers are equivalent to passive Brownian particles with the same mass m, for which we can compute the passive sedimentation length δ0 = kBT/(mg) = 7.5 · 10−4a0 = 1.9 · 10−5R. Hence squirmers experience only very little variability in their vertical position due to thermal fluctuations. Together with the small α this means that squirmers cannot escape from the bottom wall. The total number of squirmers is sufficiently small so that they form a monolayer with squirmer centers located close to z = R. We quantify their two-dimensional density by the area fraction ϕ = NπR2/L2. Note, with monolayer we do not mean a densely packed layer of squirmers but a collection of squirmers at z ≈ R with tunable density.
In our simulations the Péclet number Pe = v0R/D, where D = kBT/(6πηR) is the translational diffusion coefficient, takes the value Pe = 323. This means that thermal translational motion is negligible. Furthermore, we are within the Stokesian regime of hydrodynamics, where inertia is irrelevant, as evident from the low Reynolds number of Re = v0Rnfl/η = 0.17. Note that real microswimmers move at much smaller Reynolds numbers but the present value is widely deemed acceptable in particle-based hydrodynamic simulations.
3 Results
In the following we explore the collective dynamics of a monolayer of squirmers confined to a lower boundary by gravity. It forms at the beginning of a simulation when the squirmers are rapidly pulled to the bottom wall by strong gravity and then equilibrates. Varying squirmer parameter β and area fraction or density ϕ, we identify many intriguing states, which are illustrated in Fig. 1 and by Videos S1–S6 in the ESI.† We shortly introduce these states and then discuss them in more detail in the following subsections. A collection of systems at various densities ϕ and squirmer parameters β is given in Video S7 (ESI†). The upper bound for ϕ is given by hexagonally close-packed circles with .
.
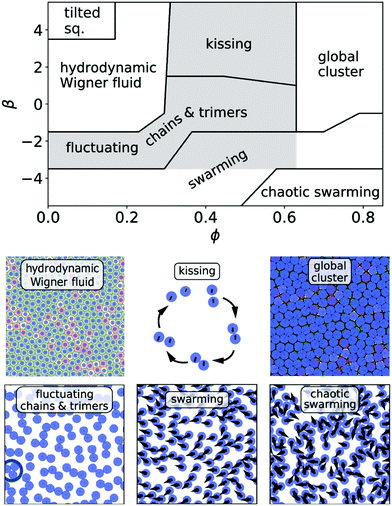 | ||
| Fig. 1 Top: Schematic state diagram illustrating the collective dynamics of a monolayer of squirmers confined to a bounding wall by gravity. The different states in the parameter space squirmer type β versus area fraction ϕ are discussed in the main text. Note, the lines separating the states are schematically drawn. In the shaded gray area local clusters such as pairs, trimers, and chains are observed. Bottom: Snapshots of the observed dynamic states as seen from above. The hydrodynamic Wigner fluid is represented by a Voronoi tessellation, where pentagon and heptagon defects are colored yellow and red, respectively. The kissing state is represented by a single kissing event. The red and yellow color in the dense packing of the cluster state indicate heptagon and pentagon defects. The ring in the fluctuating cluster state shows a trimer cluster. In the (chaotic) swarming state the arrows point along the orientation of the squirmers. The ESI† provides Videos S1–S6 of all the relevant states and Video S7, which shows a collection of the dynamic states in the whole state diagram. | ||
For all densities pushers (β < 0) exhibit swarming (Section 3.3). Their swimming direction tilts against the vertical so that they move in the horizontal plane. While strong pusher at low densities and weaker pushers at large densities swarm with a common direction, strong pushers at large densities show chaotic swarming. Adjacent in the state diagram is a region at small and medium densities, where neutral squirmers and weak pushers/pullers form pairs, trimers, larger clusters, and chains, which form and break up due to stochastic fluctuations (Section 3.2). In contrast, stronger squirmer pullers at medium densities perform a deterministic maneuver which we term “kissing” (Section 3.2). They approach each other, form pairs or trimers, then orient away from each other and thereby separate again. At large densities fluctuating and kissing clusters enter a state, where one global cluster forms in which squirmers hardly move or behave rather dynamic with increasing β. However, the most intriguing state is the hydrodynamic Wigner fluid, which weak pushers, pullers, and neutral squirmers form at low to medium densities (Section 3.1). Due to hydrodynamic repulsion they form local hexagonal order while long-range translational and orientational order does not occur. We start with describing this state in more detail in Section 3.1.
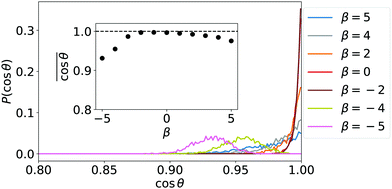
A first understanding of the observed phenomenology at low densities is provided by the probability distributions for the orientation of single squirmers and their mean orientation plotted in Fig. 2. Strong pushers (β = −4, −5) have a maximum of the orientational distribution at θ ≠ 0, where θ is the angle between the wall normal and the squirmer's orientation. Since they are tilted against the wall normal, they move in the horizontal plane and their collective motion initiates swarming. The tilted orientation is expected for pushers at heights between the validity of lubrication theory and far-field approximation.41,42 As we will discuss in the beginning of Section 3.3, strong pushers are not sitting directly on the surface. For all other β single squirmers are oriented on average along the wall normal in agreement with the fluctuating cluster state and the hydrodynamic Wigner fluid. The orientations of strong pullers (β = 4, 5), however, strongly fluctuate about the wall normal and instead of the Wigner fluid they form a state “tilted squirmers”, which we shortly introduce in the paragraph before Section 3.1.1.
3.1 Hydrodynamic Wigner fluid
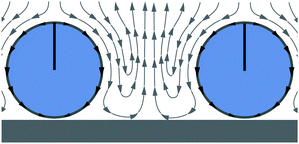
The state of the hydrodynamic Wigner fluid is most clearly demonstrated for β = 0 and ϕ = 0.26 by Video S8 in the ESI.† Here, neutral squirmers are well separated from each other and local hexagonal order is visible. They fluctuate about their mean position as in a colloidal crystal (see, e.g., ref. 69). The squirmers have an upright orientation and push nearby fluid downwards, which due to the bounding surface pushes nearby squirmers away (see Fig. 3). Due to this long-range hydrodynamic repulsion local hexagonal order forms. Obviously, the repulsion is enhanced for pullers, which pull additional fluid downwards and to the side. In contrast, pushers at their back draw fluid in and thereby destabilize the Wigner fluid so that with decreasing β a transition to the state of fluctuating chains and trimers occurs (see Fig. 1, top).When thermal fluctuations tilt the swimming direction, a squirmer moves towards its neighbors until their flow fields and the hydrodynamic interaction with the wall rotate the orientation back to normal. This causes the clearly visible fluctuations in Video S8 (ESI†). Assuming perfect hexagonal order, the squirmer distance in units of the squirmer radius is approximated as
 | (2) |
![[thin space (1/6-em)]](https://www.rsc.org/images/entities/char_2009.gif) θ = 1 of the orientational distribution function for a single squirmer in Fig. 2). At low ϕ < 0.2 (see state “tilted squirmers” in the state diagram of Fig. 1) this leads to a long-range hydrodynamic attraction and a short-range repulsion, where local hexagonal ordering cannot form. We will not discuss this state further.
θ = 1 of the orientational distribution function for a single squirmer in Fig. 2). At low ϕ < 0.2 (see state “tilted squirmers” in the state diagram of Fig. 1) this leads to a long-range hydrodynamic attraction and a short-range repulsion, where local hexagonal ordering cannot form. We will not discuss this state further.
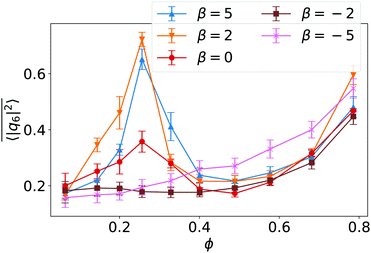
 ,37,70,71 which averages the local bond order value
 | (3) |
 to indicate the temporal mean. In Fig. 4 we plot
  versus ϕ for different β. In the region of the hydrodynamic Wigner fluid at ϕ < 0.3 we see bond orientational order for β > −2, which is most pronounced at ϕ = 0.26 and β ≥ 2 as already stated. The swarming state (β ≤ −2) at small ϕ does not show any bond order, while a noticeable bond order develops towards the global cluster or swarming state at large ϕ for all β.
To analyze the Voronoi tessellation further, we plot in Fig. 5 the standard deviation ΔNV from the mean number of Voronoi neighbors, which is six in all our simulations as required by the planar surface. The minimum at ϕ = 0.26 confirms the earlier observations that at this density local hexagonal order is most pronounced.
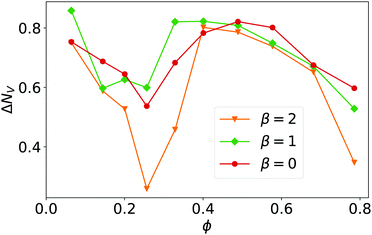 | ||
| Fig. 5 The standard deviation from the mean number of Voronoi neighbors, ΔNV, plotted versus ϕ for β = 0, 1, and 2. Linear system size is L = 112. | ||
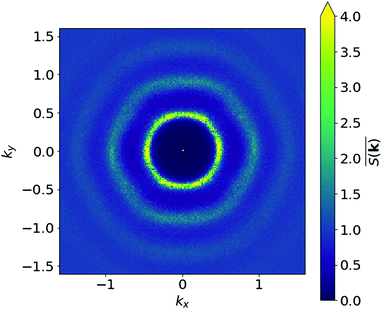
Ultimately, to probe the squirmer monolayers for long-range positional order, we determine the structure factor
 | (4) |
In Fig. 6 it is color-coded in the kx, ky plane for β = 0 at ϕ = 0.26. Clearly, the inner ring at |k*| and two weak larger rings indicate that long-range positional order does not exist although weak maxima are visible in the inner ring, which we attribute to the finite size of our simulations. This justifies the name hydrodynamic Wigner fluid. We also checked that a perfectly ordered squirmer monolayer is not stable but develops pentagon/heptagon defects in time and ultimately shows the same structure factor. For β = 1, 2 the weak maxima in S(k) are a bit more pronounced and seem to indicate the different hexagonal domains visible in the Voronoi tessellation of Video S9 (ESI†).
A two-dimensional system allows for a hexatic phase, which is fluid but shows long-range correlations in the 6-fold bond order as demonstrated in the theory of two-dimensional melting.69,72–75 The 6-fold bond-order correlation function,
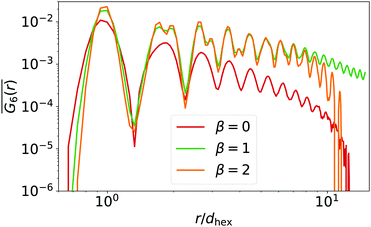
| G6(|r − r′|): = 〈q6(r)q6(r′)〉, | (5) |
 for β = 0,2 decays strongly between distances r/dhex = 100 and 200, hexatic order is not present and the hydrodynamic Wigner fluid is in a pure liquid state. Surprisingly, for β = 1 the strong decay is not visible. The Voronoi tessellation reveals hexagons oriented roughly in the same direction all over the simulation box and only small regions with a different mean orientation. This might cause the observed feature and only simulations with a larger system size can clarify if it is a finite size effect. However, at present such simulations are unfeasible also because the system is governed by a dynamics slower by at least a factor of ten compared to β = 0, as we will see below.
 | (6) |
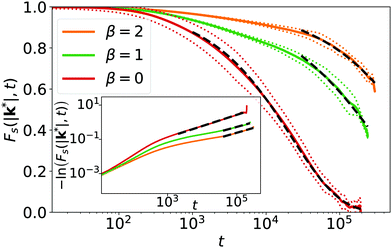
Interestingly, after some initial decay the self-intermediate scattering function, especially for β = 0, can be fitted by a stretched exponential,
| f(t) = e−(t/τ)α. | (7) |
Typically, this indicates a more complex relaxation process. For β = 0 we find the exponent α = 0.66 as indicated in the inset of Fig. 8. Stretched exponentials are observed in the α-relaxation of (colloidal) glasses close to the glass transition.76–80 It is preceded by the β-relaxation‡, which enters a plateau before α-relaxation sets in. We do not observe such a plateau. However, already at β = 0 we can identify a different initial relaxation process in Fs(|k*|,t), which cannot be fit by the stretched exponential as the inset demonstrates. This process is even better visible for β = 1 and 2.
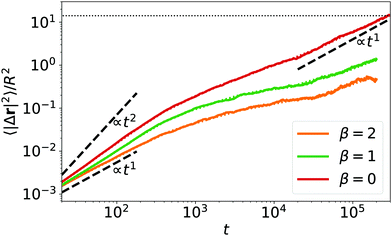
Close to the colloidal glass transition α-relaxation is associated with a colloid leaving the cage formed by surrounding colloids. We anticipate a similar dynamics as illustrated in Fig. 9, where we plot the mean squared displacement versus time. When calculating 〈|Δr|2〉 we first subtract any global drift motion of all squirmers. For β = 0 squirmers move beyond the squirmer-squirmer distance dhex leaving the cage formed by neighboring squirmers. For β = 1 and 2 this process is not completed in the available simulation time in agreement with Fig. 8. Interestingly, the mean-square displacement is (super)diffusive for small times, becomes subdiffusive at intermediate times, when the squirmer starts to feel its neighbors, and for large times for β = 0 approaches diffusive dynamics. Thus, squirmers in a hydrodynamic Wigner fluid perform glassy dynamics reminiscent of what is observed close to the glass transition.
3.2 Clusters
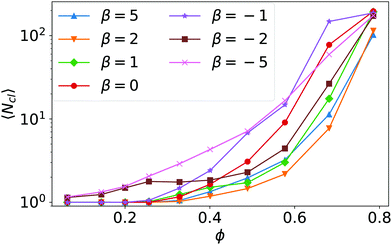
We now discuss in more detail aspects of the state of fluctuating chains and clusters, the kissing and the global cluster states, which we introduced in the state diagram of Fig. 1. In Section 3.1 we noted that starting with the hydrodynamic Wigner fluid and increasing density beyond ϕ = 0.26 squirmers touch each other and form pairs due to an effective short-range hydrodynamic attraction. Further squirmers can join to form chains and clusters but this process is reversible. In the state of fluctuating clusters squirmers detach due to stochastic fluctuations and the cluster breaks apart, while in the kissing state the breakup looks more deterministic.The formation of clusters, their sizes and stability depend on the hydrodynamic interactions between the squirmers. For all β the probability of squirmers to touch each other and thereby form clusters grows with area density ϕ, as the mean cluster size 〈Ncl〉, plotted in Fig. 10, demonstrates. To acquire the statistical data for calculating mean values and also cluster-size distributions, we define squirmers to be in the same cluster if the gap between them is smaller than 0.1R, i.e., the distance of their centers is below 2.1R. For all squirmer types β the mean cluster size ultimately grows faster than exponentially with increasing ϕ. Of course, in the hydrodynamic Wigner fluid (β > −2) the mean cluster size is one and then increases beyond ϕ = 0.26 when the states of kissing or fluctuating clusters are entered. In the swarming state of strong pushers (see β = −5) and in the fluctuating cluster state of weaker pushers (see β = −2) the mean cluster size is larger than 1 even for small ϕ. Here, the squirmers are tilted against the wall normal so that they constantly move along the bottom wall. In this dynamic environment they bump into each other and form transient clusters.
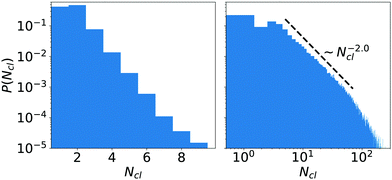
We further analyzed the distribution P(Ncl) of cluster sizes for neutral squirmers and found several characteristic shapes (see Fig. 11 for two of them). Of course, for ϕ ≤ 0.26 all clusters have size one (distribution not shown). Above ϕ = 0.26 in the fluctuating cluster state the cluster-size distribution has exponential form (see Fig. 11, left), where the mean size grows with ϕ as discussed before. This shape persists until the largest cluster of squirmers is close to the percolation transition, where the cluster spans the whole system. Below but close to this transition (see Fig. 11, right) the cluster-size distribution takes the form of a power law with an exponential cutoff. The exponent of the power law P(Ncl) ∼ Ncl−τ has the value τ ≈ 2.0, which nicely agrees with the theoretical value 187/91 ≈ 2.05 of two-dimensional percolation.81,82 Finally, at high ϕ the distribution P(Ncl) is bimodal (not shown). It results from the dominant percolating cluster of fluctuating size, which scales with L2 at constant ϕ, and a distribution of smaller clusters, which break away from and merge with the dominant cluster dynamically.
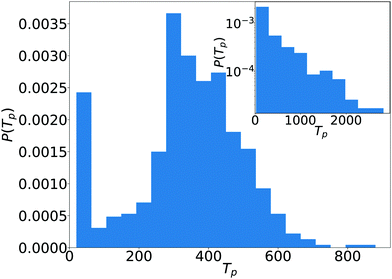
In the fluctuating cluster state pairs form when the orientations of the squirmers are tilted towards each other so that they swim against each other (see Video S10 in the ESI†). The pairs break up again when nearby squirmers approach or when orientational fluctuations tilt the orientations away. The events of a breakup occur stochastically and seem to be independent from each other. Then, we expect them to follow a Poissonian process like radioactive decay. Indeed, the distribution of pair lifetimes is roughly exponential as the inset of Fig. 12 demonstrates.
In the kissing state the breakup of pairs and trimers follows a different process. This is obvious from the distribution of pair lifetimes plotted in Fig. 12 for puller squirmers (β = 2) at ϕ = 0.33. The distribution has a clear maximum at a non-zero lifetime Tp. Indeed, Video S2 in the ESI† and the graphic representation in Fig. 1, bottom for the formation and breakup of a pair hints to a mostly deterministic process. As squirmers approach, their orientations are tilted towards each other. However, this configuration is unstable. As soon as they touch, they turn to the side, pass each other, and thereby separate to find another nearby puller. Due to this scenario, we called the dynamical state “kissing”. Interestingly, similar behavior occurs for trimers (marked with a red circle in Video S2 in the ESI†).
Finally, we note that for the large density of ϕ = 0.68 and β = −1 we even observe symmetric clusters with seven squirmers as part of larger groupings (see, e.g., bottom left in the beginning of Video S11 in the ESI†). They spontaneously switch between rotating and non-rotating states.
3.3 Swarming
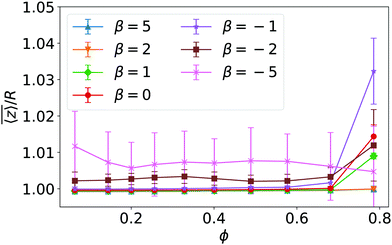
For β ≤ −2 but also for β = −1 at large densities the pusher orientation tilts against the normal so that it moves along the bottom wall. This observation correlates very nicely with the mean height of the squirmer above the wall, which is plotted in Fig. 13 versus density ϕ for different β. While for β > −2 squirmers sit on the surface, for β ≤ −2 the flow field due to the tilted orientation lifts them up by a small amount. We note that the tilted orientation fits to the expectation that for pushers there has to be a transitional region between the upright orientation at the wall as calculated in lubrication theory and the parallel far-field orientation.41,42 For small densities and squirmer type β around −2 we observe random motion of the squirmers in the fluctuating chain state as indicated in the state diagram of Fig. 1. For stronger pushers the in-plane velocities align and the squirmers show swarming (see Video S5 in the ESI†). We note that in this state the in-plane velocities point in the same direction as the in-plane orientations of the squirmers (data not shown). As we see in Fig. 14 strong pushers (β = −5) show a mean in-plane velocity of 1.5v0 at low densities, which cannot be explained by the mean tilt of a single squirmer against the wall normal (see Fig. 2). So the enhanced swarming velocity is also a collective effect.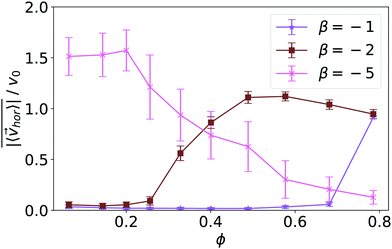 | ||
| Fig. 14 Mean collective horizontal speed plotted versus density ϕ for squirmer type β = −1, −2, and −5. Error bars indicate the temporal standard deviation of the recorded horizontal velocities. | ||
Fig. 14 quantifies the swarming by plotting the mean collective horizontal speed  , where vhor:= (vx, vy). Here it is important that first the ensemble average of the in-plane velocity vector is taken before the absolute value in order to identify a collective swarming direction. Thus, swarming or collective motion in a preferred direction is measured. We consider the system to display swarming if
  . The mean collective horizontal speed reflects the different states in the state diagram of Fig. 1. Since the slope of the curves in Fig. 14 are rather steep around
  , changing the criterion will not strongly affect the schematic boundaries in the state diagram. For β = −1 it is zero, which corresponds to the Wigner fluid and the adjacent fluctuating cluster state. Only at the largest densities a noticeable collective horizontal speed indicates swarming. For β = −2 the in-plane velocities have random orientation at small densities and then for ϕ ≥ 0.3 align with each other in the swarming state. Interestingly, the in-plane velocity of strong pushers decreases with increasing ϕ above ϕ = 0.2. Above ϕ ≈ 0.58 a global direction in the collective horizontal velocity does no longer exist and the squirmers perform what we call chaotic swarming (see Video S6 in the ESI†). The flow field of strong pushers possesses vortices close to the squirmer surface,20 which rotate nearby pushers and thereby more and more destroy the alignment of the in-plane velocity for increasing ϕ. This randomization is also evident from the large error bars in Fig. 14, which indicate the strength of temporal fluctuations of
  . Finally, we note that in the vicinity of the wall swarming pushers can move faster than pushers in a bulk fluid.
4 Conclusions
Using hydrodynamic simulations with the MPCD method, we studied a monolayer of squirmers that forms under strong gravity at the bottom surface of a container. The squirmers interact with each other via their self-generated flow fields and thereby induce several dynamic states, which we identified by varying squirmer density and squirmer type. The most interesting state is certainly the hydrodynamic Wigner fluid that neutral squirmers, pullers, and weak pushers form at low to medium densities. The squirmers have an upright orientation and push their neighbors away through their flow fields. They thereby create a structure with local hexagonal order, which nevertheless is fluid and does not show long-range hexatic order. However, we identified a non-trivial relaxation of the self-intermediate scattering function that follows a stretched exponential. This is reminiscent of what is seen in the α-relaxation of a glass-forming system close to the glass transition. For example, a Wigner glass in a colloidal system with strong electrostatic repulsion exists.83 However, in our case we cannot just increase the strength of the hydrodynamic repulsion by increasing density since then the squirmers start to hydrodynamically attract each other.If density is increased starting from the Wigner fluid, squirmers enter the state of fluctuating clusters or, for medium to strong pullers, the kissing state. Fluctuating clusters also exist for medium pushers at small to medium densities. Both states show an exponential cluster size distribution but they differ in the kinetics how they break up. Fluctuating pairs break up by stochastic events due to orientational fluctuations or due to approaching nearby squirmers, which roughly gives an exponential lifetime distribution. In contrast, the distribution in the kissing state is peaked at a finite time, which hints to a more deterministic process. At even larger densities the cluster size distribution becomes algebraic close to the percolation transition and ultimately reaches a bimodal shape in the global cluster state where most squirmers are part of a percolating cluster. Finally, the orientation of strong pushers and also weaker pusher at large densities tilts against the wall normal. The in-plane velocities align and thereby form the swarming state, which for very strong pushers at large densities becomes chaotic.
In a recent work hydrodynamically interacting squirmers experience an aligning torque towards a bounding wall.45 Similar to our results, the authors detect a variety of different states. So, it would be interesting to identify an experimental system to study structure formation close to a bounding wall under defined conditions, which in our case would mean strong gravity. Possible realizations of squirmers in such a system are Volvox algae and active emulsions.58
Conflicts of interest
There are no conflicts to declare.Acknowledgements
We thank Peter Keim for insightful discussion. This project was funded by Deutsche Forschungsgemeinschaft through the research training group GRK 1558 and priority program SPP 1726 (grant number STA352/11). The authors acknowledge the North-German Supercomputing Alliance (HLRN) for providing HPC resources that have contributed to the research results reported in this paper.References
- S. Ramaswamy, Annu. Rev. Condens. Matter Phys., 2010, 1, 323–345 CrossRef.
- M. C. Marchetti, J.-F. Joanny, S. Ramaswamy, T. B. Liverpool, J. Prost, M. Rao and R. A. Simha, Rev. Mod. Phys., 2013, 85, 1143 CrossRef CAS.
- C. Bechinger, R. Di Leonardo, H. Löwen, C. Reichhardt, G. Volpe and G. Volpe, Rev. Mod. Phys., 2016, 88, 045006 CrossRef.
- D. Needleman and Z. Dogic, Nat. Rev. Mater., 2017, 2, 17048 CrossRef CAS.
- A. Doostmohammadi, J. Ignés-Mullol, J. M. Yeomans and F. Sagués, Nat. Commun., 2018, 9, 3246 CrossRef.
- E. Lauga and T. R. Powers, Rep. Prog. Phys., 2009, 72, 096601 CrossRef.
- H. Stark, Eur. Phys. J.-Spec. Top., 2016, 225, 2369–2387 CrossRef.
- N. Desai and A. M. Ardekani, Soft Matter, 2017, 13, 6033–6050 RSC.
- A. Sokolov and I. S. Aranson, Phys. Rev. Lett., 2009, 103, 148101 CrossRef PubMed.
- S. Rafa, L. Jibuti and P. Peyla, Phys. Rev. Lett., 2010, 104, 098102 CrossRef PubMed.
- A. Zöttl and H. Stark, Phys. Rev. Lett., 2012, 108, 218104 CrossRef PubMed.
- S. Uppaluri, N. Heddergott, E. Stellamanns, S. Herminghaus, A. Zöttl, H. Stark, M. Engstler and T. Pfohl, Biophys. J., 2012, 103, 1162–1169 CrossRef CAS PubMed.
- A. Zöttl and H. Stark, Eur. Phys. J. E: Soft Matter Biol. Phys., 2013, 36, 4 CrossRef PubMed.
- E. Clement, A. Lindner, C. Douarche and H. Auradou, Eur. Phys. J.-Spec. Top., 2016, 225, 2389–2406 CrossRef.
- C. Lozano, B. Ten Hagen, H. Löwen and C. Bechinger, Nat. Commun., 2016, 7, 12828 CrossRef CAS PubMed.
- J. A. Cohen and R. Golestanian, Phys. Rev. Lett., 2014, 112, 068302 CrossRef PubMed.
- R. Nash, R. Adhikari, J. Tailleur and M. Cates, Phys. Rev. Lett., 2010, 104, 258101 CrossRef CAS PubMed.
- A. Pototsky and H. Stark, EPL, 2012, 98, 50004 CrossRef.
- M. Hennes, K. Wolff and H. Stark, Phys. Rev. Lett., 2014, 112, 238104 CrossRef PubMed.
- A. A. Evans, T. Ishikawa, T. Yamaguchi and E. Lauga, Phys. Fluids, 2011, 23, 111702 CrossRef.
- F. Alarcón and I. Pagonabarraga, J. Mol. Liq., 2013, 185, 56–61 CrossRef.
- D. Saintillan and M. J. Shelley, C. R. Phys., 2013, 14, 497–517 CrossRef CAS.
- W. Yan and J. F. Brady, Soft Matter, 2015, 11, 6235–6244 RSC.
- A. Zöttl and H. Stark, J. Phys.: Condens. Matter, 2016, 28, 253001 CrossRef.
- N. Oyama, J. J. Molina and R. Yamamoto, Phys. Rev. E, 2016, 93, 043114 CrossRef PubMed.
- K. Drescher, K. C. Leptos, I. Tuval, T. Ishikawa, T. J. Pedley and R. E. Goldstein, Phys. Rev. Lett., 2009, 102, 168101 CrossRef PubMed.
- J. Palacci, C. Cottin-Bizonne, C. Ybert and L. Bocquet, Phys. Rev. Lett., 2010, 105, 088304 CrossRef.
- M. Enculescu and H. Stark, Phys. Rev. Lett., 2011, 107, 058301 CrossRef PubMed.
- F. Ginot, I. Theurkauff, D. Levis, C. Ybert, L. Bocquet, L. Berthier and C. Cottin-Bizonne, Phys. Rev. X, 2015, 5, 011004 Search PubMed.
- B. Ten Hagen, F. Kümmel, R. Wittkowski, D. Takagi, H. Löwen and C. Bechinger, Nat. Commun., 2014, 5, 4829 CrossRef CAS PubMed.
- K. Wolff, A. M. Hahn and H. Stark, Eur. Phys. J. E: Soft Matter Biol. Phys., 2013, 36, 43 CrossRef CAS.
- T. Pedley and J. Kessler, Annu. Rev. Fluid Mech., 1992, 24, 313–358 CrossRef.
- W. M. Durham, J. O. Kessler and R. Stocker, Science, 2009, 323, 1067–1070 CrossRef CAS PubMed.
- C. Krüger, C. Bahr, S. Herminghaus and C. C. Maass, Eur. Phys. J. E: Soft Matter Biol. Phys., 2016, 39, 64 CrossRef PubMed.
- C. Jin, C. Krüger and C. C. Maass, Proc. Natl. Acad. Sci. U. S. A., 2017, 114, 5089–5094 CrossRef CAS PubMed.
- I. Llopis and I. Pagonabarraga, J. Nonnewton. Fluid Mech., 2010, 165, 946–952 CrossRef CAS.
- A. Zöttl and H. Stark, Phys. Rev. Lett., 2014, 112, 118101 CrossRef PubMed.
- I. Jung, K. Guevorkian and J. M. Valles, Phys. Rev. Lett., 2014, 113, 218101 CrossRef PubMed.
- K. Schaar, A. Zöttl and H. Stark, Phys. Rev. Lett., 2015, 115, 038101 CrossRef.
- J. Blaschke, M. Maurer, K. Menon, A. Zöttl and H. Stark, Soft Matter, 2016, 12, 9821–9831 RSC.
- J. S. Lintuvuori, A. T. Brown, K. Stratford and D. Marenduzzo, Soft Matter, 2016, 12, 7959–7968 RSC.
- F. Rühle, J. Blaschke, J.-T. Kuhr and H. Stark, New J. Phys., 2018, 20, 025003 CrossRef.
- S. Thutupalli, D. Geyer, R. Singh, R. Adhikari and H. A. Stone, Proc. Natl. Acad. Sci. U. S. A., 2018, 115, 5403–5408 CrossRef CAS PubMed.
- Z. Shen, A. Würger and J. S. Lintuvuori, Eur. Phys. J. E: Soft Matter Biol. Phys., 2018, 41, 39 CrossRef PubMed.
- Z. Shen, A. Würger and J. S. Lintuvuori, Soft Matter, 2019, 15, 1508–1521 RSC.
- J.-T. Kuhr, J. Blaschke, F. Rühle and H. Stark, Soft Matter, 2017, 13, 7548–7555 RSC.
- M. Lighthill, Commun. Pure Appl. Math., 1952, 5, 109–118 CrossRef.
- J. Blake, J. Fluid Mech., 1971, 46, 199–208 CrossRef.
- T. Ishikawa, M. Simmonds and T. Pedley, J. Fluid Mech., 2006, 568, 119–160 CrossRef.
- M. T. Downton and H. Stark, J. Phys.: Condens. Matter, 2009, 21, 204101 CrossRef PubMed.
- G. Gompper, T. Ihle, D. Kroll and R. Winkler, Adv. Polym. Sci., 2009, 221, 1–87 CAS.
- A. Malevanets and R. Kapral, J. Chem. Phys., 1999, 110, 8605–8613 CrossRef CAS.
- A. Zöttl and H. Stark, Eur. Phys. J. E: Soft Matter Biol. Phys., 2018, 41, 61 CrossRef PubMed.
- S. Thutupalli, R. Seemann and S. Herminghaus, New J. Phys., 2011, 13, 073021 CrossRef.
- M. Schmitt and H. Stark, EPL, 2013, 101, 44008 CrossRef.
- M. Schmitt and H. Stark, Phys. Fluids, 2016, 28, 012106 CrossRef.
- M. Schmitt and H. Stark, Eur. Phys. J. E: Soft Matter Biol. Phys., 2016, 39, 80 CrossRef CAS PubMed.
- C. C. Maass, C. Krüger, S. Herminghaus and C. Bahr, Annu. Rev. Condens. Matter Phys., 2016, 7, 171–193 CrossRef CAS.
- S. E. Spagnolie and E. Lauga, J. Fluid Mech., 2012, 700, 105–147 CrossRef.
- J. Padding and A. Louis, Phys. Rev. E: Stat., Nonlinear, Soft Matter Phys., 2006, 74, 031402 CrossRef CAS PubMed.
- H. Noguchi, N. Kikuchi and G. Gompper, EPL, 2007, 78, 10005 CrossRef.
- R. Kapral, Adv. Chem. Phys., 2008, 140, 89–146 CrossRef CAS.
- H. Noguchi and G. Gompper, Phys. Rev. E: Stat., Nonlinear, Soft Matter Phys., 2008, 78, 016706 CrossRef PubMed.
- M. Theers, E. Westphal, K. Qi, R. G. Winkler and G. Gompper, Soft Matter, 2018, 14, 8590–8603 RSC.
- J. Padding, A. Wysocki, H. Löwen and A. Louis, J. Phys.: Condens. Matter, 2005, 17, S3393 CrossRef CAS.
- J. Padding and W. J. Briels, J. Chem. Phys., 2010, 132, 054511 CrossRef CAS PubMed.
- P. Kanehl and H. Stark, Phys. Rev. Lett., 2017, 119, 018002 CrossRef PubMed.
- P. Kanehl and H. Stark, J. Chem. Phys., 2015, 142, 214901 CrossRef PubMed.
- K. Zahn, R. Lenke and G. Maret, Phys. Rev. Lett., 1999, 82, 2721 CrossRef CAS.
- P. J. Steinhardt, D. R. Nelson and M. Ronchetti, Phys. Rev. B: Condens. Matter Mater. Phys., 1983, 28, 784 CrossRef CAS.
- J. Bialké, T. Speck and H. Löwen, Phys. Rev. Lett., 2012, 108, 168301 CrossRef PubMed.
- K. J. Strandburg, Rev. Mod. Phys., 1988, 60, 161 CrossRef CAS.
- U. Gasser, C. Eisenmann, G. Maret and P. Keim, ChemPhysChem, 2010, 11, 963–970 CrossRef CAS PubMed.
- K. Zahn and G. Maret, Phys. Rev. Lett., 2000, 85, 3656 CrossRef CAS PubMed.
- C. Eisenmann, U. Gasser, P. Keim and G. Maret, Phys. Rev. Lett., 2004, 93, 105702 CrossRef CAS PubMed.
- F. Sciortino and P. Tartaglia, Adv. Phys., 2005, 54, 471–524 CrossRef CAS.
- P. N. Pusey, J. Phys.: Condens. Matter, 2008, 20, 494202 CrossRef.
- G. Brambilla, D. El Masri, M. Pierno, L. Berthier, L. Cipelletti, G. Petekidis and A. B. Schofield, Phys. Rev. Lett., 2009, 102, 085703 CrossRef CAS PubMed.
- G. L. Hunter and E. R. Weeks, Rep. Prog. Phys., 2012, 75, 066501 CrossRef PubMed.
- L. Berthier and G. Biroli, Rev. Mod. Phys., 2011, 83, 587 CrossRef CAS.
- D. Stauffer, Phys. Rep., 1979, 54, 1–74 CrossRef.
- D. Stauffer and A. Aharony, Introduction to percolation theory: revised second edition, CRC press, 2014 Search PubMed.
- D. Bonn, H. Tanaka, G. Wegdam, H. Kellay and J. Meunier, EPL, 1999, 45, 52 CrossRef CAS.
Footnotes |
| † Electronic supplementary information (ESI) available: 11 videos and corresponding information. See DOI: 10.1039/c9sm00889f |
| ‡ Note that this has nothing to do with the squirmer parameter β. |
| This journal is © The Royal Society of Chemistry 2019 |

