 Open Access Article
Flow-assisted droplet assembly in a 3D microfluidic channel†
Zhouyang
Ge
 *a,
Outi
Tammisola
 ab and
Luca
Brandt
 ab
ab
aLinné FLOW Centre and SeRC (Swedish e-Science Research Centre), KTH Mechanics, SE-100 44 Stockholm, Sweden. E-mail: zhoge@mech.kth.se
bINTERFACE Centre, KTH Mechanics, SE-100 44 Stockholm, Sweden
First published on 1st April 2019
Abstract
Self-assembly of soft matter, such as droplets or colloids, has become a promising scheme to engineer novel materials, model living matter, and explore non-equilibrium statistical mechanics. In this article, we present detailed numerical simulations of few non-Brownian droplets in various flow conditions, specifically, focusing on their self-assembly within a short distance in a three-dimensional (3D) microfluidic channel, cf. [Shen et al., Adv. Sci., 2016, 3(6), 1600012]. Contrary to quasi two-dimensional (q2D) systems, where dipolar interaction is the key mechanism for droplet rearrangement, droplets in 3D confinement produce much less disturbance to the underlying flow, thus experiencing weaker dipolar interactions. Using confined simple shear and Poiseuille flows as reference flows, we show that the droplet dynamics is mostly affected by the shear-induced cross-stream migration, which favors chain structures if the droplets are under an attractive depletion force. For more compact clusters, such as three droplets in a triangular shape, our results suggest that an inhomogeneous cross-sectional inflow profile is further required. Overall, the accelerated self-assembly of a small-size droplet cluster results from the combined effects of strong depletion forces, confinement-mediated shear alignments, and fine-tuned inflow conditions. The deterministic nature of the flow-assisted self-assembly implies the possibility of large throughputs, though calibration of all different effects to directly produce large droplet crystals is generally difficult.
1 Introduction
Recent advances in colloidal science have generated a growing interest in the fabrication of functional materials, especially those possessing photonic band gaps.1–5 Colloids – particles or droplets of (sub-)micron scale – are manipulated with high precision to self-organize into controlled patterns, which then form a library of basic building blocks for more complex structures.6 Conceivably, such direct assembly is also the most efficient mechanism for material synthesis. Colloidal self-assembly has thus become a promising scheme to engineer novel materials, mimicking the machinery of nature.7Currently, there are many strategies to synthesize colloidal building blocks, e.g. creating a short-range depletion potential in a microwell,8 exploiting shape/surface anisotropy of the colloids,6,9 using patterned substrates as templates,10 or even jamming droplets with a micro-mixer.11 Among these, flow-assisted self-assembly seems especially appealing, since the microfluidic droplets are driven by an external flow rather than Brownian motions, reducing the range of assembly time from days down to seconds (cf. the experiment of McMullen et al.12 as an example). With the potential of being optimized and applied in parallel, microfluidics appears to be the fastest pathway towards photonic material generation.
Following this approach, Shen et al.5 recently demonstrated the generation and self-assembly of droplet strings into a rich variety of (non-)compact structures, including chains, triangles, diamonds, crosses, etc. in a simple microfluidic device (see Fig. 1). Unlike most previous studies,13–18 where droplets under strong confinement interact via dipolar flows,19,20 these droplets are smaller than the smallest dimension of the microfluidic channel. Specifically, the droplets are tens to hundreds microns in diameter, while the channel height is about three times larger. As a consequence, typical quasi two-dimensional (q2D) arguments do not apply, and the dynamics is fully three-dimensional (3D). In the latter case, the complete Navier–Stokes (or Stokes) equations have to be solved to obtain a correct physical understanding of the system,‡ wherein prior simulations mainly focus on the deformation and migration of a single drop, or an evenly spaced array of drops.22–24 Interestingly, assuming a tunable far-field dipolar interaction, Shen et al.5 could however model the droplet motions up to a “semiquantitative” level, reproducing the sophisticated self-assembly observed in experiments. This apparent contradiction motivates us to pursue a detailed numerical study of the relatively fast droplet self-assembly in order to investigate the interactions in their microfluidic channel.
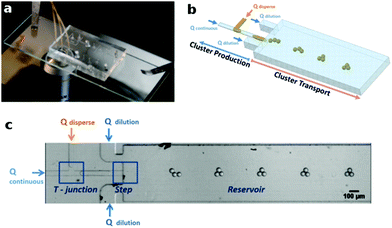 | ||
| Fig. 1 (a) Photo of a microfluidic channel placed above a desktop microscope. (b) Schematic of the channel geometry and generation of the droplet clusters. The main channel has a typical dimension of (50 μm × 600 μm × 5000 μm) in height, width, and length; hence, it can be considered as a Hele-Shaw cell. (c) Bottom view of the droplet self-assembly observed from the microscope. Pictures courtesy of Dr Joshua Ricouvier. For more details, see Shen et al.5 | ||
In the following, we first present a numerical methodology for the dynamics of two viscous fluids, including a hydrodynamic model for the near-field depletion force, a localized attractive force between suspending droplets. Applying this methodology, we then show results of extensive simulations of two to ten droplets in quiescent, shear-, and pressure-driven channel flows, each of which isolating an individual effect contributing to the self-assembly. Here, the focus is on the clustering and droplet interactions within a short distance from their initial release rather than the production of the droplets, which has been studied previously.25 Our aim is to elucidate the physical picture of the hydrodynamic interactions, potentially improving the design of more efficient microfluidic systems.
2 Models and methods
2.1 Hydrodynamic model
The dynamics of two immiscible, Newtonian fluids in incompressible flows is governed by the Navier–Stokes equations| ∇·u = 0, | (1a) |
 | (1b) |
 | (2) |
So far, we have introduced three non-dimensional numbers: Re, Ca, and Fr, denoting the Reynolds, Capillary, and Froude numbers, separately. Choosing fluid 1 as the reference phase, they are defined as
 | (3) |
![[L with combining tilde]](https://www.rsc.org/images/entities/i_char_004c_0303.gif) ,
, ![[small rho, Greek, tilde]](https://www.rsc.org/images/entities/i_char_e0e4.gif) 1,
1, ![[small mu, Greek, tilde]](https://www.rsc.org/images/entities/i_char_e0e0.gif) 1,
1, ![[small sigma, Greek, tilde]](https://www.rsc.org/images/entities/i_char_e10d.gif) , and
, and ![[g with combining tilde]](https://www.rsc.org/images/entities/i_char_0067_0303.gif) denote the reference dimensional velocity, length, density, dynamic viscosity, surface tension, and gravitational acceleration. Following the experiments in Shen et al.,5 typical values of the reference velocity and length are Ũ ∼ 100 μm s−1 and
denote the reference dimensional velocity, length, density, dynamic viscosity, surface tension, and gravitational acceleration. Following the experiments in Shen et al.,5 typical values of the reference velocity and length are Ũ ∼ 100 μm s−1 and ![[L with combining tilde]](https://www.rsc.org/images/entities/i_char_004c_0303.gif) ∼ 100 μm, leading to Re ∼ 10−2, Ca ∼ 10−5, and Fr ∼ 10−5 for oil–water systems. Therefore, inertial (but not gravitational) effects are negligible and the droplets shall remain mostly spherical. In the simulations that we are going to present, however, these numbers are enlarged within reasonable physical limits also to reduce the computation time. Specifically, Re has been increased up to 10 in most cases except those in Section 3.2 (where Re = 1) and those in Section 3.3.2 (where Re = 0.1); Ca is in the order of 10−3–10−2 depending on the Re; whereas Fr = 0.025 if gravity is enabled (otherwise ∞). In general, the Reynolds number cannot be arbitrarily increased as it is proportional to the fluid inertia. The reason we can increase it here is essentially due to the uniformity of the underlying flow. In this case, the mere effect of further reducing the Re is stretching the time scale, making the computations significantly longer. We have tested all cases at smaller Re's to ensure that the differences are negligible in the case of fully developed Couette and Poiseuille flows. This is discussed in more details in Appendix A.
∼ 100 μm, leading to Re ∼ 10−2, Ca ∼ 10−5, and Fr ∼ 10−5 for oil–water systems. Therefore, inertial (but not gravitational) effects are negligible and the droplets shall remain mostly spherical. In the simulations that we are going to present, however, these numbers are enlarged within reasonable physical limits also to reduce the computation time. Specifically, Re has been increased up to 10 in most cases except those in Section 3.2 (where Re = 1) and those in Section 3.3.2 (where Re = 0.1); Ca is in the order of 10−3–10−2 depending on the Re; whereas Fr = 0.025 if gravity is enabled (otherwise ∞). In general, the Reynolds number cannot be arbitrarily increased as it is proportional to the fluid inertia. The reason we can increase it here is essentially due to the uniformity of the underlying flow. In this case, the mere effect of further reducing the Re is stretching the time scale, making the computations significantly longer. We have tested all cases at smaller Re's to ensure that the differences are negligible in the case of fully developed Couette and Poiseuille flows. This is discussed in more details in Appendix A.
Finally, we note that the surface tension can also vary due to temperature or surfactant concentration gradients, leading to Marangoni stress along the surface. The detailed chemistry is rather complex;27 in the present paper, we assume constant and uniform surface tension ![[small sigma, Greek, tilde]](https://www.rsc.org/images/entities/i_char_e10d.gif) to reduce the number of the governing parameters.
to reduce the number of the governing parameters.
2.2 Depletion theory
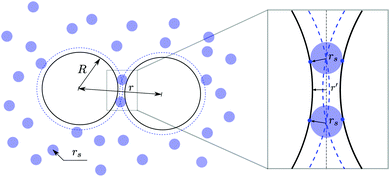
Droplets suspended in an ambient fluid dissolved by surfactant molecules typically experience an attractive depletion force. The first model to describe such interaction was proposed by Asakura and Oosawa,28 who assumed the surfactant micelles to be non-interacting hard spheres. As sketched in Fig. 2, a suspension of such small spheres around the large colloidal droplets creates an osmotic pressure on the droplet surface. When the distance between two droplets is less than the diameter of the surfactant micelles, the pressure defect due to the exclusion of the micelles pulls the drops even closer, corresponding to an attractive force. Integrating this force with respect to the inter-droplet distance r leads to a potential energy | (4) |
 | (5) |
| pos = nkT, | (6) |
Based on the above theory, we consider the depletion potential in the hydrodynamic model by adding an osmotic pressure, p′(r′), near the overlap region (r′ being the normalized distance to the droplet surface, see Fig. 2). Specifically, we write p′ as a Taylor-series expansion from r′ = rs
 | (7) |
 | (8) |
 | (9) |
 | ||
| Fig. 3 (left) Two droplets approaching in a quiescent flow, and (right) close-up of the flows in the gap due to the depletion force. | ||
2.3 Numerical methods
The above governing equations are solved numerically using the interface-correction level set/ghost fluid method (ICLS/GFM).30 The equations are discretized in space by the finite volume method, and integrated in time using the second-order Adam–Bashforth scheme. Combining several computational techniques, including the fast pressure correction method,31 the GFM,32 and the fast Fourier transform (FFT),33 discontinuous quantities are treated sharply at high efficiency. For the detailed algorithm and validations, we refer to Ge et al.30 The source code is also publicly available on GitHub.343 Results
In the following, we present simulation results of droplet motions in three types of flows: quiescent, shear-, and pressure-driven channel flows. In the last case, both Poiseuille flows and a non-uniform channel flow are considered. The purpose of using different flow types is to disentangle the effects of the depletion force, the droplet–droplet hydrodynamic interaction, and the droplet–flow interaction. The simpler cases can be seen as model problems towards understanding of the more complex motions of droplet ensembles in realistic microfluidic devices.3.1 Approaching droplets in quiescent flows
![[small sigma, Greek, tilde]](https://www.rsc.org/images/entities/i_char_e10d.gif)
![[small rho, Greek, tilde]](https://www.rsc.org/images/entities/i_char_e0e4.gif) 1(2
1(2![[R with combining tilde]](https://www.rsc.org/images/entities/i_char_0052_0303.gif) )/
)/![[small mu, Greek, tilde]](https://www.rsc.org/images/entities/i_char_e0e0.gif) 12, where
12, where ![[R with combining tilde]](https://www.rsc.org/images/entities/i_char_0052_0303.gif) is the droplet radius; and (ii) the osmotic-to-Laplace pressure ratio Π = pos/p.§ La relates surface tension to the viscous stress, which can also be expressed as La = Re/Ca. Π indicates the magnitude of the uniform osmotic pressure pos due to depletion of the surfactant micelles, scaled by a reference Laplace pressure p due to surface tension (cf.eqn (9)). In the following, we assume La = 2000 and Π = 1/8 or 1/2, corresponding to the limit Ca ≪ Re ≪ 1 and conditions above the critical micelle concentrations (CMC, see dimensional analysis below) as in the experiments.5
is the droplet radius; and (ii) the osmotic-to-Laplace pressure ratio Π = pos/p.§ La relates surface tension to the viscous stress, which can also be expressed as La = Re/Ca. Π indicates the magnitude of the uniform osmotic pressure pos due to depletion of the surfactant micelles, scaled by a reference Laplace pressure p due to surface tension (cf.eqn (9)). In the following, we assume La = 2000 and Π = 1/8 or 1/2, corresponding to the limit Ca ≪ Re ≪ 1 and conditions above the critical micelle concentrations (CMC, see dimensional analysis below) as in the experiments.5
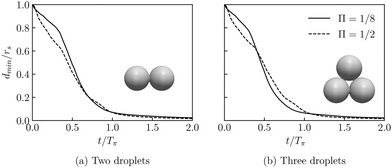
The approach of two and three droplets is illustrated in Fig. 4, where the minimal distance between the droplet surfaces dmin, normalized by the surfactant micelle radius rs, is shown as a function of time. Here, time is re-scaled by the factor Tπ = ![[r with combining tilde]](https://www.rsc.org/images/entities/i_char_0072_0303.gif) s/(
s/(![[R with combining tilde]](https://www.rsc.org/images/entities/i_char_0052_0303.gif) Π) to account for the size contrast of the droplet and the surfactant micelle, thus indicating an inverse scaling of the approaching time with the osmotic pressure for inertialess droplets, i.e. T ∝ Π−1. Indeed, for both Π = 1/8 and 1/2, our results show that dmin approaches the limit of the grid spacing at t ≈ Tπ. The smooth approach in both cases and the collapse of the distance curves thus verify our modeling of the near field chemical interaction, consistent with an attracting depletion force.
Π) to account for the size contrast of the droplet and the surfactant micelle, thus indicating an inverse scaling of the approaching time with the osmotic pressure for inertialess droplets, i.e. T ∝ Π−1. Indeed, for both Π = 1/8 and 1/2, our results show that dmin approaches the limit of the grid spacing at t ≈ Tπ. The smooth approach in both cases and the collapse of the distance curves thus verify our modeling of the near field chemical interaction, consistent with an attracting depletion force.
We note that Tπ is not a physical time scale (it is dimensionless). One possible definition for the depletion time scale is ![[small tau, Greek, tilde]](https://www.rsc.org/images/entities/i_char_e0e5.gif) π =
π = ![[r with combining tilde]](https://www.rsc.org/images/entities/i_char_0072_0303.gif) s
s![[small mu, Greek, tilde]](https://www.rsc.org/images/entities/i_char_e0e0.gif) 1/(
1/(![[R with combining tilde]](https://www.rsc.org/images/entities/i_char_0052_0303.gif)
![[p with combining tilde]](https://www.rsc.org/images/entities/i_char_0070_0303.gif) os), which can be rewritten as TπCa
os), which can be rewritten as TπCa![[small tau, Greek, tilde]](https://www.rsc.org/images/entities/i_char_e0e5.gif) , with a convection time scale
, with a convection time scale ![[small tau, Greek, tilde]](https://www.rsc.org/images/entities/i_char_e0e5.gif) = 2
= 2![[R with combining tilde]](https://www.rsc.org/images/entities/i_char_0052_0303.gif) /Ũ in the range of 0.1 to 1 s typically. By substitution of usual values of colloidal systems, e.g.
/Ũ in the range of 0.1 to 1 s typically. By substitution of usual values of colloidal systems, e.g. ![[r with combining tilde]](https://www.rsc.org/images/entities/i_char_0072_0303.gif) s = 1 nm,
s = 1 nm, ![[small mu, Greek, tilde]](https://www.rsc.org/images/entities/i_char_e0e0.gif) 1 = 10−3 kg m−1 s−1,
1 = 10−3 kg m−1 s−1, ![[R with combining tilde]](https://www.rsc.org/images/entities/i_char_0052_0303.gif) = 10 μm, and
= 10 μm, and ![[p with combining tilde]](https://www.rsc.org/images/entities/i_char_0070_0303.gif) os = 100 Pa (corresponding to surfactant micelles concentration of 5 CMC, see Shen,35 p. 112), the estimated time scale is 1 ns. Although
os = 100 Pa (corresponding to surfactant micelles concentration of 5 CMC, see Shen,35 p. 112), the estimated time scale is 1 ns. Although ![[small tau, Greek, tilde]](https://www.rsc.org/images/entities/i_char_e0e5.gif) π can be amplified by increasing the viscosity of the suspending fluid or reducing the micelles concentration, its magnitude is so small that the approaching can be considered instantaneous. Therefore, in practical microfluidic devices such as those in Shen et al.,5 one cannot expect to detect the dynamical approaching process due to depletion forces. The droplets will appear either bound or separated, depending on the surfactant concentration and flow conditions.
π can be amplified by increasing the viscosity of the suspending fluid or reducing the micelles concentration, its magnitude is so small that the approaching can be considered instantaneous. Therefore, in practical microfluidic devices such as those in Shen et al.,5 one cannot expect to detect the dynamical approaching process due to depletion forces. The droplets will appear either bound or separated, depending on the surfactant concentration and flow conditions.
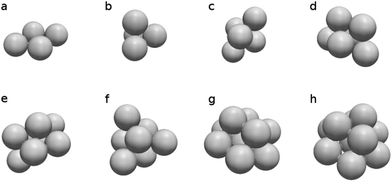 | ||
| Fig. 5 Packing of N droplets due to the near field depletion force. (a and b) N = 4, (c) N = 5, (d) N = 6, (e) N = 7, (f) N = 8, (g) N = 9, (h) N = 10. | ||
We remind that the specific coordinates of the sphere packings bear no more significance than other possibilities in our simulations. They are arbitrarily chosen to illustrate the self-assembly due to the near field attraction. This is not the case for trapped equilibrium clusters, where less symmetric geometries are found to be favored by the entropic depletion force.8,37 Nor is it similar to colloidal particles interacting via short-range attractive, long-range repulsive potentials, where complex phase transitions emerge depending on the competition of the interactions.38,39 Here, the self-assembly is microfluidic-based, driven by the hydrodynamics rather than the minimization of free energy over long periods. We examine the effect of the flow next.
3.2 Sticky droplets in shear-driven channel flows
When the droplets are carried by an external flow, their interactions are undoubtedly affected by the flow conditions, droplet–flow interactions and flow-induced droplet–droplet interactions.40 To study these additional effects, we consider an elementary flow field, the wall-bounded simple shear flow, defined as (u,v,w) = (0,![[small gamma, Greek, dot above]](https://www.rsc.org/images/entities/i_char_e0a2.gif) z,0) for z ∈ [−Lz/2,Lz/2]. Here, v is the only non-zero velocity component, its magnitude varies linearly with the z coordinate, and
z,0) for z ∈ [−Lz/2,Lz/2]. Here, v is the only non-zero velocity component, its magnitude varies linearly with the z coordinate, and ![[small gamma, Greek, dot above]](https://www.rsc.org/images/entities/i_char_e0a2.gif) is the shear rate (see Fig. 6a). The presence of droplets will locally modify this flow field, which we sustain by enforcing opposite motions of two moving plates at z = ±Lz/2.
is the shear rate (see Fig. 6a). The presence of droplets will locally modify this flow field, which we sustain by enforcing opposite motions of two moving plates at z = ±Lz/2.
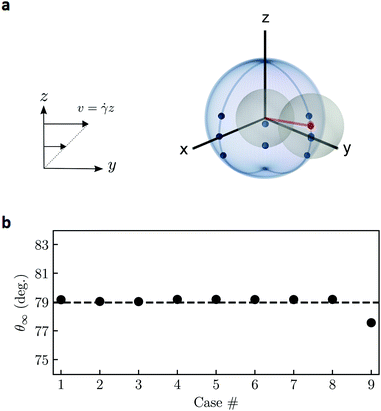 | ||
| Fig. 6 Stable configuration of a droplet pair in the simple shear flow. (a) Spherical diagram of the initial (blue dots) and final (red dots) positions of the second droplet in the reference frame of the first droplet. The blue arcs mark the border of the first quadrant where nine initial positions are considered. The undisturbed flow is a simple shear in the yz plane. (b) Steady-state polar angle, θ∞, corresponding to the cases in Table 1. The average value is 79 deg (dashed line). The stable azimuthal angle is identically 0. | ||
Dating back to Taylor,41 the deformation and motion of single or multiple droplet(s)/particle(s) have been studied extensively in simple shear flows.21,42–46 In the case of spherical particles/droplets, previously identified interaction modes include closed trajectories (particles rotate around each other in the vorticity plane), open-and-symmetric trajectories (particles return to their original z positions after passing each other), and swapping trajectories (particles exchange the z position after a binary encounter). The first two modes are generic features of a dilute suspension of particles or non-deforming/non-coalescing droplets, while the last mode arises when the particles are under relatively large geometric confinement. Conceivably, adding a near-field depletion force shall not alter these three modes as it is only activated at nearly touching, when the particles are already in a bound pair. What is yet to be explored, however, is when the gap between the two confining plates is smaller than the sum of the particle diameters (i.e. Lz/D < 2), thus disabling the occurrence of the Batchelor–Green type of closed orbit.
Fig. 6(a) illustrates various initial conditions of two touching droplets, corresponding to the nine cases listed in Table 1, at Lz/D = 1.5. Specifically, the initial positions of the second droplet is given in the spherical coordinates centered at the first one, where all cases are located in one quadrant-sphere as we do not distinguish between the two droplets (the rest are equivalent due to symmetry). Contrary to the less confined conditions where a bound pair would rotate indefinitely relative to each other under shear,21,45Fig. 6 shows that the droplets tend to reside in the vorticity plane (i.e. the yz plane) with a stable polar angle θ∞ ≈ 79 deg. This is true even if the two droplets are not initially in the same vorticity plane (case 2, 3, 5, 6, 9), or if the second droplet is in the lower hemisphere relative to the first one (case 7, 8, 9). Particularly, in cases 8 and 9, the droplet pair first rotates clockwise, then slides along the wall, before finally reaching the stable orientation (see ESI,† Video 1). The anomalous trajectory is a clear evidence of the influence of the walls, which, together with the attractive depletion force, break the symmetry of the droplet binary interactions.
| Case # | 1 | 2 | 3 | 4 | 5 | 6 | 7 | 8 | 9 |
|---|---|---|---|---|---|---|---|---|---|
| θ (deg) | 70 | 70 | 70 | 89 | 89 | 89 | 91 | 110 | 110 |
| ϕ (deg) | 90 | 45 | 0 | 90 | 45 | 0 | 90 | 90 | 0 |
The above results suggest that, for two droplets subject to an attractive depletion force in strongly confined simple shear flows, only one configuration is dynamically stable. It further implies that, for multiple droplets (N > 2) traveling in a pressure-driven channel with H/D < 4 (H being the channel height, see Section 3.3), a chain-like structure oriented in the flow direction is expected. We remark that the precise configuration of the droplet cluster may depend on the flow conditions and the level of confinement (see Appendix B for further discussion); however, the qualitative picture of the pairwise interaction shall remain unchanged, provided that the number of contact is N − 1. As this is often the case before a compact cluster is formed, we proceed to examine the droplet self-assembly in pressure-driven flows.
3.3 Droplet clusters in pressure-driven channel flows
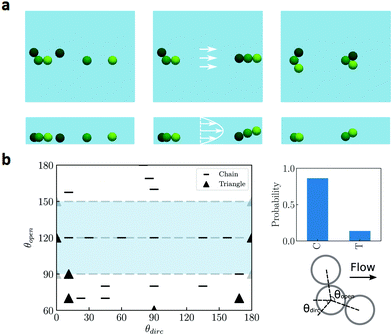
In the following, clusters of three or four droplets are initialized to be in contact (N − 1 contacts for N droplets) and are released into different regions of a microfluidic channel to study their transport behavior. The production of these droplets is omitted, as the step-emulsifier is typically much smaller than the size of the channel, allowing for separation of the two processes.25,35 We note that, although the droplets are already in a cluster initially, their relative rearrangement is still important as it determines the cluster morphology in the final state. The latter results primarily from the droplet–flow interaction and has direct consequence on the photonic properties of the droplet lattice, as we will discuss in details below.As a control case, we simulate three droplets initially located near the bottom of the channel without any depletion forces. This is shown in the first column of Fig. 7a, where the top and bottom panels illustrate the top and side views of the channel (see Fig. 1). The two snapshots are separated by 13.5 convection time units (i.e. ![[small tau, Greek, tilde]](https://www.rsc.org/images/entities/i_char_e0e5.gif) ). Clearly, the droplets quickly scatter as carried by the flow. In a previous work, we theoretically predicted the emergence of singlets and pairs of a dilute particle suspension due to weak particle–particle interactions.40 This example illustrates the separation of a droplet cluster, enhanced by their initial proximity already at N = 3, supporting our theoretical predictions.
). Clearly, the droplets quickly scatter as carried by the flow. In a previous work, we theoretically predicted the emergence of singlets and pairs of a dilute particle suspension due to weak particle–particle interactions.40 This example illustrates the separation of a droplet cluster, enhanced by their initial proximity already at N = 3, supporting our theoretical predictions.
In contrast, when the droplets are bound by a strong depletion force, the same initial condition can lead to a chain structure oriented in the flow direction, see the second column of Fig. 7a. Inspection of the side view reveals the apparent reason: the leading droplets migrate towards the middle of the channel due to the shear, thus experiencing faster flows; the attractive depletion force prevents the cluster from separating into singlets and pairs, yielding the eventual droplet string parallel to the stream. We propose that this shear-induced alignment mechanism is fundamentally due to the confinement-mediated pairwise interaction discussed in the previous section. The difference is that the Poiseuille flow has no simple analytical solution in the presence of droplets (hence the two cannot be compared exactly), and the confinement requirement is halved due to the symmetry of the parabolic velocity profile.
To further test the robustness of the shear-alignment mechanism, we consider multiple initial configurations of the triplet in the same flow. As sketched in Fig. 7b, three touching droplets whose centers are in the same xy plane can be completely described by two angles: θopen, denoting the opening angle of the triplet, and θdirc, denoting the angle between the bisector of the triplet and the direction of the undisturbed flow. For identical droplets, admissible angles are θopen ∈ [60,180] deg, and θdirc ∈ [0,180] deg. Extensive tests show that the chain structure is far more favorable than the closed triangular cluster in Poiseuille flows (see Fig. 7b). One case of the triangle cluster is visualized in the third column of Fig. 7a, where two droplets initially on the sides migrate towards the center, eventually leading to the closure of the open chain. In the vast majority of the cases, however, a straight droplet string aligned with the flow is observed, even if they are close to a triangle initially (note the small θopen cases in Fig. 7b).
The above results confirm that the chain-like structure is indeed the predominant configuration of droplets bound by short-range depletion forces in the Poiseuille flow. Experimentally, this corresponds to strong diluting flows at the channel inlet, where long droplet strings are also observed further downstream (see Shen,35 p. 137). More importantly, our simulations suggest that aligning of the droplets is a 3D shear-induced effect mediated by the confinement. The cross-stream migration of the droplets happens within a much shorter time span than any tangential rearrangement due to the dipolar interactions (cf. Diamant20 and Fouxon et al.40). This is one key difference between our 3D microfluidic channel and other q2D devices.
![[scr O, script letter O]](https://www.rsc.org/images/entities/char_e52e.gif) (10D)¶) as seen in the experiment of Shen et al.?5
(10D)¶) as seen in the experiment of Shen et al.?5
To answer this question, we perform series of simulations of a triplet/quadruplet cluster in a non-uniform channel, similar to the actual entry region of the microfluidic channel (see Fig. 1). Fig. 8 illustrates the cross-sectional design of the channel inlet and the obtained velocity distribution in the central plane. Specifically, the computational domain has a size of (Lx/D,Ly/D,Lz/D) = (4.5,6,3) or (4.5,8,3) depending on the cases, and the ratio of the inflow area to the entire cross-section is Ain/Atot = 1/32, resulting in a highly non-uniform velocity profile. Near the inlet, the peak velocity reaches 46 times the average bulk velocity, then quickly smoothens downstream. To utilise the efficient FFT solver, we again use periodic boundary condition in the spanwise (x) direction, mimicking the effect of diluting flows on the sides. The droplet-to-carrier-fluid density ratio is ![[small rho, Greek, tilde]](https://www.rsc.org/images/entities/i_char_e0e4.gif) 2/
2/![[small rho, Greek, tilde]](https://www.rsc.org/images/entities/i_char_e0e4.gif) 1 = 1.8, corresponding to silicone oil in water. The rest of the governing parameters are Re = 0.1, Ca = 0.025, Fr = 0.0027, and Π = 1.
1 = 1.8, corresponding to silicone oil in water. The rest of the governing parameters are Re = 0.1, Ca = 0.025, Fr = 0.0027, and Π = 1.
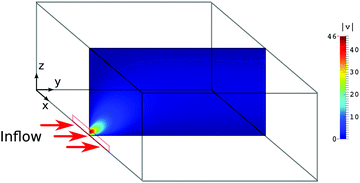 | ||
| Fig. 8 Cross-section of the channel inlet and magnitude of the initial velocity field at the central plane without droplets. The flow is injected from the step-emulsifier (red rectangle), where the droplets (not shown) are produced, into the channel (cf.Fig. 1b). The velocity is normalized such that |v| = 1 corresponds to the bulk flow velocity averaged over the entire channel. | ||
Fig. 9 and 10 demonstrate four representative cases of the self-assembly of three and four droplets, respectively, within a distance of ∼10D from their initial release. Specifically, the droplets in Fig. 9(a) are initialized with θopen = 120 deg and θdirc = 90 deg. According to Fig. 7(b), this triplet would become a chain in the Poiseuille flow. Here, due to the rapid expansion of the flow immediately after the inlet, the trailing droplet undergoes a upward motion to the high velocity region; and if the velocity gained during this sprint is large enough, as in Fig. 9(a), the droplets will soon form a triangle; otherwise, the cluster will at least form a V-shape pointing upstream, as shown in the example of Fig. 9(b). In the latter cases, the final shape of the cluster can be estimated by its orientation relative to the flow (i.e. θopen and θdirc). Instead of simulating a full evolution of the clustering process (which may require a very large simulation domain and long time), one can simply read the last (θopen, θdirc) in the phase diagram of Fig. 7(b). In the case discussed above (Fig. 9(b)), we verified that a triangular cluster is eventually obtained (see ESI,† Video 2).
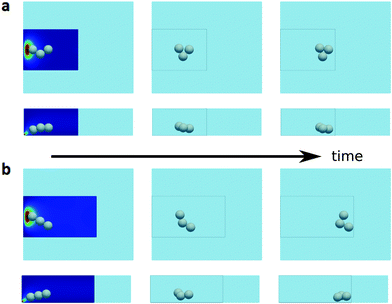 | ||
| Fig. 9 Clustering of three droplets in a channel with a non-uniform inflow. (a and b) Show the top (upper panel) and side (lower panel) view of the droplet positions under two initial conditions at different times. The framed boxes depicts the actual computational domain (see Fig. 8), in comparison to the Poiseuille channel in Fig. 7. The color contours illustrate the velocity magnitude in two planes orthogonal to the viewing direction, where the color legend is the same as in Fig. 8. | ||
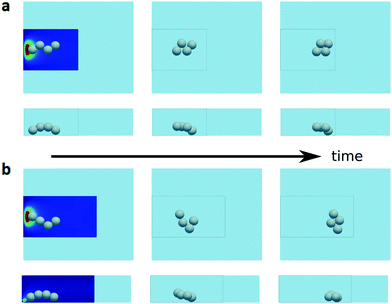 | ||
| Fig. 10 Clustering of four droplets in a channel with a non-uniform inflow. The organization of the plots is similar to Fig. 9. | ||
Similar observations are made for four droplets, for which we show two examples of clustering into diamond shapes in Fig. 10. Here, the initial conditions are similar to those in Fig. 9, only a fourth droplet is appended to the droplet string at a slightly lower vertical position (due to gravity). Note that the vertical coordinates of the droplets as they move downstream are in opposite orders (cf. the middle panels of Fig. 7a). Consequently, the trailing droplets travel faster than the frontal ones, leading to the rapid closure of the cluster into more compact shapes.
The above examples clearly illustrate the direct effect of the non-uniform inflow. If properly matched with the initial droplet configuration, the droplets can form a compact structure within a much shorter distance than by the long-range dipolar interaction. And if the near-field depletion force is strong enough, the obtained compact cluster will stay bound further downstream. On the other hand, if the initial non-uniform inflow fails to bring the droplets sufficiently close within its range of influence, i.e. before viscous diffusion smoothens the initial velocity gradients (typically ∼10D), the shear-induced cross-stream migration can break the clustering of the droplets, eventually leading to chain-like structures. This inflow effect, often neglected in theoretical models,5 is what we propose to be the key reason for the accelerated droplet assembly.
Finally, we remark that the simulated inlet configuration is only one simplified version of the experimental microfluidic channel. To fully reproduce the condition in the actual setup is unrealistic due to the size contrast of the different inlets; however, it is perhaps also unnecessary as the qualitative features of the clustering do not depend on the fine details at the device level. Depending on the governing parameters and the specific operating conditions, it is possible to optimize the geometry of the microfluidic device to achieve higher throughputs of compact droplet clusters at the outlet; however, in practice, tuning of the geometry and inflow conditions may still involve trial and error, since the final self-assembly results from the combination of all 3D effects with no simple parametric dependence. This is possibly the bottleneck of upscaling the current microfluidic strategy to directly create large photonic crystals.
4 Summary and outlook
Motivated by the recent experiment of flow-assisted droplet assembly5 and its potential application for photonic material synthesis, we present a numerical study of finite numbers of non-Brownian droplets in a 3D microfluidic channel. The newly developed numerical methodology30 allows for direct simulations of the two-fluid Navier–Stokes equations, and can account for the short-range attractive depletion force between the drops in a sharp fashion.Under this framework, we considered three types of flows with increasing complexity: quiescent, confined simple shear, and pressure-driven channel flows. The case of quiescent flows allows us to disentangle the effect of the depletion force from that of the flow. The simulation of two to three droplets shows that the approaching time is inversely proportional to the osmotic number Π, a ratio between the surfactant-induced osmotic pressure and the Laplace pressure. We further assembled four to ten droplets using an arbitrary enumeration of the corresponding sphere packing. Without any external driving motion or noise, the obtained structure is purely determined by the closest neighbors in the initial state. This seemingly obvious result lays the basis for our subsequent reasoning.
As we place a droplet pair in the confined simple shear flow, the geometric obstruction combined with the depletion force results in a single steady configuration within the shear plane. The specific value of the alignment angle depends on the level of confinement and the shear rate; for nearly spherical drops between moving plates separated by Lz/D = 1.5, we find the stable polar angle of the pair to be θ∞ ≈ 79 deg. This alignment arises from the bifurcation of the relative trajectories of two droplets constrained by short-range attractive depletion forces. We expect the phenomenon to persist also for more than two drops, at least in the initial state where pairwise interaction dominates.
The dynamics of droplet clusters in the channel flow depends strongly on the homogeneity of the velocity profile. Using the reference Poiseuille flow, we find that the chain-like structure is far more favorable than the triangular cluster despite the latter is mechanically more stable. This is in contrast to q2D systems where dipolar interactions provide the tangential motion destabilizing the droplet string. When the channel height is larger than the droplet diameter, as it is the case here, the dipolar flow becomes insignificant and the shear-induced cross-stream migration is a genuine 3D effect.
To fully understand the fast self-assembly observed in the experiment,5 we also simulated three and four droplets near a step-emulsifier that is much smaller than the bulk channel. Under suitable initial conditions, the triplet/quadruplet indeed forms a more compact cluster from a chain. The nearly reversed inter-droplet motions comparing to the Poiseuille case clearly highlight the effect of the inhomogeneous flow. For practical microfluidic devices aiming for large throughputs, geometric optimization and fine tuning of the flow condition appear to be the key.
The above depicts the complete physical picture of depletion/hydrodynamic interactions of few non-Brownian droplets in a 3D microfluidic channel. Correctly identifying these mechanisms may help experimentalists design microfluidic chips not only for the fabrication of photonic metamaterials, but also other functionalities in general. We note that, although it remains a challenge to directly produce large, defect-free photonic crystals (typically of diamond-like structures) using the current microfluidic setup, alternative strategies have been recently proposed to indirectly assembly droplet lattices composed of smaller clusters,47 or creating hyperuniform droplet ensembles using a similar microfluidic device.11,48 The latter is an active on-going research area, and we hope our findings provide additional guidelines to rationalize the design procedure of these miniature devices.
Conflicts of interest
There are no conflicts to declare.Appendix
A Numerical setup
The simulations are performed in rectangular Cartesian domains with periodic and/or inflow–outflow boundary conditions in two directions and wall boundary condition (i.e. no slip/no penetration) in the third direction. The streamwise and spanwise dimensions of the computational box are at least three times bigger than the initial diameter of the droplet to prevent possible long-range interactions caused by the image droplet. The droplets are resolved by 32 grid points per diameter (i.e. Δx = 1/32) to ensure that the interface curvature and the pressure jump are accurately computed, see Ge et al.30 for detailed verification.As mentioned earlier, the numerical values of Re and Ca are artificially increased to facilitate faster simulations over a larger parameter space. Specifically, we set Re = 10, Ca = 0.005 in Sections 3.1 and 3.3.1; Re = 1, Ca = 0.0025 in Section 3.2; and Re = 0.1, Ca = 0.025 in Section 3.3.2. Fr is effectively ∞ by setting the density ratio equal to unity in all cases except in Section 3.3.2, where it is 0.025. The viscosity ratio is always 1.
In Section 3.1, the suspending fluid has no underlying velocity, so the actual droplet Reynolds number should be rescaled by the ratio of the average approaching speed and the mean velocity of the channel.|| In the case of two droplets, this factor is 1/64 as one droplet moves the distance of Δx within t = 2, as comparing to a displacement of 2 within t = 2. The rescaled Reynolds is then Rer ≈ 0.16.
In Section 3.2, we reduce Re to 1 as the flow is shear-driven, thus the fluid inertia is expected to play a role. Testing various Re, as shown in Fig. 11, we observe that the stable polar angle approaches the same value for Re ≤ 1 under the confinement of Lz/D = 1.5, justifying the use of Re = 1. For Lz/D = 3, however, Re < 1 must be used to obtain the true closed orbit of the two bounding pair (i.e. the obtained θ∞ in that case is an artifact of the inertia).
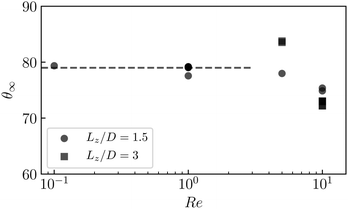 | ||
| Fig. 11 Stable polar angle of two droplets in a shear-driven channel at different Reynolds numbers and confinement, cf. Section 3.2. The dashed line corresponds to θ∞ = 79 deg. | ||
In Section 3.3.1, we increase Re to 10 as the cross-stream migration in Poiseuille flow is a fairly robust phenomenon, only weakly dependent on the Reynolds number in the sense that a lower Re imposes a longer time scale. Since we are interested in the final shape of the droplet cluster – a qualitative result rather than the detail dynamics – Re = 10 is used to speed up the simulations (the computational time step is roughly inversely proportional to Re).
Finally, in Section 3.3.2 where the entry region of the microfluidic channel is considered, we set the lowest Reynolds number to mimic the actual flow environment. Here, the Capillary number is amplified to 0.025, larger than in the previous cases but still well within the low Capillary limit. As a visual proof, the droplets shown in Fig. 9 all remain nearly spherical during the convection. Further reducing Ca shall have no effect but refine the sphericity of the drops.
B Confinement-mediated interaction
For unbounded simple shear flows, we know that a pair of spherical particles/droplets can undergo either closed orbits or open-and-symmetric trajectories.21,45 With moderate confinements, swapping trajectories are also possible.46 In Section 3.2, we show that strong geometric confinements combined with an attractive depletion force lead to pair alignments in the vorticity plane; particularly, the obtained stable polar angle is θ∞ = 79 deg for Lz/D = 1.5. Below, we provide further evidence to support the symmetry-breaking argument and give a qualitative explanation of the observed θ∞.In Fig. 11, we obtain non-converging values of θ∞ at Lz/D = 3. Under this confinement, the binding droplets in the low-Reynolds-number limit exhibit cyclic motions as if they are unconfined (see ESI,† Video 3). Clearly, the center-to-center depletion force does not play any role since the hydrodynamic stresses already keep the droplet together; the droplets deform slightly, but are essentially spherical. As we double the confinement, i.e. reducing Lz/D by half, Fig. 12 illustrates the relative trajectories in the absence of depletion forces (see also ESI,† Videos 4 and 5). Here, only a quadrant of the plane in the vicinity of the first droplet is shown due to symmetry. Comparing to less confined conditions, the droplet pair displays only passing and swapping trajectories, while the Batchelor–Green type of closed orbit is completely suppressed (cf. Fig. 3 in ref. 46). Arguably, such a result is obvious as the droplets cannot simply rotate in the same vorticity plane, whereas 3D rotations would violate either time-reversal or mirror symmetry.** Regardless the reason, the results demonstrate that droplets cannot stay together indefinitely due solely to the hydrodynamic interactions. More importantly, plotting the position corresponding to the angle of 79 deg (the red dot in Fig. 12) in the trajectory map clearly rationalizes the existence of a stable polar angle: the second droplet would travel in either direction above or below the saddle point; with a radial depletion force, only at θ∞ = 79 deg can it stay dynamically stable.
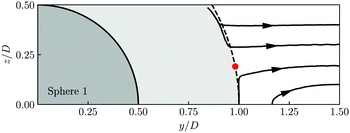 | ||
| Fig. 12 Relative trajectories of the second sphere in the vorticity plane of the simple-shear channel under confinement Lz/D = 1.5. The pair is not constrained by any depletion force. The shaded region denotes locations inaccessible to the second droplet if it is perfectly spherical. Overlap of the trajectories with the shades is a result of the small droplet deformation. The red dot corresponds to the polar angle of 79 deg, cf.Fig. 6. | ||
Acknowledgements
The work is supported by the Microflusa project. This effort receives funding from the European Union Horizon 2020 research and innovation programme under Grant Agreement No. 664823, as well as the Swedish Research Council through grants VR2013-5789 and VR2017-4809. Part of the computer time is provided by the SNIC (Swedish National Infrastructure for Computing). We thank Joshua Ricouvier and Bingqing Shen for providing the experimental details. Z. G. also thanks Mehdi Niazi, Alexander Leshansky, Åsmund Ervik, Zorana Zeravcic, and Tsvi Tlusty for illuminating discussions.References
- K. M. Ho, C. T. Chan and C. M. Soukoulis, Phys. Rev. Lett., 1990, 65, 3152–3155 CrossRef CAS PubMed.
- G. Subramanian, V. N. Manoharan, J. D. Thorne and D. J. Pine, Adv. Mater., 1999, 11, 1261–1265 CrossRef CAS.
- E. W. Seelig, B. Tang, A. Yamilov, H. Cao and R. Chang, Mater. Chem. Phys., 2003, 80, 257–263 CrossRef CAS.
- S. Wong, V. Kitaev and G. A. Ozin, J. Am. Chem. Soc., 2003, 125, 15589–15598 CrossRef CAS PubMed.
- B. Shen, J. Ricouvier, F. Malloggi and P. Tabeling, Adv. Sci., 2016, 3, 1600012 CrossRef PubMed.
- S. Sacanna and D. J. Pine, Curr. Opin. Colloid Interface Sci., 2011, 16, 96–105 CrossRef CAS.
- A. van Blaaderen, Science, 2003, 301, 470–471 CrossRef CAS PubMed.
- G. Meng, N. Arkus, M. P. Brenner and V. N. Manoharan, Science, 2010, 327, 560–563 CrossRef CAS PubMed.
- C. H. J. Evers, J. A. Luiken, P. G. Bolhuis and W. K. Kegel, Nature, 2016, 534, 364 CrossRef PubMed.
- Y. Yin, Y. Lu, B. Gates and Y. Xia, J. Am. Chem. Soc., 2001, 123(36), 8718–8729 CrossRef CAS PubMed.
- J. Ricouvier, R. Pierrat, R. Carminati, P. Tabeling and P. Yazhgur, Phys. Rev. Lett., 2017, 119, 208001 CrossRef PubMed.
- A. McMullen, M. Holmes-Cerfon, F. Sciortino, A. Y. Grosberg and J. Brujic, Phys. Rev. Lett., 2018, 121, 138002 CrossRef CAS PubMed.
- B. Cui, H. Diamant, B. Lin and S. A. Rice, Phys. Rev. Lett., 2004, 92, 258301 CrossRef PubMed.
- T. Beatus, T. Tlusty and R. H. Bar-Ziv, Nat. Phys., 2006, 2, 743 Search PubMed.
- P. J. A. Janssen, M. D. Baron, P. D. Anderson, J. Blawzdziewicz, M. Loewenberg and E. Wajnryb, Soft Matter, 2012, 8, 7495–7506 RSC.
- W. E. Uspal, H. Burak Eral and P. S. Doyle, Nat. Commun., 2013, 4, 2666–2674 CrossRef PubMed.
- N. Desreumaux, J.-B. Caussin, R. Jeanneret, E. Lauga and D. Bartolo, Phys. Rev. Lett., 2013, 111, 118301 CrossRef PubMed.
- L. Zhu and F. Gallaire, J. Fluid Mech., 2016, 798, 955–969 CrossRef.
- T. Beatus, I. Shani, R. H. Bar-Ziv and T. Tlusty, Chem. Soc. Rev., 2017, 46, 5620–5646 RSC.
- H. Diamant, J. Phys. Soc. Jpn., 2009, 78, 041002 CrossRef.
- G. K. Batchelor and J. T. Green, J. Fluid Mech., 1972, 56, 375–400 CrossRef.
- C. Coulliette and C. Pozrikidis, J. Fluid Mech., 1998, 358, 1–28 CrossRef.
- A. J. Griggs, A. Z. Zinchenko and R. H. Davis, Int. J. Multiphase Flow, 2007, 33, 182–206 CrossRef CAS.
- P. J. A. Janssen and P. D. Anderson, Phys. Fluids, 2007, 19, 043602 CrossRef.
- I. Chakraborty, J. Ricouvier, P. Yazhgur, P. Tabeling and A. M. Leshansky, Lab Chip, 2017, 17, 3609–3620 RSC.
- G. Batchelor, An introduction to fluid dynamics, Cambridge University Press, 2000 Search PubMed.
- J. Eastoe and J. Dalton, Adv. Colloid Interface Sci., 2000, 85, 103–144 CrossRef CAS PubMed.
- S. Asakura and F. Oosawa, J. Polym. Sci., 1958, 33, 183–192 CrossRef CAS.
- P. Melby, A. Prevost, D. Egolf and J. Urbach, Phys. Rev. E: Stat., Nonlinear, Soft Matter Phys., 2007, 76, 051307 CrossRef PubMed.
- Z. Ge, J.-C. Loiseau, O. Tammisola and L. Brandt, J. Comput. Phys., 2018, 353, 435–459 CrossRef.
- M. Dodd and A. Ferrante, J. Comput. Phys., 2014, 273, 416–434 CrossRef.
- R. Fedkiw, T. Aslam, B. Merriman and S. Osher, J. Comput. Phys., 1999, 152, 457–492 CrossRef CAS.
- U. Schumann and R. A. Sweet, J. Comput. Phys., 1988, 75, 123–137 CrossRef.
- Z. Ge, ICLS-release, https://github.com/GeZhouyang/ICLS-release, accessed: 2018-11-27.
- B.-Q. Shen, PhD thesis, Université Pierre et Marie Curie – Paris VI, 2014.
- M. Holmes-Cerfon, SIAM Rev., 2016, 58, 229–244 CrossRef.
- E. D. Klein, R. W. Perry and V. N. Manoharan, Phys. Rev. E, 2018, 98, 032608 CrossRef CAS.
- E. Mani, W. Lechner, W. K. Kegel and P. G. Bolhuis, Soft Matter, 2014, 10, 4479–4486 RSC.
- S. Das, J. Riest, R. G. Winkler, G. Gompper, J. K. G. Dhont and G. Nägele, Soft Matter, 2018, 14, 92–103 RSC.
- I. Fouxon, Z. Ge, L. Brandt and A. Leshansky, Phys. Rev. E, 2017, 96, 063110 CrossRef PubMed.
- G. I. Taylor, Proc. R. Soc. A, 1934, 146, 501–523 CrossRef CAS.
- C. J. Lin, K. J. Lee and N. F. Sather, J. Fluid Mech., 1970, 43, 35–47 CrossRef.
- G. K. Batchelor and J. T. Green, J. Fluid Mech., 1972, 56, 401–427 CrossRef.
- A. Zinchenko, J. Appl. Math. Mech., 1983, 47, 37–43 CrossRef.
- A. Zinchenko, J. Appl. Math. Mech., 1984, 48, 198–206 CrossRef.
- M. Zurita-Gotor, J. Bławzdziewicz and E. Wajnryb, J. Fluid Mech., 2007, 592, 447–469 Search PubMed.
- K. I. Morozov and A. M. Leshansky, Langmuir, 2019, 35(11), 3987–3991 CrossRef CAS PubMed.
- S. Torquato and F. H. Stillinger, Phys. Rev. E: Stat., Nonlinear, Soft Matter Phys., 2003, 68, 041113 CrossRef PubMed.
Footnotes |
| † Electronic supplementary information (ESI) available. See DOI: 10.1039/c8sm02479k |
| ‡ A notable exception is the dynamics of two droplets in unbounded linear flows solved analytically by Batchelor and Green.21 |
| § The density and viscosity ratios between the drop and the carrier fluids are assumed to be unity. See Appendix A for the detailed numerical setup. |
¶ Dipolar interactions under similar confinement require at least ![[scr O, script letter O]](https://www.rsc.org/images/entities/char_e52e.gif) (100D) distance to see any clustering effect, see Fouxon et al.40 (100D) distance to see any clustering effect, see Fouxon et al.40 |
| || We keep the same definition of the Reynolds number due to bookkeeping reasons in the numerical code. |
| ** The symmetry argument, however, is only a necessary but not sufficient condition, since droplet sliding on the walls already invokes effects of the noise (otherwise two droplets stuck by the walls should be regarded as an admissible solution). |
| This journal is © The Royal Society of Chemistry 2019 |

