
 Open Access Article
 This Open Access Article is licensed under a Creative Commons Attribution-Non Commercial 3.0 Unported Licence
Collagen networks determine viscoelastic properties of connective tissues yet do not hinder diffusion of the aqueous solvent
Frank
Sauer
 *a,
Linda
Oswald
a,
Angela
Ariza de Schellenberger
b,
Heiko
Tzschätzsch
b,
Felix
Schrank
b,
Tony
Fischer
c,
Jürgen
Braun
d,
Claudia Tanja
Mierke
c,
Rustem
Valiullin
e,
Ingolf
Sack
b and
Josef Alfons
Käs
a
*a,
Linda
Oswald
a,
Angela
Ariza de Schellenberger
b,
Heiko
Tzschätzsch
b,
Felix
Schrank
b,
Tony
Fischer
c,
Jürgen
Braun
d,
Claudia Tanja
Mierke
c,
Rustem
Valiullin
e,
Ingolf
Sack
b and
Josef Alfons
Käs
a
aSoft Matter Physics Division, Peter Debye Institute for Soft Matter Physics, Linnestr. 5, Leipzig, Germany. E-mail: sauer@phyisk.uni-leipzig.de
bDepartment of Radiology, Charité-Universitätsmedizin, Charitéplatz 1, Berlin, Germany
cBiological Physics Division, Peter Debye Institute for Soft Matter Physics, Linnestr. 5, Leipzig, Germany
dInstitute of Medical Informatics, Charité-Universitätsmedizin, Hindenburgdamm 30, Berlin, Germany
eApplied Magnetic Resonance Division, Felix Bloch Institute for Solid State Physics, Linnestr. 5, Leipzig, Germany
First published on 20th March 2019
Abstract
Collagen accounts for the major extracellular matrix (ECM) component in many tissues and provides mechanical support for cells. Magnetic Resonance (MR) Imaging, MR based diffusion measurements and MR Elastography (MRE) are considered sensitive to the microstructure of tissues including collagen networks of the ECM. However, little is known whether water diffusion interacts with viscoelastic properties of tissues. This study combines highfield MR based diffusion measurements, novel compact tabletop MRE and confocal microscopy in collagen networks of different cross-linking states (untreated collagen gels versus additional treatment with glutaraldehyde). The consistency of bulk rheology and MRE within a wide dynamic range is demonstrated in heparin gels, a viscoelastic standard for MRE. Additional crosslinking of collagen led to an 8-fold increased storage modulus, a 4-fold increased loss modulus and a significantly decreased power law exponent, describing multi-relaxational behavior, corresponding to a pronounced transition from viscous-soft to elastic-rigid properties. Collagen network changes were not detectable by MR based diffusion measurements and microscopy which are sensitive to the micrometer scale. The MRE-measured shear modulus is sensitive to collagen fiber interactions which take place on the intrafiber level such as fiber stiffness. The insensitivity of MR based diffusion measurements to collagen hydrogels of different cross-linking states alludes that congeneric collagen structures in connective tissues do not hinder extracellular diffusive water transport. Furthermore, the glutaraldehyde induced rigorous changes in viscoelastic properties indicate that intrafibrillar dissipation is the dominant mode of viscous dissipation in collagen-dominated connective tissue.
Introduction
Extracellular matrix (ECM) properties determine the microenvironment in which cells survive, grow and migrate, and influence chemical and mechanical signalling pathways.1–5In vivo characterization of ECM properties by magnetic resonance imaging (MRI) requires quantitative imaging methods sensitive to biophysical tissue interactions which occur on micro-scales and which can normally not be resolved by in vivo imaging methods.6MR based diffusion measurements, such as diffusion weighted imaging (DWI), and magnetic resonance elastography (MRE) are known to be sensitive to the microstructure of biological tissues by measurement of water transport and viscoelastic behaviour, respectively. Water diffusion quantified by MR based diffusion measurements has many clinical applications including the detection of ischemic lesions, nerve fiber tracking or tumor characterization7–10 and has also been reported to be to some extent sensitive to the microstructure of collagen gels.11 In contrast to other techniques used to characterize the diffusive properties of ECM-like networks, such as fluorescence recovery after photobleaching (FRAP) or fluorescence correlation spectroscopy (FCS), MR based diffusion measurements are not dependent on small fluorescent molecules and optically accessible sample geometry.
Shear modulus, i.e. ‘stiffness’, quantification by MRE can precisely detect hepatic fibrosis better than tissue-morphology based imaging markers, fat fraction quantification or DWI.12–15 The sensitivity of MRE to hepatic fibrosis originates from the progressive infiltration and replacement of liver tissue with collagen-rich connective tissue in the course of the disease.16 This process yields a tremendous increase of the amount of ECM from less than 1% in healthy liver to more than 30% in cirrhosis.17 Previous work by MRE in liver samples indicates that the shear modulus predominately increases due to the growing number of bridges and crosslinks established in the collagen network during fibrosis progression18 or tissue fixation.19 In fact, cross-linking of very sparse networks (less than 1% volume fraction) can turn liquid tissues into solid materials with rigid body properties.20
The effect hydrodynamic drag has on water diffusion in sparse fibrous networks found in tissues remains unclear. Densely packed structures that contain predominantly cells such as neuronal21 or muscle tissues22 clearly demonstrate restricted water diffusion. Nevertheless, DWI has recently been proposed as a surrogate marker of tissue stiffness in the fibrotic liver.23,24Vice versa, MRE has been paired with diffusion tensor imaging (DTI) for the measurement of anisotropic stiffness along fiber pathways.25
This study addresses MR based collagen network characterization by MRE and MR based diffusion measurements. In biophysics collagen-based hydrogels have been established as scaffolds for investigating 3D cell–matrix interactions,26 due to their physiologic relevance as well as tunability and adaptability. Their unique mechanical properties arising from intrinsic crosslinks prominent to a certain extent in native gels.27 In more detail, intermolecular as well as intra- and intermicrofibrillar crosslinks are formed by aldehyde groups created by the conversion of specific lysine and hydroxylysine residues to peptide bound aldehydes by lysyloxydase.28
In this study, we are using a well-established ECM model system29–31 consisting of collagen gels produced from a mixture of type 1 bovine skin and type 1 rat tail collagen in order to simulate the ECM of human connective tissue.32 To mimic fibrosis induced tissue stiffening additional collagen crosslinking is induced by glutaraldehyde (GA) treatment.33 The idea dates back to the 60ies where it has been shown that GA shows the best efficiency regarding chemical and thermal stability.34 GA reacts primarily with amino groups of proteins. Since the gap between these amine groups on adjacent fiber or fiber bundle surfaces is too large to be bridged by GA crosslinks the additional crosslinks are mostly introduced within fibers rather than in between fibers,35 indicating that the crosslinking of directly touching fibers such as knots or decussating fibers might be possible. The current techniques to characterize the viscoelastic behaviour of collagen networks have some disadvantages. The gold standard plate rheology requires relatively large samples, can be hampered by surface artefacts and is very difficult to use for combination studies with live cells.36 AFM-based microrheology can only probe the surface of the network.37 For microrheological approaches it still remains unclear how the shear modulus can be quantitatively extracted.38,39 MRE is ideally suited to precisely measure the shear modulus deep in the bulk of a collagen network. We will use a compact table-top MRE device which has advantages concerning ease of cost and use and allows stiffness measurements which can be related to results reported for in vivo tissue. Since our MRE console operates above the frequency range of conventional oscillatory rheology we are using heparin gel phantoms to demonstrate the consistency of both methods. In contrast to traditional phantoms such as ultrasound gels, heparin gel as a pharmaceutical is superior regarding reproducibility and international comparability and has thus already been used as viscoelastic phantom material in MRE for hardware calibration and model fitting.40,41 Its properties are characterized by a viscoelastic power law behavior characteristic for multi-relaxational materials and can thus better simulate biological tissue properties than pure rubber-like materials.42,43
We have conducted small-sample MRE tests for the viscoelastic characterization of prototypical differently strong crosslinked collagen networks, combined with MR based diffusion measurements and confocal microscopy as well as pore size analysis of the networks. Our aim is to quantify parameter changes in MRE and MR based diffusion measurements under well-controlled conditions and to identify the length scale of structural changes in model collagen networks to which both modalities are sensitive.
Methods
Collagen gel preparation & additional crosslinking
The collagen gels were made by a mixture of bovine skin type 1 and rat tail type 1 (2![[thin space (1/6-em)]](https://www.rsc.org/images/entities/char_2009.gif) :1) collagen which mimics ECM properties of human connective tissue.32 Collagen gel concentration was 3 mg ml−1. For the preparation of 1 ml gel, 0.25 ml of rat tail collagen type 1 (4 mg ml−1, Lot#161088, Serva, Heidelberg, Germany) and 0.5 ml of bovine skin collagen type 1 (4 mg ml−1, Lot#0606E, Biochrom, Berlin, Germany) were mixed with a phosphate buffer solution consisting of 171 μl 1 M disodium hydrogen phosphate (Na2HPO4), 50 μl dH2O and 29 μl 1 M sodium dihydrogen phosphate (NaH2PO4·H2O) to set the final pH value to 7.4.29,44 To inhibit gel polymerization during preparation pre-cooled solutions were used and the mixing was done on ice. Pipetted into a pre-cooled carrier of choice the collagen solution was immediately transferred to an incubator for polymerization at 37 °C and 95% humidity for 1.5 hours. Afterwards, the polymerized gels were rinsed three times with PBS and incubated overnight also with PBS.29
:1) collagen which mimics ECM properties of human connective tissue.32 Collagen gel concentration was 3 mg ml−1. For the preparation of 1 ml gel, 0.25 ml of rat tail collagen type 1 (4 mg ml−1, Lot#161088, Serva, Heidelberg, Germany) and 0.5 ml of bovine skin collagen type 1 (4 mg ml−1, Lot#0606E, Biochrom, Berlin, Germany) were mixed with a phosphate buffer solution consisting of 171 μl 1 M disodium hydrogen phosphate (Na2HPO4), 50 μl dH2O and 29 μl 1 M sodium dihydrogen phosphate (NaH2PO4·H2O) to set the final pH value to 7.4.29,44 To inhibit gel polymerization during preparation pre-cooled solutions were used and the mixing was done on ice. Pipetted into a pre-cooled carrier of choice the collagen solution was immediately transferred to an incubator for polymerization at 37 °C and 95% humidity for 1.5 hours. Afterwards, the polymerized gels were rinsed three times with PBS and incubated overnight also with PBS.29
Additional network crosslinking was carried out according to Lang et al. 201533 by adding 0.2% glutaraldehyde solution (diluted in PBS, stock 25%, Serva, Heidelberg, Germany) to the polymerized gels for 1 hour, followed by 12 consecutive washing steps with PBS over the next 24 hours.
Confocal microscopy & pore size analysis
The gels were polymerized as described above in a 24 Well μ-Plate (ibidi, Martinsried, Germany). Afterwards, the gels were stained overnight with a 10 μg ml−1 5-(and-6)-carboxytetramethylrhodamine, succinimidyl ester (TAMRA-SE) solution, followed by three rinsing steps with PBS. Imaging was done with a confocal laser scanning microscope (TCS SP8, Leica, Wetzlar, Germany). Confocal stacks were recorded with a HC PL APO CS2 40×/1.10 WATER objective (Leica, Wetzlar, Germany) with water immersion under illumination of a 561 nm DPSS-laser. The total stack dimensions were (151.99 × 151.99 × 177.57) μm3 consisting of 402 slices with 2024 × 2024 pixels resolution. The Leica Application Suite X (3.1.5.16308, Leica, Wetzlar, Germany) was used as recording and image displaying software. Image stacks were taken at least 50 μm above the bottom of the gels and 5 different stacks were taken for the untreated and GA treated collagen gels each around the center position of different wells. All images were deconvoluted with Huygens Essential (v.16.10, Scientific Volume Imaging, The Netherlands) using the “Huygens essential automatic, best resolution” approach. After the deconvolution the pixel size in xy-direction could be reduced by a factor of 4 to achieve faster computing without sacrificing the quality of the outcome. The three-dimensional (3D) pore size, a robust measure to describe gel topology,45 was determined by using an improved 3D implementation of Bubble Analysis.46 To overcome light absorption and diffraction of the very large image volumes, we first denoised each image plane separately using total variation denoising47 and binarized the confocal images per plane using an adaptive local threshold and morphological operations to refine the binarization. Subsequently, local maxima of a Euclidean Distance Transform were determined, representing 3D pore location and radii, displaying the mesh size of the collagen gels.Tabletop MRE
A tabletop MRI scanner (Pure Devices GmbH, Würzburg, Germany) with a 10 mm bore and 0.5 T permanent magnet was customized by addition of an external gradient amplifier (DC 600, Pure Devices GmbH, Würzburg, Germany) and an integrated MRI system-controlled piezoelectric driver (Piezosystem Jena, Jena, Germany). The piezoelectric driver (∅, 20 mm; length, 72 mm) was fed with a sinusoidal alternating current from the gradient amplifier covering a frequency range from 200 and 5700 Hz. Glass tubes (untreated soda-lime glass, ∅, 8.0 mm; length, 15 cm) were coupled onto the piezoelectric driver from their topside and were sealed at the bottom with a PVC-plug containing an additional NB70-rubber sealing ring. A disk (R = 4.0 mm, thickness = 1 mm) of closed cell PVC foam was fixated on top of the bottom plug, functioning as a shock absorber to decouple the sample from vibrations of the sample holder bottom to enable wave excitations originating only from the sides of the glass tube into the sample. The vibrations inside the glass cylinder were polarized along the main axis of the tube due to the constrained axial motion direction of the actuator. The amplitude of the piezoelectric driver was adjusted for each measured frequency that the resulting peak strain was always between 1% and 2%, ensuring linear collagen displacements. An overview over the setup and the sample geometry is depicted in Fig. 3a and b respectively. 500 μl of the actual sample was filled in the tubes from the top resulting in a sample height of 11 mm. To avoid premature collagen fibrillation and fiber alignment by flow the sample holders were cooled down in an ice bath during the filling process. The tubes were sealed against evaporation with foam plugs at the top. The tabletop scanner has an inbuilt temperature control which held the sample constantly at 37 °C during the measurements.Driving frequencies ranged from 200–800 Hz for untreated and from 200–2000 Hz for GA treated collagen samples. The range of frequencies was adapted for each sample to meet the resolution requirements of the shear wave. The upper frequency limit related to the image resolution. Given a spatial resolution of 0.15 mm over 8.0 mm diameter of the sample provided 53 pixels of support for a full wave profile. This resolution supported the shortest wavelengths of at least 0.6 mm, assuming that four voxels were necessary to accurately fit a complex sine function to a discrete waveform. This limit is still several magnitudes over the characteristic length scale of collagen gels, e.g. persistence length48 and pore size (see results), ensuring the measurement of bulk properties. In the low frequency range, the largest wavelength to be properly resolved was on the order of the sample diameter (i.e., 8.0 mm). For each sample the viscoelastic dispersion function was acquired with at least seven frequencies.
Imaging sequence, acquisition parameters and post processing were identical to the method explained in greater detail in a previous publication.19 In brief, data acquisition was carried out twice at each frequency and averaged, resulting in a total acquisition time for a single frequency of 22.6 min. The samples were imaged using the following acquisition parameters: repetition time = 2000 ms, echo time = 42 ms, slice thickness = 3 mm, matrix size = 64 × 64, field of view = (9.6 × 9.6) mm2, voxel size = (0.15 × 0.15 × 3) mm3. The acquired phase data were unwrapped and Fourier-transformed in time to extract complex-valued wave images at driving frequency f (Fig. 3d and e). All data points of the z-deflection (parallel to the cylinder axis) were mapped onto cylindrical coordinates and averaged over the azimuthal angle, yielding a single profile along the radial coordinate (Fig. 3f and g). The resulting profiles were fitted by the analytical solution of shear waves in a z-infinite cylinder49,50 as described previously,19 where the Bessel function of first kind yields the desired result of the fit, the complex wave number k* = k′ + ik′′.
As described by Tzschätzsch et al.,51 we translated k* into two real-valued quantities related to elastic stiffness (shear wave speed c) and inverse attenuation (shear wave penetration rate a), both in the dimension of m s−1:
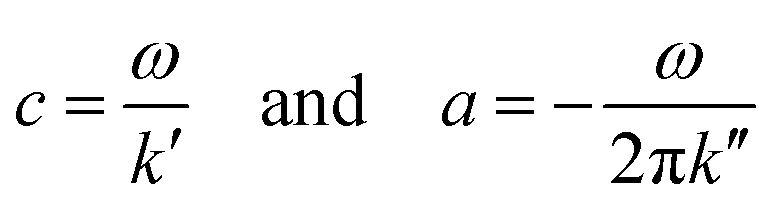 | (1) |
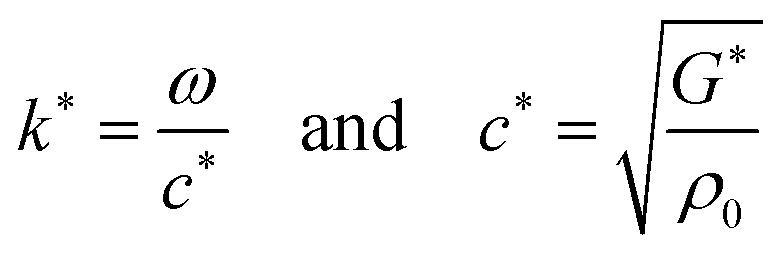
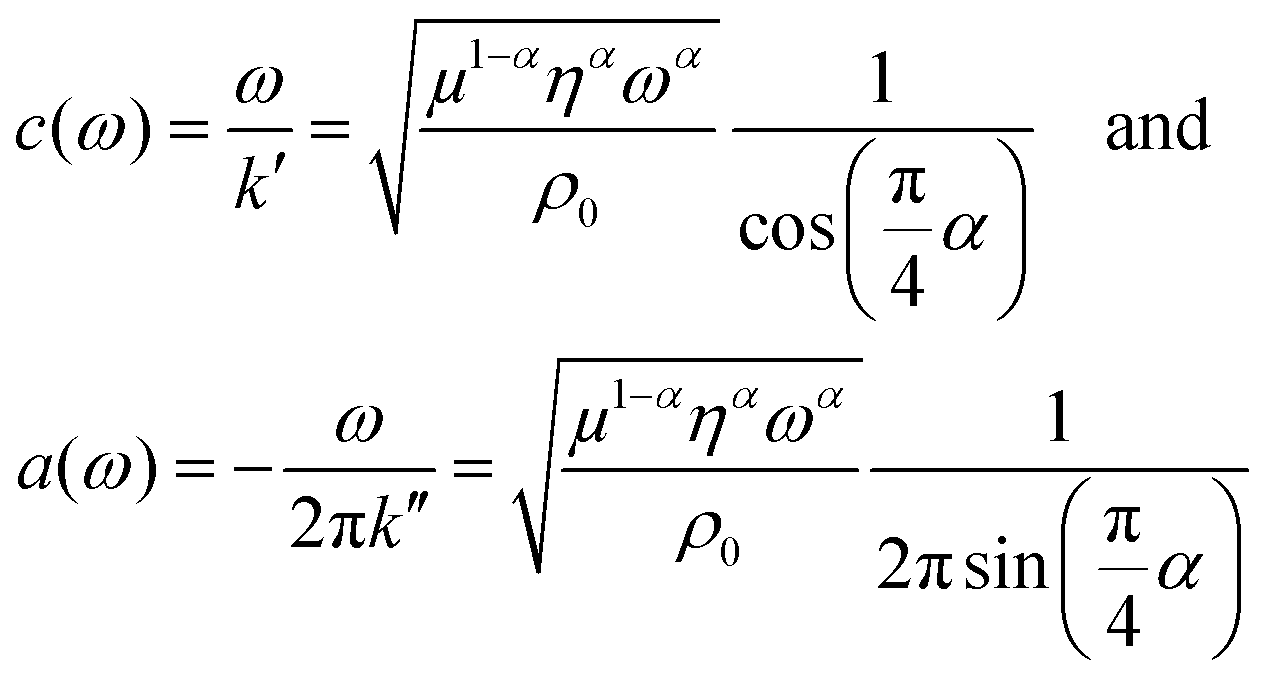
As described in a previous study,19 we directly fitted c and a by a viscoelastic model to derive shear modulus-related parameters instead of first calculating a complex shear modulus G* from k* and then fitting G*. We chose this approach because c and a are the primary results of the Bessel fit instead of G*, which is normally obtained from direct inversion-based MRE. Our model of choice was the fractional element (FE), which predicts a monotonic increase in storage and loss modulus over the full frequency range based on only two parameters: μ (shear modulus in the dimension kPa) and α (dimensionless power law exponent). Based on a fractal ladder and introduced by Helmut Schiessel and Alexander Blumen in 199652 it has among others shown applicability to describe the frequency dependent rheological behavior of eukaryotic cells.42 In this model the complex shear modulus G* = G′ + iG′′ is described as:13
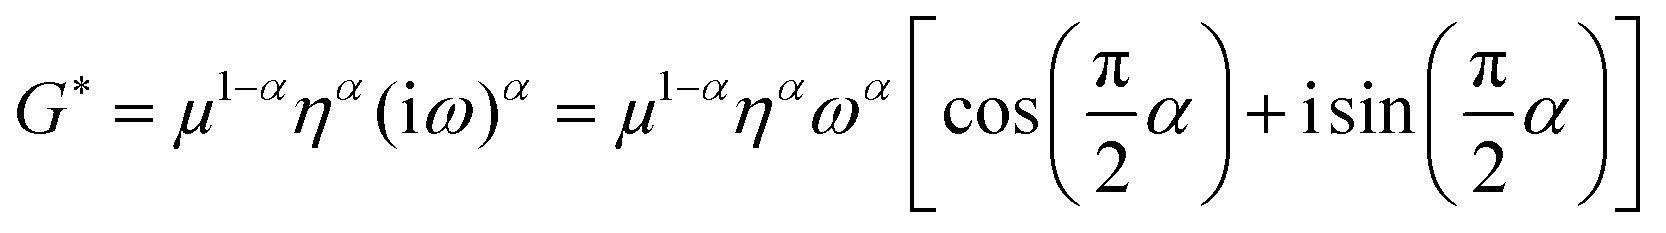 | (2) |
 | (3) |
 | (4) |
Heparin phantom – classical shear rheology vs. MRE
To validate our tabletop MRE device against standard plate rheology heparin gel (Heparin Ratiopharm 180000 Gel, Ratiopharm, Ulm, Germany) with known viscoelastic power law properties40,41 was used. This gel consists mostly of Carbomer 980 (polyacrylic acid), trometamol (TRIS), macrogol glycerolhydroxystearate, propylene glycol and isopropanol with the eponymous active agent only accounting for less than 1% of the gel volume. MRE experiments were performed with the same sample geometry, measurement protocol and processing steps as explained above. The range of driving frequencies was 120–2000 Hz. For the shear rheology experiments an Anton Paar Physica MCR301 (Anton Paar GmbH, Graz, Austria) rheometer with plate–plate configuration (diameter = 50 mm, gap height = 2 mm) was used. The frequency sweeps at 2% strain covered a range from 0.5–80 Hz. Data evaluation was done on-site with the software Rheoplus v.3.40 (Anton Paar GmbH, Graz, Austria).
MR based diffusion study
Diffusion measurements were performed by means of pulsed field gradient (PFG) 1H NMR using a 100 MHz spectrometer equipped with a homebuilt PFG unit allowing for the application of strong gradient pulses with the intensities g up to 35 T m−1 and diffusion times td as low as 1 ms.53,54 The measurements were conducted with a 13-interval pulse sequence (see Fig. 2a) permitting for an efficient compensation of the disturbing eddy currents upon the application of the strong magnetic field gradient pulses.55 Typical parameters of the pulse sequence were: τ = 2 ms for the separation between the π/2 and π pulses, Δ = 10 ms for the separation between the π/2 pulses defining the diffusion time td, δ = 300 μs for the duration of the gradient pulses. The temperature of the measurements was set to (25 ± 0.1) °C. The NMR spin echo signal intensities were measured for different values of b, where b = γ2g2δ2td with γ = 2.67 × 10⁸ T−1 s−1 being the gyromagnetic ratio and td = Δ + 7τ/2 + δ/6 is the diffusion time of the 13-interval pulse sequence. Our experiments were performed with three different diffusion times: 10 ms, 40 ms and 160 ms. The spin-echo signals S(b), attenuated due to diffusion in the presence of the inhomogeneous magnetic field (g = dB/dz), were measured by incrementing the linear gradient intensity and by keeping all other parameters of the pulse sequence constant. The apparent diffusion coefficients (ADC) of our samples were conventionally obtained as a slope of ln(S(b)) plotted vs. different b values. The typical precision of the ADC determination is less than 5%. With obtained ADC and given td the diffusion length ld can be calculated according to .
.
Results
No visible differences in network architecture and in particular pore size, i.e. mesh size, can be detected in the cLSM image stacks of untreated and GA treated collagen gels (Fig. 1a and b). An analysis covering more than 22.000 pores from 5 different samples for each untreated and GA treated collagen revealed that the average pore size (mean ± SD) of the gels after glutaraldehyde treatment is with (4.44 ± 1.46) μm almost identical as without glutaraldehyde treatment (4.58 ± 1.50) μm. Thus, differences in the mechanical behavior between GA treated and untreated samples can be only due to changes in inter- as well as intra-fiber crosslinking and a consequential increase in filament bending stiffness.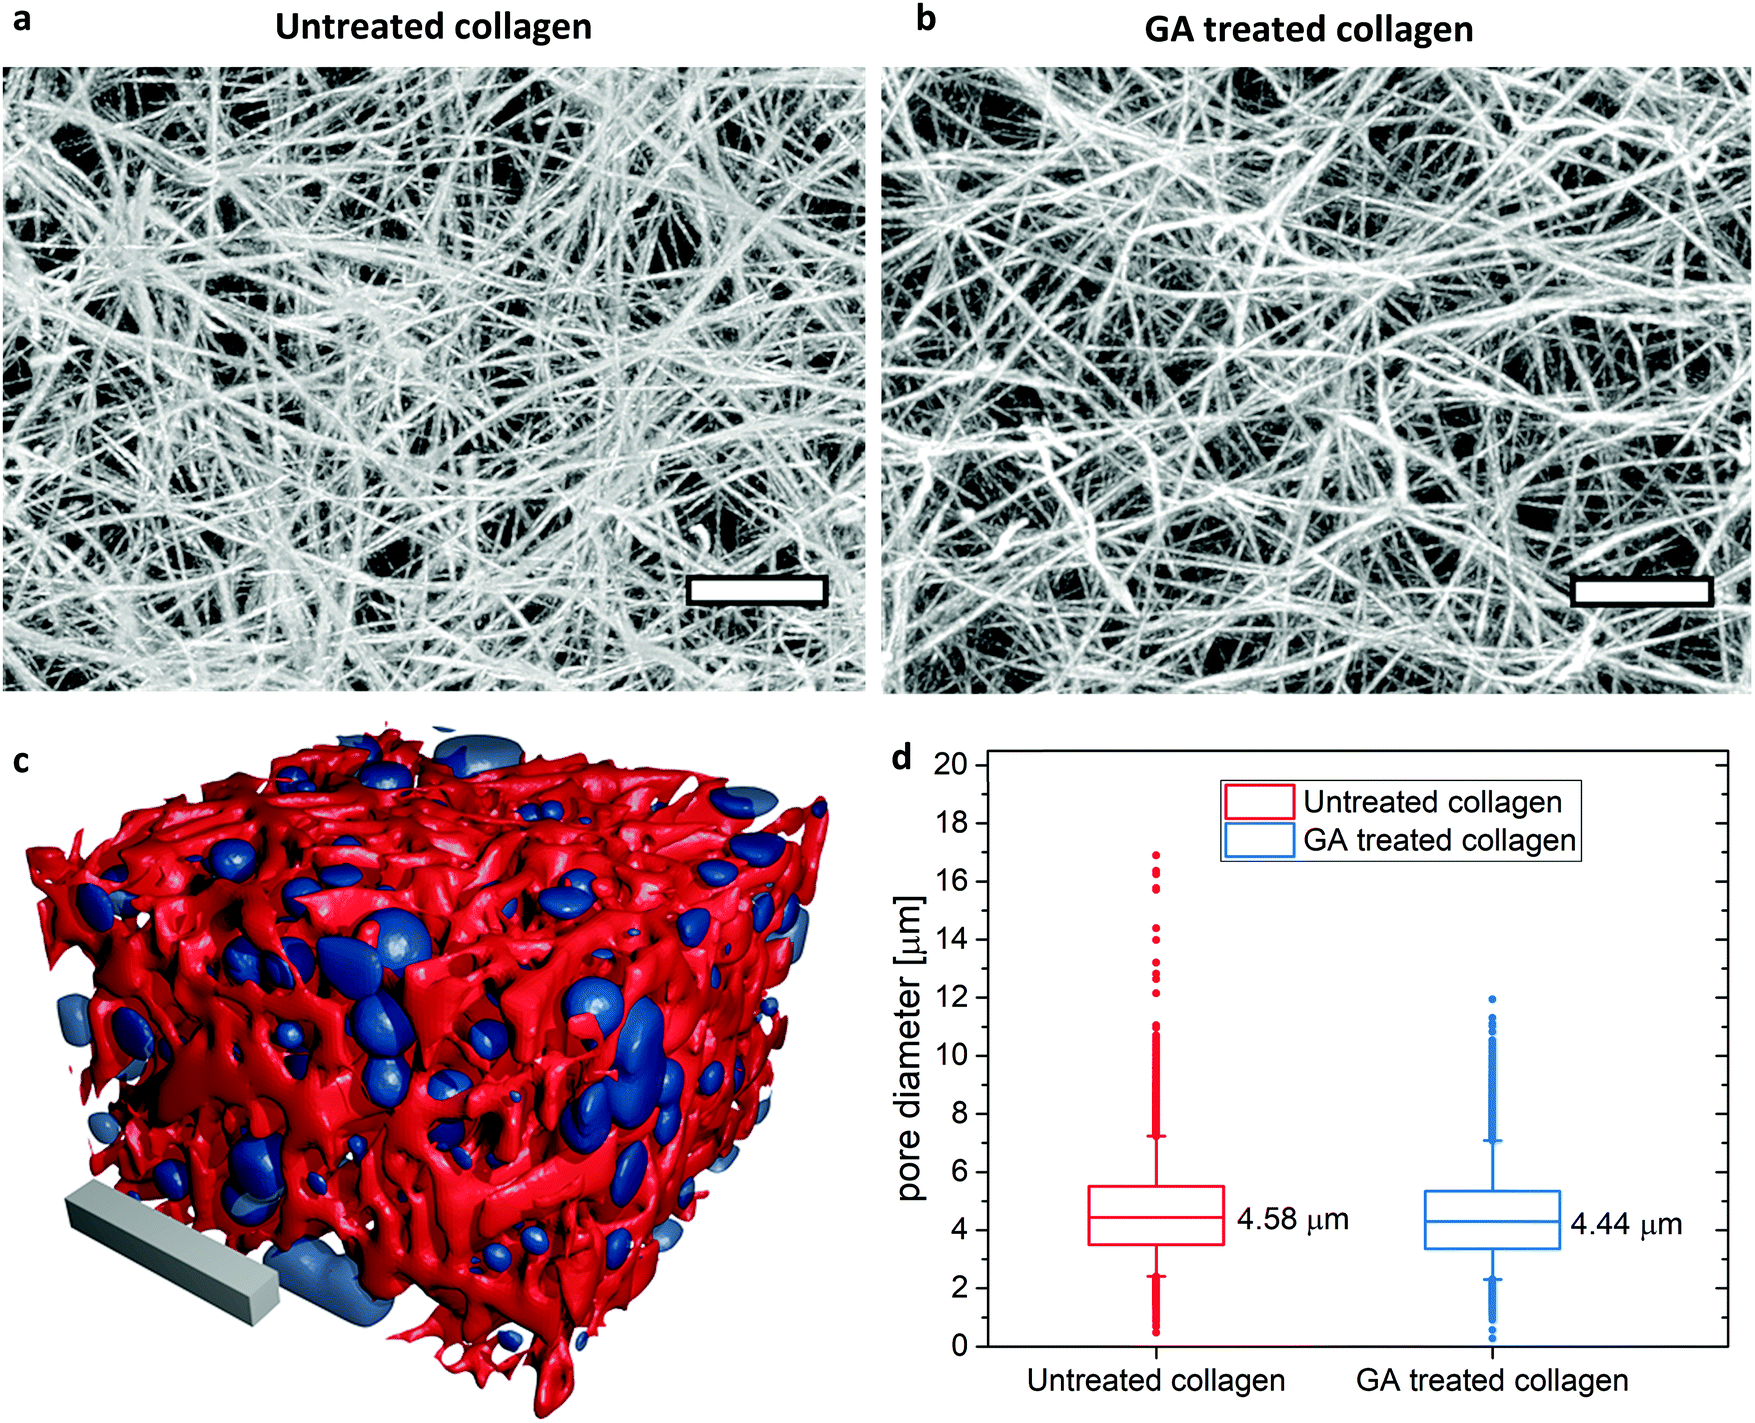 | ||
| Fig. 1 Overall gel structure and pore size determination in LSM stacks of untreated (a) and GA treated (b) TAMRA stained collagen gels. Depicted are maximum intensity projections of 200 slices covering 75 μm in z-direction. Scale bars represent 10 μm. The gel structure looks identical. (c) Illustration of a reconstructed untreated collagen gel (red) and the corresponding detected pores (blue). Scale bar: 20 μm. The surface plot is created with Fiji/ImageJ69,70 and rendered in blender.71 (d) Pore size results: depicted are the mean values of >22.000 detected pores from 5 different positions for each gel. Box sizes 25% and 75%. Whiskers: 5–95%. | ||
Fig. 2b displays the signal intensities obtained for different b values at the diffusion times td indicated in the inset for a typical normalized spin-echo attenuation. The linearity of the plots in Fig. 2b and the independence from the diffusion time reveals that normal diffusion occurs, meaning the mean-squared-displacements growing linearly with diffusion time. ADCs obtained for all samples are shown in Table 1 and reveal that ADCs of water in untreated and GA treated collagen gels have no significant difference. Three different samples were measured for each type, where the untreated collagen gels have an ADC of (2.133 ± 0.062) × 10−3 mm2 s−1, and the glutaraldehyde treated samples have an ADC of (2.173 ± 0.094) × 10−3 mm2 s−1. Since the concentration of collagen responsible for the creation of the open pored network only accounts for approx. 0.3% of the sample volume it is not unexpected that the measured ADCs were very close to the unhindered diffusion in pure samples of water (2.5 ± 0.1) × 10−3 mm2 s−1, PBS (2.4 ± 0.1) × 10−3 mm2 s−1 or the 200 mM buffer solution that was used during the preparation of the collagen gels (2.3 ± 0.1) × 10−3 mm2 s−1. The obtained diffusion lengths ld were in the range from 4.6 μm to 18.6 μm and thus larger than the average pore size of the gels. Together with measured ADCs close to bulk properties this alludes to unhindered water diffusion in our samples.
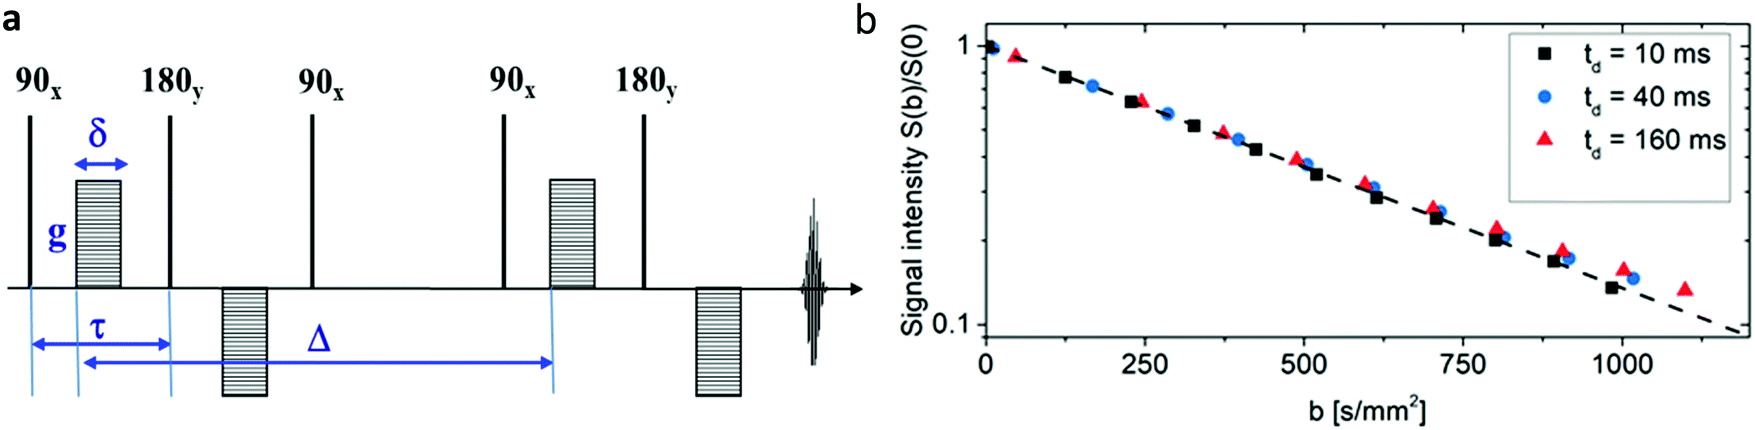 | ||
| Fig. 2 Water diffusion in collagen gels: (a) 13-interval NMR pulse sequence with bipolar gradients used for the diffusion measurements presented in this study.55 (b) Normalized spin-echo diffusion attenuation functions for a sample of GA treated collagen measured with different diffusion times td indicated in the figure inset. The solid line shows a slope equal to the ADC. The collapse of all spin-echo attenuation functions to one master curve is an indication of normal, i.e. unhindered, diffusion of water in collagen networks. | ||
| ADC in 10−3 mm2 s−1 | |
|---|---|
| Untreated collagen | 2.133 ± 0.062 (N = 3) |
| GA treated collagen | 2.173 ± 0.094 (N =3) |
| dH2O at 25 °C | 2.5 ± 0.1 (N = 1) |
| PBS | 2.4 ± 0.1 (N = 1) |
| Collagen buffer (200 mM) | 2.3 ± 0.1 (N = 1) |
Fig. 3c demonstrates the consistency of MRE and oscillatory plate rheology in heparin gels as a multi-relaxational viscoelastic reference material with a rheological behavior very similar to biological cells.42,56 As expected for a power law rheological behavior the plate rheometer measured viscoelastic dispersion within 0.5 to 80 Hz can readily be extrapolated into the frequency range of MRE (G′ and G′′ derived from eqn (3)) from 120 to 2000 Hz and afterwards showed a relatively good congruency with a single FE fit according to eqn (2) with the model parameters of μ = (513 ± 28) Pa and α = 0.28 ± 0.01 over the entire frequency range.
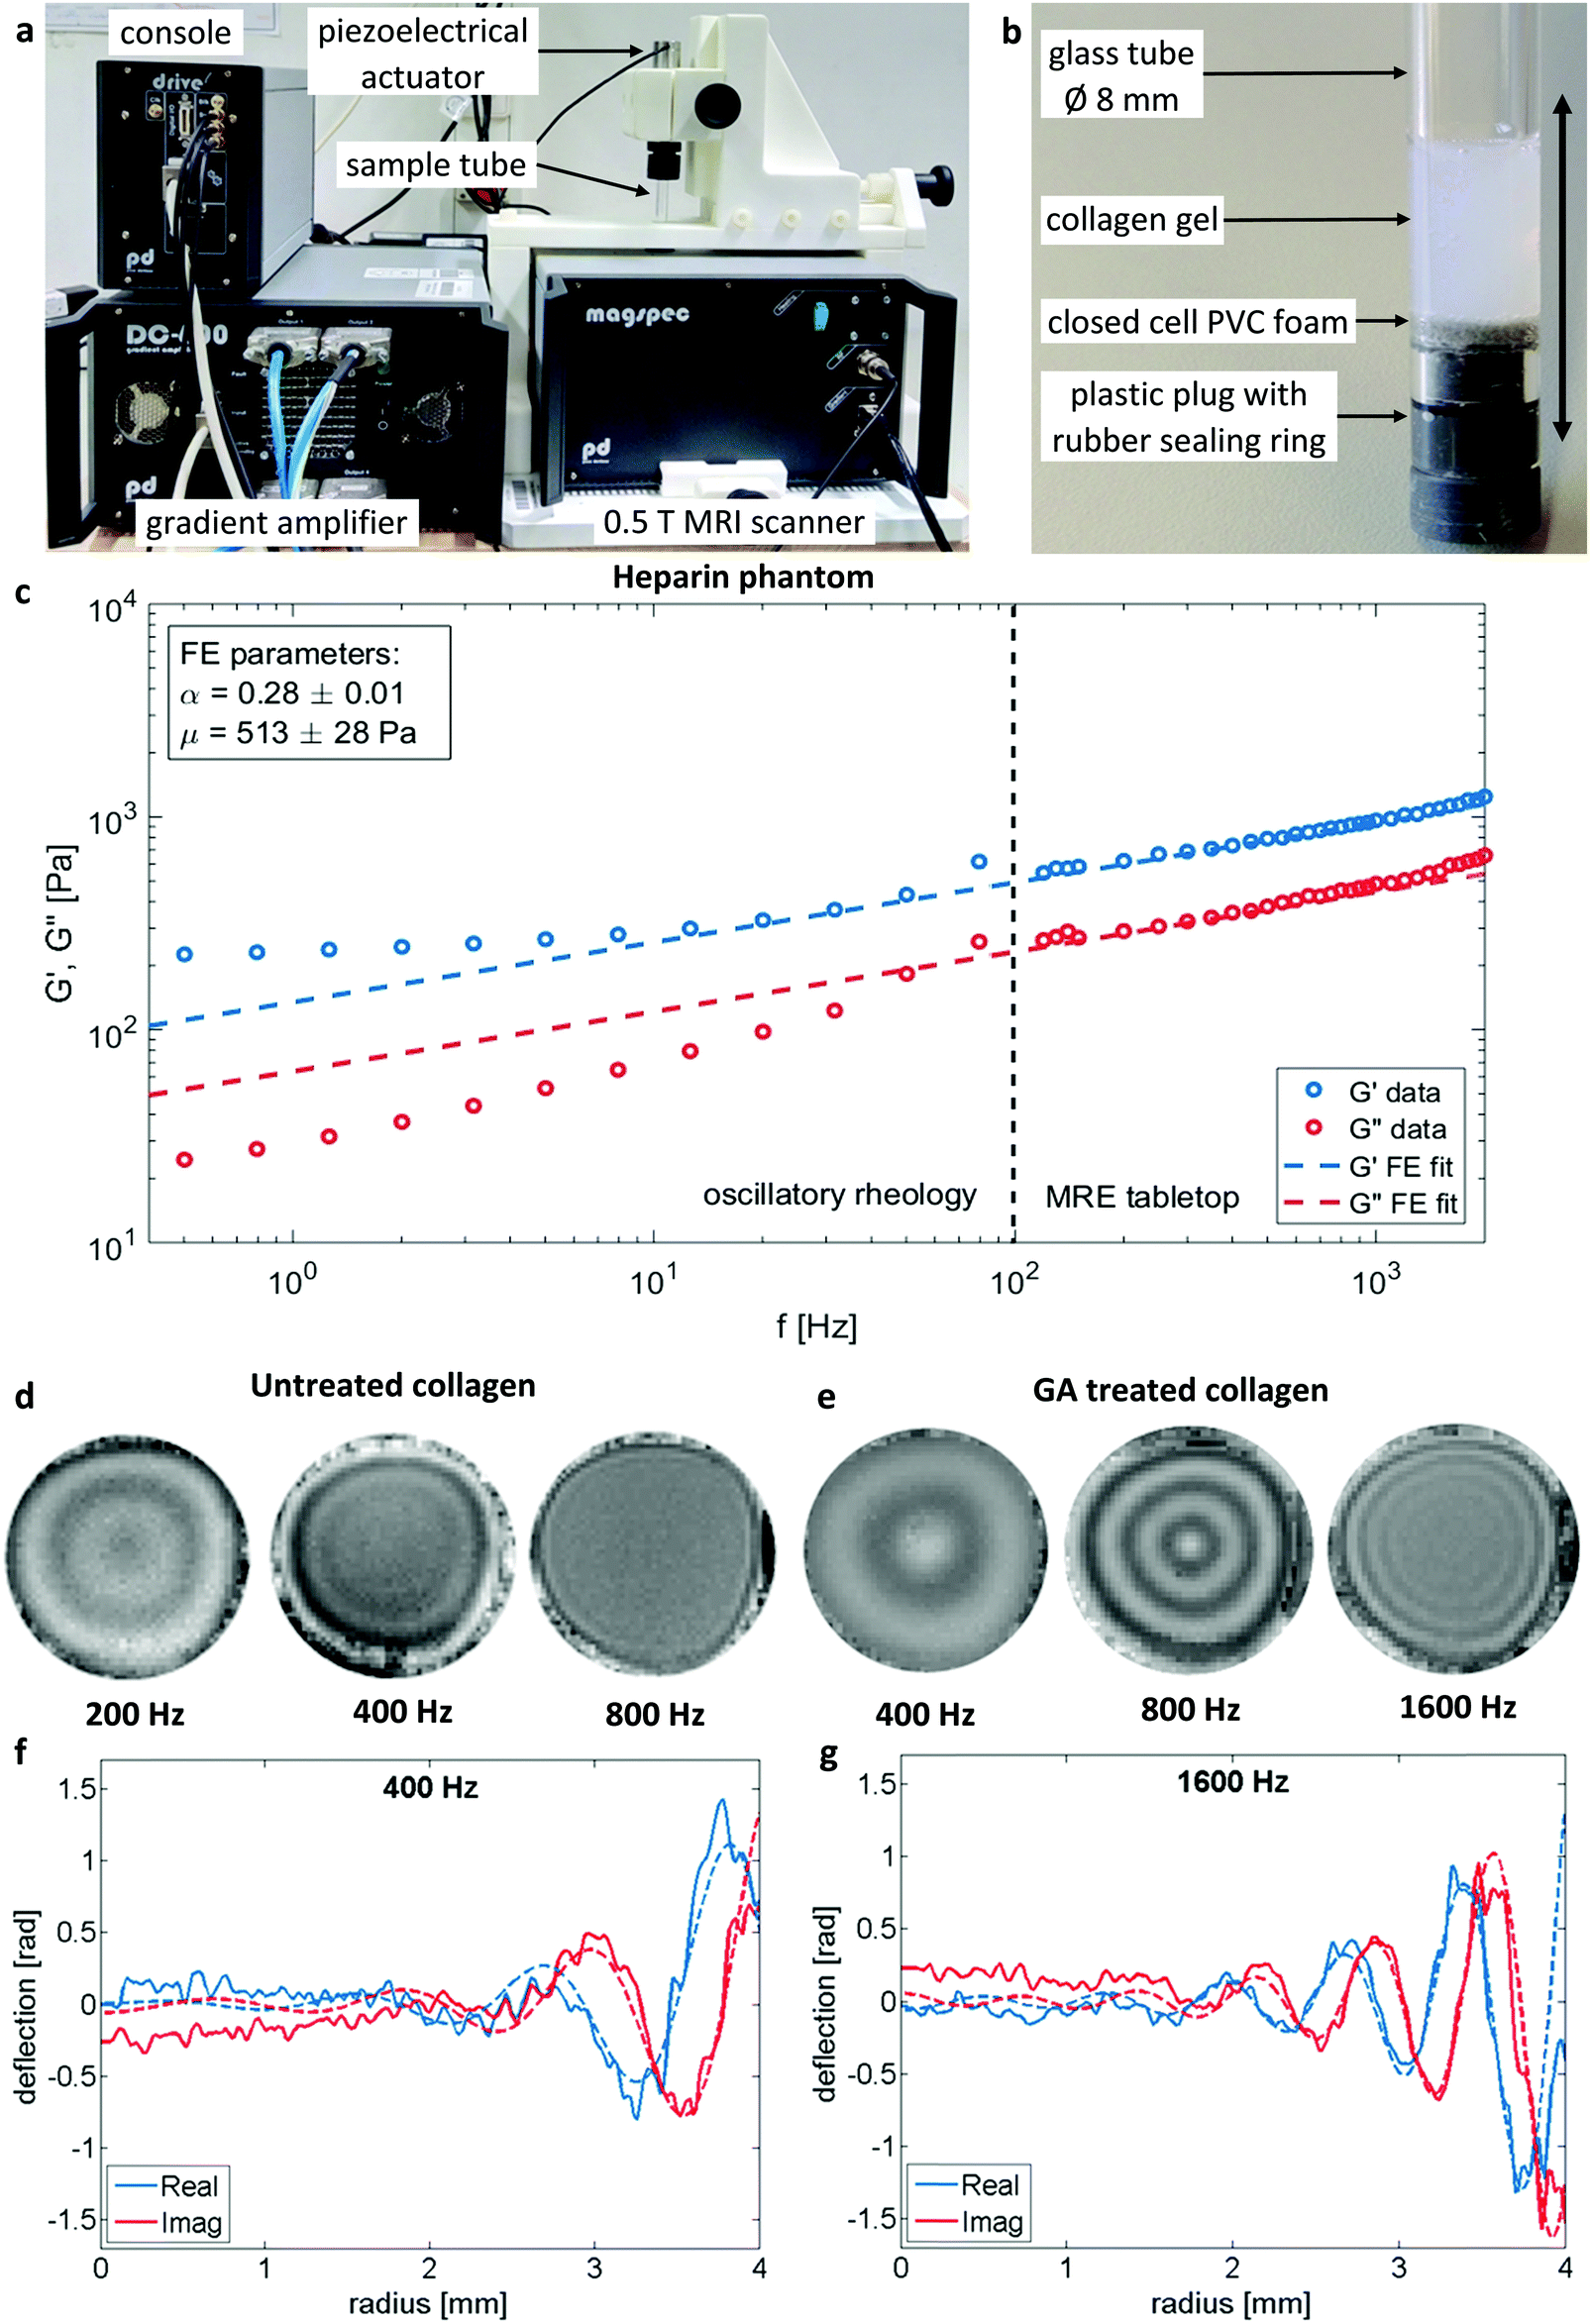 | ||
| Fig. 3 Overview over the tabletop MRE system (a) with 0.5 T permanent magnet MRI scanner, piezoelectric actuator with mounted sample tube, four channel gradient amplifier and console with signal preamplifier (not shown) and link to computer control system (not shown). Detailled view of MRE sample (b): glass tube with collagen gel sealed from the bottom with plastic plug with rubber ring. A small layer of closed cell PVC foam is added as a shock absorber. The vibration polarisation is indicated by the double-headed arrow. Comparison of the rheological data (c) obtained by standard oscillatory plate and MRE rheology on the example of a heparin hydrogel. G′ and G′′ extending over frequency range for both measurement types and afterwards fitted by the FE model according to eqn (2) accounting for all data points. MRE wavefields for selected frequencies for untreated (d) and GA treated (e) collagen samples illustrate the altered material behavior by the change of wavelengths. Slice thickness 3 mm. Sample diameter 8 mm. Signal averaged over azimuthal angle and corresponding Bessel-fits (dashed lines) for selected frequencies (f and g, respectively). | ||
An overview of wave images of untreated and GA treated collagen gels obtained with the table top MRE device at multiple frequencies is shown in Fig. 3d and e. The frequency range accessible to the measurements is dependent on the material properties of the samples that determine the wave length of the recorded wave. This can be clearly seen by comparing the wave images at 400 Hz for the untreated and the GA treated collagen gel. The untreated collagen gel has a wavelength of approx. 1.1 mm, whereas the treated gel has a wavelength of approx. 2.7 mm. The wave speed c and the penetration rate a were obtained from the Bessel fits at individual frequencies for untreated (Fig. 4a) and GA treated collagen gels (Fig. 4b). The dashed lines in Fig. 4a and b represent the FE fits for c(f) and a(f) according to eqn (4). Glutaraldehyde treatment fixes a sample, i.e. it drastically strengthens intrafilament connections and crosslinks. Consequentially, this freezes out relaxation through internal dynamics. The multi-relaxational FE model does not fit as well to rubber-elastic permanently crosslinked polymer gels which also explains the deviations between FE-model (dashed line) and data in Fig. 4b and why the frequency dependent behavior of these samples is better fitted by a Kelvin–Voigt model57 (solid line), for which the complex shear modulus is derived as:
| G* = μ + iηω | (5) |
 | ||
| Fig. 4 Shear wave speed c and shear wave penetration rate a plotted over frequency for an untreated (a) and a GA treated (b) collagen gel. Presented data is each from one single measurement and representative FE fits (dashed lines) and an additional fit based on the Kelvin–Voigt model (KV fit, solid line) for GA treated collagen demonstrate the GA induced changes. Model independent storage (G′) and loss modulus (G′′) obtained from eqn (3)vs. frequency for the collagen samples before (c) and after (d) additional glutaraldehyde treatment show the transition from a softer liquid power law behavior to a solid elastic rubber plateau. The fits are from the same nature as in (a) and (b). The displayed data shows the mean + SD (shaded regions) for N = 7 individual samples for each condition. | ||
| Untreated collagen | GA treated collagen | ||
|---|---|---|---|
| Pore size | (4.58 ± 1.50) μm | (4.44 ± 1.46) μm | |
| FE-model parameters | μ | (35.2 ± 4.9) Pa | (1032 ± 84) Pa |
| α | 0.380 ± 0.021 | 0.123 ± 0.018 | |
| KV-model parameters | μ | — | (1.33 ± 0.18) kPa |
| η | — | (0.068 ± 0.016) Pa s | |
| Model independent averaged storage and loss modulus | G′ | (155 ± 22) Pa | (1327 ± 75) Pa |
| G′′ | (113 ± 24) Pa | (447 ± 210) Pa | |
Discussion
Here we demonstrate that tabletop MRE can be an important extension to classical rheological measurements and represents an easy-to-use alternative while accessing a frequency spectrum above the range of conventional plate rheology. It overcomes the difficulty of inadequate coupling between sample and plate by polymerizing the sample directly inside the sample holder and reflecting the coupling quality in the recorded wave images (see Fig. 3d and e). The sample environment of the tabletop MRE avoids in particular problems typical for biological samples such as sample evaporation at physiological temperatures or protein denaturation at the air–water interface and enables long-term measurements of viscoelastic bulk properties under physiological conditions. In the future, our approach will be essential to solve the enigma of rheological measurements in biological cells and tissues.The results obtained by different state-of-the-art techniques can differ by several orders of magnitude.58,59 MRE can be readily performed in vivo and the observed rheological behavior can be cross checked by plate rheology using suitable MRE phantoms.
In polymer physics the viscous part of viscoelastic behavior is greatly attributed to intrafibrillar dissipation and hydrodynamic drag with even minimal amounts of untangled polymers significantly changing viscoelastic properties.60 Assuming sufficient polymer concentration and coupling with the solvent, the latter can be reflected in altered diffusive behavior of the solvent molecules.
Thus, a combination of MR based diffusion measurements and MRE is an ideal research tool to investigate to what extent hydrodynamics contributes to viscous dissipation in soft matter. Our tabletop device technologically permits to combine simultaneous MR based diffusion and MRE measurements.
In dilute solutions of conventional flexible polymers, the increase in viscosity with respect to the pure solvent is attributed to dissipation of the polymer's Brownian motion through hydrodynamic drag. This means that there is a frictional coupling between solvent and collagen filaments. According to free volume models61 increasing polymer concentration will eventually hinder free solvent diffusion. Our results for collagen networks clearly show that water diffusion remains unhindered by the presence of collagen fibers. This is not surprising considering the large pore size and the low volume fraction that collagen fibers take up and is in accordance with the dilute regime from aforementioned free volume models.
While other techniques such as FRAP and FCS were able to detect hindered diffusion in dense collagen-based structures in dependency of the probe size,62,63 the reliance of these techniques on optically accessible slices for the fluorescent probes and the different corresponding ADC regimes renders them to be hardly comparable to MR based diffusion measurements in bulk materials. However, a possible extension of our current experiments would be to use our combination to measure denser ECM substitutes (i.e. centrifuged or artificially aligned collagen samples) with an increased amount of biological or trapped water to identify multiple different diffusion timescales as has been demonstrated before on Amyloid Fibrils.64
From a biological perspective, a regulated extracellular diffusive transport is essential for morphogen gradients to facilitate correct embryonal development, while under hindered nutrient flow solid tumors develop necrotic cores. The semiflexible nature of collagen networks, i.e. filament stiffness, assures that connective tissue can be mechanically stable and strong as well as simultaneously provide a large pore size that does not hinder diffusive transport.
In accordance to a previous microrheological study,65 our data show that collagen networks exhibit a viscoelastic power law behavior in a frequency range not accessible by classical shear rheology and, moreover, that this power law behavior is almost completely reduced by additional treatment with GA. It is essential for connective tissue to protect from mechanical trauma by viscous dissipation. This dampening cannot be caused by the hydrodynamic drag of the polymer strands through the surrounding solvent. It can only be caused by internal dynamics of the collagen fibers themselves. In our experiments the GA treatment fixes the filaments and thus freezes intrafibrillar motions in the filaments66–68 which ultimately leads to a loss of power law behavior in these collagen gels and favors the interpretation that intrafibrillar friction within the filaments is the dominant effect that causes multi-relaxation dissipation.
Our findings convincingly demonstrate that the combination of MR based diffusion measurements and MRE can be a powerful tool in polymer and biophysics. We have shown that MRE is sensitive to viscoelastic alterations in low-volume fraction hydrogel networks while MR based diffusion measurements are known to be sensitive to restricted diffusion in cellular systems. Therefore, our experimental approach permits combined studies on how the water diffusion in ECM-like networks is influenced by interspersed objects that hinder or restrict water diffusion (e.g. cells, spheroids, beads) while simultaneously measuring the effects on the viscoelastic properties of the samples via MRE. Furthermore, the experimental roadmap presented in this study can be easily transferred to other hydrogel systems of interest in polymer physics, such as F-actin and other cytoskeletal filaments. Finally, the combination of the presented techniques seems to be suitable for the in vivo characterization of both viscoelastic and diffusion related properties of tumors and their surrounding microenvironment.
Conflicts of interest
The authors confirm that there are no known conflicts of interest associated with this publication and there has been no significant financial support for this work that could have influenced its outcome.Acknowledgements
This work was supported by the European Research Council (ERC-741350), the European Union's Horizon 2020 (668039, FORCE), the DFG (323490432), the DFG SFB 1340 (372486779, Matrix in Vision) and the DFG Research Training Group (GRK2260, BIOQIC). We also thank Nazar Shrivastava for the excellent help with the MR based diffusion measurements.References
- C. T. Mierke, F. Sauer, S. Grosser, S. Puder, T. Fischer and J. A. Käs, NMR Biomed., 2018, 31, e3831 CrossRef PubMed.
- T. A. Ulrich, E. M. de Juan Pardo and S. Kumar, Cancer Res., 2009, 69, 4167–4174 CrossRef CAS PubMed.
- J. Brabek, C. Mierke, D. Rosel, P. Vesely and B. Fabry, Cell Cell Commun. Signaling, 2010, 8, 22 CrossRef PubMed.
- J. Sapudom, S. Rubner, S. Martin, T. Kurth, S. Riedel, C. T. Mierke and T. Pompe, Biomaterials, 2015, 52, 367–375 CrossRef CAS PubMed.
- T. Fischer, N. Wilharm, A. Hayn and C. T. Mierke, Convergent Sci. Phys. Oncol., 2017, 3, 044003 CrossRef.
- Y. Chen, S. J. Dodd, M. A. Tangrea, M. R. Emmert-Buck and A. P. Koretsky, Sci. Rep., 2013, 3, 1879 CrossRef PubMed.
- A. E. Baird, A. Benfield, G. Schlaug, B. Siewert, K.-O. Lövblad, R. R. Edelman and S. Warach, Ann. Neurol., 1997, 41, 581–589 CrossRef CAS PubMed.
- B. Stieltjes, W. E. Kaufmann, P. C. M. van Zijl, K. Fredericksen, G. D. Pearlson, M. Solaiyappan and S. Mori, NeuroImage, 2001, 14, 723–735 CrossRef CAS PubMed.
- K. Nasu, Y. Kuroki, T. Tsukamoto, H. Nakajima, K. Mori and M. Minami, Am. J. Roentgenol., 2009, 193, 438–444 CrossRef PubMed.
- L. J. Wilmes, R. L. McLaughlin, D. C. Newitt, L. Singer, S. P. Sinha, E. Proctor, D. J. Wisner, E. U. Saritas, J. Kornak, A. Shankaranarayanan, S. Banerjee, E. F. Jones, B. N. Joe and N. M. Hylton, Acad. Radiol., 2013, 20, 581–589 CrossRef PubMed.
- M. Takeuchi, M. Sekino, N. Iriguchi and S. Ueno, Magn. Reson. Med. Sci., 2004, 3, 153–157 CrossRef PubMed.
- P. E. Sijens, Eur. Radiol., 2009, 19, 2594–2607 CrossRef PubMed.
- D. Klatt, C. Friedrich, Y. Korth, R. Vogt, J. Braun and I. Sack, Biorheology, 2010, 47, 133–141 Search PubMed.
- G. H. Jajamovich, H. Dyvorne, C. Donnerhack and B. Taouli, PLoS One, 2014, 9, e97355 CrossRef PubMed.
- H. A. Dyvorne, G. H. Jajamovich, O. Bane, M. I. Fiel, H. Chou, T. D. Schiano, D. Dieterich, J. S. Babb, S. L. Friedman and B. Taouli, Liver Int., 2016, 36, 659–666 CrossRef CAS PubMed.
- R. Bataller and D. A. Brenner, J. Clin. Invest., 2005, 115, 209–218 CrossRef CAS PubMed.
- I. Sack and T. Schaeffter, Quantification of Biophysical Parameters in Medical Imaging, Springer International Publishing, Cham, 2018 Search PubMed.
- R. Reiter, C. Freise, K. Jöhrens, C. Kamphues, D. Seehofer, M. Stockmann, R. Somasundaram, P. Asbach, J. Braun, A. Samani and I. Sack, J. Biomech., 2014, 47, 1665–1674 CrossRef PubMed.
- J. Braun, H. Tzschätzsch, C. Körting, A. Ariza de Schellenberger, M. Jenderka, T. Drießle, M. Ledwig and I. Sack, Magn. Reson. Med., 2018, 79, 470–478 CrossRef CAS PubMed.
- J. Guo, O. Posnansky, S. Hirsch, M. Scheel, M. Taupitz, J. Braun and I. Sack, Phys. Med. Biol., 2012, 57, 4041–4053 CrossRef PubMed.
- J. Helenius, L. Soinne, J. Perkiö, O. Salonen, A. Kangasmäki, M. Kaste, R. A. D. Carano, H. J. Aronen and T. Tatlisumak, Am. J. Neuroradiol., 2002, 23, 194–199 Search PubMed.
- G. D. Li, Y. Y. Liang, P. Xu, J. Ling and Y. M. Chen, Am. J. Roentgenol., 2016, 206, 867–870 CrossRef PubMed.
- K. Sandrasegaran, F. M. Akisik, C. Lin, B. Tahir, J. Rajan, R. Saxena and A. M. Aisen, Am. J. Roentgenol., 2009, 193, 1556–1560 CrossRef PubMed.
- F. Hu, R. Yang, Z. Huang, M. Wang, H. Zhang, X. Yan and B. Song, Abdom. Radiol., 2017, 42, 2855–2863 CrossRef PubMed.
- E. C. Qin, R. Sinkus, G. Geng, S. Cheng, M. Green, C. D. Rae and L. E. Bilston, J. Magn. Reson. Imaging, 2013, 37, 217–226 CrossRef PubMed.
- B. Chevallay and D. Herbage, Med. Biol. Eng. Comput., 2000, 38, 211–218 CrossRef CAS.
- W. McKleroy, T.-H. Lee and K. Atabai, Am. J. Physiol.: Lung Cell. Mol. Physiol., 2013, 304, L709–L721 CrossRef CAS PubMed.
- M. E. Nimni, Semin. Arthritis Rheum., 1983, 13, 1–86 CrossRef CAS PubMed.
- T. Kunschmann, S. Puder, T. Fischer, J. Perez, N. Wilharm and C. T. Mierke, Biochim. Biophys. Acta, Mol. Cell Res., 2017, 1864, 580–593 CrossRef CAS PubMed.
- J. Steinwachs, C. Metzner, K. Skodzek, N. Lang, I. Thievessen, C. Mark, S. Münster, K. E. Aifantis and B. Fabry, Nat. Methods, 2015, 13, 171–176 CrossRef PubMed.
- C. T. Mierke, D. P. Zitterbart, P. Kollmannsberger, C. Raupach, U. Schlötzer-Schrehardt, T. W. Goecke, J. Behrens and B. Fabry, Biophys. J., 2008, 94, 2832–2846 CrossRef CAS PubMed.
- M. J. Paszek, N. Zahir, K. R. Johnson, J. N. Lakins, G. I. Rozenberg, A. Gefen, C. A. Reinhart-King, S. S. Margulies, M. Dembo, D. Boettiger, D. A. Hammer and V. M. Weaver, Cancer Cell, 2005, 8, 241–254 CrossRef CAS PubMed.
- N. R. Lang, K. Skodzek, S. Hurst, A. Mainka, J. Steinwachs, J. Schneider, K. E. Aifantis and B. Fabry, Acta Biomater., 2015, 13, 61–67 CrossRef CAS PubMed.
- K. Deshmukh and M. E. Nimni, J. Biol. Chem., 1969, 244, 1787–1795 CAS.
- M. E. Nimni, D. Cheung, B. Strates, M. Kodama and K. Sheikh, J. Biomed. Mater. Res., 1987, 21, 741–771 CrossRef CAS PubMed.
- O. Thoumine and A. Ott, J. Cell Sci., 1997, 110, 2109–2116 CAS.
- R. E. Mahaffy, C. K. Shih, F. C. MacKintosh and J. Käs, Phys. Rev. Lett., 2000, 85, 880 CrossRef CAS PubMed.
- B. Schnurr, F. Gittes, F. C. MacKintosh and C. F. Schmidt, Macromolecules, 1997, 30, 7781–7792 CrossRef CAS.
- D. Mizuno, D. A. Head, F. C. MacKintosh and C. F. Schmidt, Macromolecules, 2008, 41, 7194–7202 CrossRef CAS.
- F. Schrank, H. Tzschätzsch, P. Ariza de Schellenberger, A. Janmey, J. Braun and I. Sack, ISMRM 2018, Paris, 2018.
- F. Schrank, H. Tzschätzsch, A. Ariza de Schellenberger, J. Braun and I. Sack, First International MRE Workshop in Berlin, Berlin, 2018, p. 53.
- V. D. Djordjević, J. Jarić, B. Fabry, J. J. Fredberg and D. Stamenović, Ann. Biomed. Eng., 2003, 31, 692–699 CrossRef.
- I. Sack, K. Jöhrens, J. Würfel and J. Braun, Soft Matter, 2013, 9, 5672 RSC.
- C. T. Mierke, T. Fischer, S. Puder, T. Kunschmann, B. Soetje and W. H. Ziegler, Sci. Rep., 2017, 7, 42780 CrossRef CAS PubMed.
- M. Molteni, D. Magatti, B. Cardinali, M. Rocco and F. Ferri, Biophys. J., 2013, 104, 1160–1169 CrossRef CAS PubMed.
- S. Münster and B. Fabry, Biophys. J., 2013, 104, 2774–2775 CrossRef PubMed.
- A. Chambolle, J. Math. Imaging Vis., 2004, 20, 89–97 CrossRef.
- A. M. Stein, D. A. Vader, L. M. Jawerth, D. A. Weitz and L. M. Sander, J. Microsc., 2008, 232, 463–475 CrossRef PubMed.
- T. K. Yasar, T. J. Royston and R. L. Magin, Magn. Reson. Med., 2013, 70, 479–489 CrossRef PubMed.
- R. J. Okamoto, E. H. Clayton and P. V. Bayly, Phys. Med. Biol., 2011, 56, 6379–6400 CrossRef CAS PubMed.
- H. Tzschätzsch, J. Guo, F. Dittmann, S. Hirsch, E. Barnhill, K. Jöhrens, J. Braun and I. Sack, Med. Image Anal., 2016, 30, 1–10 CrossRef PubMed.
- H. Schiessel and A. Blumen, Macromolecules, 1996, 28, 4013–4019 CrossRef.
- P. T. Callaghan, Translational Dynamics and Magnetic Resonance, Oxford University Press, 2011 Search PubMed.
- R. Valiullin, Diffusion NMR of Confined Systems, Royal Society of Chemistry, Cambridge, 2016 Search PubMed.
- R. Cotts, M. J. Hoch, T. Sun and J. Markert, J. Magn. Reson., 1989, 83, 252–266 CAS.
- B. Fabry, G. N. Maksym, J. P. Butler, M. Glogauer, D. Navajas, N. A. Taback, E. J. Millet and J. J. Fredberg, Phys. Rev. E: Stat., Nonlinear, Soft Matter Phys., 2003, 68, 041914 CrossRef PubMed.
- M. A. Meyers and K. K. Chawla, Mechanical Behavior of Materials, Cambridge University Press, Cambridge, 2008 Search PubMed.
- F. G. Schmidt, B. Hinner and E. Sackmann, Phys. Rev. E: Stat. Phys., Plasmas, Fluids, Relat. Interdiscip. Top., 2000, 61, 5646–5653 CrossRef CAS.
- R. J. DePuit and T. M. Squires, J. Phys.: Condens. Matter, 2012, 24, 464106 CrossRef PubMed.
- M. Doi and S. F. Edwards, The theory of polymer dynamics, Clarendon Press, 1986 Search PubMed.
- E. D. Von Meerwall, E. J. Amis and J. D. Ferry, Macromolecules, 1985, 18, 260–266 CrossRef CAS.
- S. Ramanujan, A. Pluen, T. D. McKee, E. B. Brown, Y. Boucher and R. K. Jain, Biophys. J., 2002, 83, 1650–1660 CrossRef CAS PubMed.
- T. Kihara, J. Ito and J. Miyake, PLoS One, 2013, 8, e82382 CrossRef PubMed.
- T. Wang, H. Jo, W. F. DeGrado and M. Hong, J. Am. Chem. Soc., 2017, 139, 6242–6252 CrossRef CAS PubMed.
- M. Shayegan and N. R. Forde, PLoS One, 2013, 8, e70590 CrossRef CAS PubMed.
- D. Vader, A. Kabla, D. Weitz and L. Mahadevan, PLoS One, 2009, 4, e5902 CrossRef PubMed.
- T. T. Tower, M. R. Neidert and R. T. Tranquillo, Ann. Biomed. Eng., 2002, 30, 1221–1233 CrossRef PubMed.
- L. H. H. Olde Damink, P. J. Dijkstra, M. J. A. Van Luyn, P. B. Van Wachem, P. Nieuwenhuis and J. Feijen, J. Mater. Sci.: Mater. Med., 1995, 6, 460–472 CrossRef CAS.
- C. T. Rueden, J. Schindelin, M. C. Hiner, B. E. DeZonia, A. E. Walter, E. T. Arena and K. W. Eliceiri, BMC Bioinf., 2017, 18, 529 CrossRef PubMed.
- J. Schindelin, I. Arganda-Carreras, E. Frise, V. Kaynig, M. Longair, T. Pietzsch, S. Preibisch, C. Rueden, S. Saalfeld, B. Schmid, J.-Y. Tinevez, D. J. White, V. Hartenstein, K. Eliceiri, P. Tomancak and A. Cardona, Nat. Methods, 2012, 9, 676–682 CrossRef CAS PubMed.
- Blender v2.5- a 3D modeling and rendering package, Blender Foundation, 2010.
| This journal is © The Royal Society of Chemistry 2019 |