 Open Access Article
Creative Commons Attribution 3.0 Unported Licence
A coarse-grained multiscale model to simulate morphological changes of food-plant tissues undergoing drying
W. D. C. C.
Wijerathne
 a,
C. M.
Rathnayaka
 b,
H. C. P.
Karunasena
 c,
W.
Senadeera
 d,
E.
Sauret
 a,
I. W.
Turner
 ef and
Y. T.
Gu
 *a
*a
aSchool of Chemistry, Physics, and Mechanical Engineering, Science and Engineering Faculty, Queensland University of Technology, 2 George St, Brisbane, 4001, Australia. E-mail: yuantong.gu@qut.edu.au; Fax: +61-7-3138 1469; Tel: +61-7-3138 1009
bStudent Success Group, Chancellery, Queensland University of Technology, 2 George St, Brisbane, 4001, Australia
cDepartment of Mechanical and Manufacturing Engineering, Faculty of Engineering, University of Ruhuna, Hapugala, Galle, 80000, Sri Lanka
dSchool of Mechanical and Electrical Engineering, University of Southern Queensland, Springfield, QLD 4300, Australia
eSchool of Mathematical Sciences, Science and Engineering Faculty, Queensland University of Technology, 2 George St, Brisbane, 4001, Australia
fACEMS ARC Centre of Excellence, School of Mathematical Sciences, Queensland University of Technology, GPO Box 2434, Brisbane, QLD 4001, Australia
First published on 3rd December 2018
Abstract
Numerical modelling has emerged as a powerful and effective tool to study various dynamic behaviours of biological matter. Such numerical modelling tools have contributed to the optimisations of food drying parameters leading to higher quality end-products in the field of food engineering. In this context, one of the most recent developments is the meshfree-based numerical models, which have demonstrated enhanced capabilities to model cellular deformations during drying, providing many benefits compared to conventional grid-based modelling approaches. However, the potential extension of this method for simulating bulk level tissues has been a challenge due to the increased requirement for higher computational time and resources. As a solution for this, by incorporating meshfree features, a novel coarse-grained multiscale numerical model is proposed in this work to predict bulk level (macroscale) deformations of food-plant tissues during drying. Accordingly, realistic simulation of morphological changes of apple tissues can now be performed with just 2% of the previous computational time in microscale and macroscale simulations can also be conducted. Compared to contemporary multiscale models, this modelling approach provides more convenient computational implementation as well. Thus, this novel approach can be recommended for efficiently and accurately simulating morphological changes of cellular materials undergoing drying processes, while confirming its potential future expansion to efficiently and accurately predict morphological changes of heterogeneous plant tissues in different spatial scales.
1. Introduction
Drying is one of the most common techniques for preserving food-plant products such as fruits and vegetables. Around 20% of the entire world's perishable crops are dried annually.1 Drying increases the shelf life of a particular food product, as biological reactions get restricted when the amount of moisture in the food product gets reduced. In a dried food product, the morphological characteristics such as shape, texture and colour mainly determine its market value,2,3 which can effectively be controlled by virtue of the moisture content and drying temperature.4,5 Furthermore, the bulk level morphology of a food material is an outcome of the cellular scale deformation profile.6,7 Thus, a fundamental understanding of these correlations is critical in order to optimally control the food product quality.In this regard, several bulk scale empirical and theoretical models have been developed to simulate key parameters such as moisture content and morphological changes. Despite their simplicity, the empirical models are limited in their use for diverse food varieties due to over-reliance on experimental conditions.4 Fundamental heat and mass transfer theories such as Fick's law have been incorporated in the theoretical drying models and most of them disregard the transient effects of shrinkage at the boundary, which in return leads to unrealistic results. However, with the use of sophisticated meshing conditions, some theoretical models can account for a certain degree of deforming boundaries in agreement with numerical solutions,8–10 and they usually demand higher computational time and resources. In general, these models have limitations in accounting for the interactions between the solid and gaseous phases and hence are unable to effectively simulate the complex shrinkage patterns of such multiphasic tissues.
As an alternative, meshfree particle methods have recently become a popular choice for numerical modelling of cellular scale (microscale) tissue deformations during drying.11–16 These models have demonstrated a higher capability in modelling cellular scale morphological variations while maintaining a favourable agreement with experimental findings.17 Compared to the state-of-the-art grid-based microscale numerical models,18 the meshfree-based models are more capable of handling extreme moisture reductions, multiphasic tissue arrangements and complex deformations of cell aggregates as well as wrinkling of cell walls. However, a key challenge in this approach is the excessive computational cost needed for the real-time neighbour-particle finding process, technically termed as Nearest Neighbour Particle Searching (NNPS), involved in the Smoothed Particle Hydrodynamics (SPH) technique, which is the most common meshfree setup of the above models.17 To minimise its impact, some efficient NNPS means such as the cell-linked list algorithm could be used, however, resulting in a maximum 20% reduction of computational time.19 In addition, the micro–macro coupled multiscale methods have been in use to reduce the excessive computational time consumed by such full cellular models.20 In these models, the macroscale domain is discretised using a finite element method, and the spatial scales are coupled via representative volume elements (RVE), which are centred around the finite element quadrature points. The microscale problem is only solved inside a RVE. Despite its accuracy, this particular multiscale method can only save up to 50% of the computational time compared to full-scale SPH-based meshfree model. Hence, further improved computational solutions are still to be investigated in the context of macroscale tissues.
In this context, Coarse-Graining (CG) approach is a common choice due to its inbuilt computationally efficient nature where particle groups are systematically represented as lumped units as an alternative to the full-scale particle representation.21,22 This approach is incorporated in the coarse-grained multiscale (CGMS) method to model larger spatial scale biophysical mechanisms of various cellular components, proteins and lipids, deriving required coarse-grained parameters from fine-scale simulations.23–26 There exists a conventional set of interactions to model the physical behaviour of CG units including stretching, torsion, repulsion and attractions.27–30 However, such interactions cannot be simply used to model the turgor pressure-dominated mechanisms observed during plant cell drying as it is interrelated with the cellular moisture transport.15 In some previously reported CG investigations, the conservation of certain physical parameters has been used to establish morphological behaviour. For example, in recently reported red-blood-cell morphological modelling studies, the volume and area were conserved during motion.31 However, for modelling a plant tissue during drying, such approaches are unrealistic as the tissue volume (or area) is not conserved during the moisture removal. Therefore, a clear research gap exists in CG modelling to characterise the drying-related tissue deformations, mainly based on moisture and turgor pressure variations.
Accordingly, the main aim of this article is to develop a CGMS numerical model to simulate drying-related morphological changes at the macroscale, starting from the aforementioned meshfree based microscale full cellular (MFC) model developed by Karunasena et al. (2014).12 The outline of the paper is as follows. Firstly, the conceptual and computational framework of the proposed CGMS model is discussed, specifying the strategies for estimating the CG model parameters. The next section presents the experimental procedure for drying of apple tissues of different sizes which will be used for the CGMS model validation. The fundamental CGMS model behaviour at different dryness levels is discussed in the following section compared with the corresponding MFC model. The behaviour of the CGMS model at the macroscale is focused next with subsequent studies targeting the computational efficiency and parameter sensitivity. Finally, the key conclusions drawn from this investigation are discussed while highlighting potential future directions.
2. Numerical methodology
2.1. Two dimensional (2-D) coarse-grained representation of a plant tissue
Cells are the fundamental building blocks of all plants where different cell categories perform different biological activities such as transpiration, growth and food storage.32 Out of these different cell categories, parenchyma cells store food components, which get subjected to a higher degree of morphological variations during drying. From a food engineering perspective, these types of cells are frequently subjected to detailed studies on developing cellular drying models in which the plant cell can be considered as a two-phase composite structure having a flexible solid cell wall enclosing the cell protoplasm.11–16 Such cells form the tissue by interconnecting through the middle lamella.32The above biological components are incorporated in the microscale full cellular model developed by Karunasena et al. (2014)12 for drying as shown in Fig. 1(a). In this model, 96 wall particles and 656 fluid particles have been employed to generate the initial plant cell geometry following an optimisation study considering the computational accuracy and cost.12 Therein, the dynamics of a plant cell during drying are represented by the corresponding movements of above particles. In this investigation, the aforementioned scheme of particles is coarse-grained into a single unit called a coarse-grained bead (i.e. CG bead). A CG bead represents the overall dynamics of the cell centroid as influenced by drying. As illustrated in Fig. 1(b and c), the microscale and macroscale tissues are represented in a coarse-grained description by aggregating identical CG beads.
To represent the overall mechanisms of the cell fluid and the cell wall, a CG bead is assumed to be physically comprised of a fluid-solid combination. A virtual cell is assumed for every CG bead to represent the variation of cellular dimensions during the time evolution of the model. As shown in Fig. 1(d), a hexagonal virtual cell is used for this purpose, and the dimensional parameters required for fluid phase calculations are derived from the virtual cell. In the contemporary micromechanical plant cell models, hexagonal, square and rectangular cellular geometries are used.12,33,34 However, from the preliminary studies it was found that tissue morphology is less influenced by the chosen geometry for the proposed numerical model. Nevertheless, the hexagonal shape was adopted to align with the commonly observed honeycomb shape of the cellular arrangements in real plant tissues.12 The following sections provide details about the proposed set of force interactions for modelling the interactions among CG beads.
2.2. Interactions among coarse-grained beads
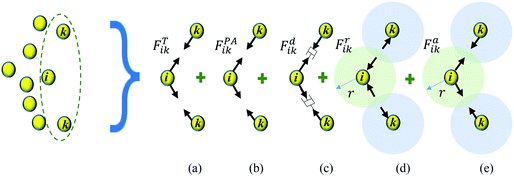
During drying, the morphology of a plant cell is significantly influenced by the variation of the turgor pressure.11,15 The hardening and tightening effects of cell wall lead to alterations in cell wall morphology during drying.11,35 The viscous nature of the cell protoplasm and the cell wall effectively damp the cell during external perturbances, while middle lamella bonds the cells together restricting the unphysical intercellular interactions.12,36 Therefore, these intercellular and intracellular effects govern the dynamics of a plant cell centroid which is represented by a CG bead in this study. In order to model the above, as shown in Fig. 2, five forces are used; turgor pressure induced forces (FT), perimeter adjustment forces (FPA), damping forces (Fd), attraction forces (Fa) and repulsion forces (Fr).Here, FT and Fd forces represent the physical behaviour of a cell induced by the turgor pressure fluctuations and the viscous behaviour of the cell fluid and the wall, respectively. FPA forces are used to model the morphological changes of a cell during drying as influenced by cell wall hardening and tightening effects. Fa and Fr forces are used to model the effect of the intercellular bond during drying. The full derivation and a detailed description of these forces are provided in the Appendix. Using the above force interactions as shown in Fig. 2, the total force acting on CG bead i (Ftotalik) from any neighbouring CG bead k can be written as:
| Ftotalik = FTik + FPAik + Fdik + Faik + Frik, | (1) |
2.3. Estimation of model parameters
As explained in the Appendix, the CGMS model has six parameters to be determined. These include the turgor coefficient (kT), perimeter adjustment coefficient (kPA), periphery scaling factor (β), damping coefficient (kd), Lennard-Jones contact strength for CG bead attractions (fa0) and Lennard-Jones contact strength for CG bead repulsions (fr0). Here, kd, fa0 and fr0 are computed such that unrealistic biophysical interactions among CG beads such as overlapping and repulsions are avoided. The MFC model solution is employed to estimate the rest. Herein, the same plant tissue is numerically simulated by both MFC and CGMS models under different normalised moisture content (X/X0) values. As the accuracy of the MFC model for simulating real tissue deformations increases with the number of cells used,12 it is essential to use an adequately large tissue in the multiscale method to increase the accuracy of the CGMS model. Nevertheless, the MFC model experiences a drastic elevation of computational time when simulating very large tissues. Different numerical instabilities are also experienced when simulating a wider range of moisture content variations. Therefore, a moderately large microscale tissue comprising of 86 cells was selected based on the above concerns.The required CG model parameters are then computed for distinct X/X0 values of 1.0, 0.8, 0.6, 0.4 and 0.3. For a given X/X0 value, the MFC model is first time evolved for the desired food-plant variety, and corresponding cell centroid positions are recorded at the steady state condition. At the same dryness level, the CGMS model is run to determine optimum values for kT, kPA and β, subjected to minimization criterion of the root mean squared value (RMSD) as defined in eqn (2).
 | (2) |
It is noteworthy that for the apple tissues considered in this computational investigation, constant values of kT and kPA were found to be adequate to favourably replicate the MFC model predictions as shown in Table 1. However, the periphery scaling factor (β) exhibited a significant influence in determining the bending nature of the tissue with the dryness level. Therefore, a moisture dependent function is proposed for β as shown in Table 1.
| Parameter | Value or equation | Strategy for determination | Remarks |
|---|---|---|---|
| Damping coefficient (kd) | 2.0 × 10⁻⁴ N m−1 s | Avoiding unphysical interactions | Common for any X/X0 value in the range |
| Lennard-Jones contact strength for CG bead attractions (fa0) | 1.0 × 10⁻¹¹ N m−1 | Avoiding unphysical interactions | Common for any X/X0 value in the range |
| Lennard-Jones contact strength for CG bead repulsions (fr0) | 1.0 × 10⁻¹¹ N m−1 | Avoiding unphysical interactions | Common for any X/X0 value in the range |
| Perimeter adjustment coefficient (kPA) | 2.0 N m−1 | Using MFC model solution | Common for any X/X0 value in the range |
| Periphery scaling factor (β) | 1.0311 + 0.1088![[thin space (1/6-em)]](https://www.rsc.org/images/entities/char_2009.gif) log(X/X0) log(X/X0) |
Using MFC model solution | Need to be computed based on X/X0 value |
| Turgor coefficient (kT) | 1.0 × 10⁻¹⁰ N Pa−1 | Using MFC model solution | Common for any X/X0 value in the range |
2.4. Simulation of fresh and dried food-plant tissues
Firstly, the initial size of a virtual cell for any CG bead is determined by equating its surface area to that of a real plant cell having the average cell diameter (D) as given in Table 2. The CG beads are then aggregated into a rectangular pattern to form the tissue. The hexagonal virtual cells are assumed to be virtually aggregated as in Fig. 1(d) maintaining a positive pectin layer thickness (dp) between neighbouring virtual cells. For the fresh condition (i.e. X/X0 = 1.0), the corresponding initial virtual cell volume (virtual cell surface area × virtual cell height) and initial fluid phase density are used to estimate the initial fluid phase mass. Following previous plant cell drying models,12 the initial solid phase mass is taken as 10% of the initial fluid phase mass. The model is then initiated for the fresh condition using the parameters given in Tables 1 and 2, under the time step defined in Table 2.| Parameter | Value or equation | Source |
|---|---|---|
| Average cell diameter (D) | 150 μm | 11 and 12 |
| Virtual cell height (h) | 6 μm | 11 and 12 |
| Pectin layer thickness (dp) | 8 μm | 11 and 12 |
| Empirical factors for perimeter adjustment (a, b) | 0.2, 0.9 | 11 and 12 |
| Fluid phase turgor pressure at fresh condition (Pf) | 200 kPa | 11 and 12 |
| Fluid phase osmotic potential at fresh condition (Π) | −200 kPa | 11 and 12 |
| Fluid phase compression modulus (K) | 20 MPa | 11 and 12 |
| Turgid ratio (for a virtual cell) | 1.05 | Set |
| Normalised LJ cut-off radius for Lennard-Jones forces (r/r0) | 1 + 0.0809![[thin space (1/6-em)]](https://www.rsc.org/images/entities/char_2009.gif) log(X/X0) log(X/X0) |
Computed using microscopy images from Karunasena et al. (2014)37 |
| Initial fluid phase density (ρ0) | 1000 kg m−3 | 11 and 12 |
| Hydraulic conductivity for virtual cell membrane (Lp) | 7.5 × 10⁻⁷ mPa−1 s−1 | Set |
| Time step (Δt) | 1.0 × 10⁻⁷ s | Set |
The CG beads tend to move based on the equilibrium perimeter and Lennard-Jones (LJ) cut-off radius assigned (please see eqn (9) in the Appendix and Table 2 for corresponding expressions). During this motion, the area of virtual cells are updated according to eqn (10) and (11) in the Appendix. Accordingly, the fluid-phase density is updated based on eqn (5)–(7) in the Appendix, and these slight density fluctuations lead to alterations in fluid phase turgor pressure according to eqn (4) in the Appendix. Note that the solid phase mass is kept constant throughout the time evolution and the fluid phase mass is updated based on eqn (7) in the Appendix. This cycle of model evolution repeats until the magnitudes of the turgor pressure and osmotic potential at the fresh state are equal, indicating that mass transfer through the virtual cell membrane has come to a halt. This condition infers the steady-state for the fresh tissue.
For a dried tissue, a similar approach is followed to obtain the steady-state morphological measurements. Here, the initial fluid phase mass is adjusted as proportional to the dryness level to obtain computationally efficient simulations rather than simulating the real drying cycle which usually runs for hours. This method of obtaining the tissue morphology for a given dryness level is termed as the moisture-domain-based simulation approach which was used in previously published plant cell drying studies.12 Furthermore, the solid phase mass is similarly adjusted to replicate the cell wall drying effects of a real tissue and kept constant throughout the time evolution of the model.11 Previous researchers have hypothesised that the turgor pressure remains positive during the drying cycle and assumed that turgor pressure linearly reduces with the cell fluid mass.12 A similar approach is followed in the CGMS model for determining the fluid phase characteristics of a CG bead. The fluid phase osmotic potential is also adjusted as being proportional to the dryness level and is kept constant during the model evolution to ensure the stability of the model is not compromised. Note that due to the interactions between CG beads, a little higher initial moisture content needs to be applied to obtain a desired dryness level at the steady-state. For instance, for apple cells, the initially set X/X0 should be 0.68 to obtain the steady-state X/X0 value of 0.60. After reaching the steady-state, the tissue-level geometrical parameters explained in the upcoming Section 2.5 are then computed to characterise the tissue deformations at a specified dryness level.
2.5. Computational implementation and model visualisation
The model was computer implemented as a C++ source code, and the simulations were performed using the High-Performance Computing (HPC) facilities at Queensland University of Technology (QUT), Brisbane, Australia. For comparison purposes, similar computing facilities were involved in running the MFC model used for extracting the aforementioned CG model parameters. The CGMS model is time evolved using the Leapfrog integrator.15After the attainment of the steady state dryness level, the CG bead positions are recorded to perform the visualisations using the Open Visualization Tool (OVITO).38 Meanwhile, three tissue-level morphological parameters are computed: surface area (A), perimeter (P) and elongation (EL) to quantify the morphological changes corresponding to each dryness state. Here, EL is defined as the ratio of major axis length to minor axis length of the tissue. For a rectangular tissue, the major and minor axis lengths are defined as the length of the vertical symmetrical axis and horizontal symmetrical axis, respectively. These parameters are normalised with respect to their values at the fresh condition to obtain the corresponding normalised morphological parameters A/A0, EL/EL0 and P/P0. These normalised parameters are then used to validate the CGMS model for apple tissues using the experimental values obtained in Section 3.
3. Experimental studies
The Royal Gala apple variety (Malus Domestica) obtained from a local supermarket in Brisbane, Australia was used for the experiments. The apples were put in a sealed container and kept in a refrigerator at 4 °C for three days to avoid dehydration before experiments. During sample preparation, these were first washed with clean water and cut using a sharp knife into different sized specimens of constant thickness 2 mm. Samples in the millimetre and centimetre range were used to validate the CGMS model for microscale and macroscale tissues, respectively. Five tissue sizes of 1.5 mm × 1.5 mm, 1.5 mm × 2.0 mm, 1.5 mm × 2.5 mm, 2.0 mm × 2.0 mm and 2.0 mm × 2.5 mm were chosen to represent the microscale tissues. The specimen size of 2.0 cm × 2.0 cm was chosen to represent the macroscale tissues. For each microscale tissue stated above, four identical samples were dried under the same conditions to minimise the experimental errors during the procedure. In addition, to better validate the model in the macroscale, six samples were prepared and dried in two sets such that each set contains three samples.A convective air dryer (Excalibur's five-tray dehydrator, USA) having an inbuilt electric heater and a fan was used to dry the samples. A thermostat was used to adjust the temperature to a desired value. Throughout the series of experiments, the hot air temperature was maintained at 70 °C and the air flow rate was kept at 1.5 ms−1. After the initial warm up, the samples were placed symmetrically on a tray and loaded into the dryer. Only the middle tray was used for the experiments while the same sample was used for taking both weight measurements and images intermittently.
After drying for 1 min, the microscale tissue samples were weighed, and the images were taken using a light microscope (Leica (Wentzler, Germany) M125). The readings were taken in short time intervals because the specimens dehydrate quickly due to the small surface area. After this procedure, the sample was dried again for 1 min, and the whole process was repeated until a completely dried tissue was obtained. For macroscale tissues, a similar procedure was followed with a drying time of 3 min, and images were taken by a digital camera (Samsung, South Korea), which was fixed above the samples during the measurement procedure. The weight measurements were taken using a digital weighing scale (KERN & Sohn GmbH, ABJ 220-4M, Germany). In the imaging process, the light microscope was set to a magnification of 1.25 while the digital camera was set to have a 13 mega pixels resolution with 4128 × 3096 pixels. All images were post-processed using the ImageJ software (version 1.51)39 to compute the surface area, perimeter and elongation for the tissue samples. The next section evaluates the proposed CGMS model in simulating tissues in different spatial scales.
4. Results and discussion
4.1. Simulation of microscale tissues using the coarse-grained multiscale (CGMS) model
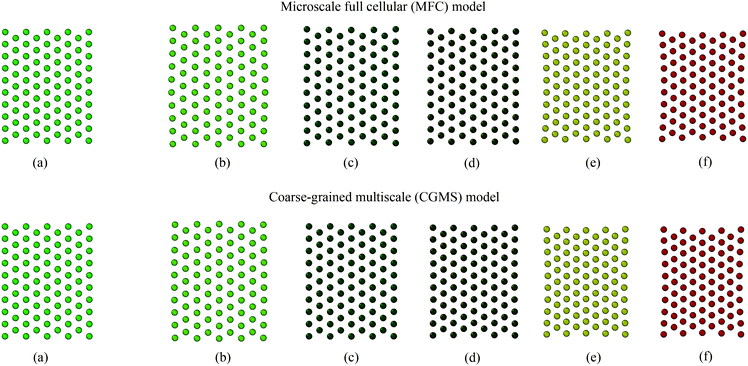
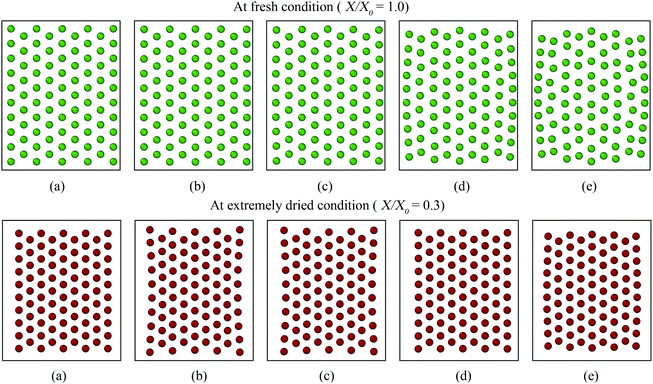
Firstly, the fundamental physical behaviour of the CGMS model under different dryness levels was analysed by referring to the MFC model as shown in Fig. 3. A colour scheme (light green to red) was used here to enhance the visibility of the tissue morphologies. This numerical study is based on a microscale tissue comprising 86 cells (or CG beads). Next, the above fundamental model behaviours are compared with the experimental findings to obtain insights from the real world tissue behaviour. In this context, the predicted tissue behaviours are compared qualitatively with the images obtained from a microscale tissue being dried as shown in Fig. 4. Because it was logistically difficult to prepare a tissue that consisted of 86 cells experimentally, the microscale tissue of size 1.5 mm × 1.5 mm was used. These observations are elaborated quantitatively in Fig. 5 using the derived normalised geometrical parameters. The area and perimeter of modelled tissues at a particular dryness level were estimated by taking the area and perimeter enclosed by the corresponding peripheral CG beads or cell centroids. Similar cell centroids or CG beads were considered for elongation calculations.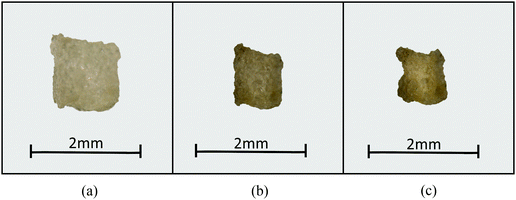 | ||
| Fig. 4 Morphological behaviour of a microscale (1.5 mm × 1.5 mm × 2.0 mm) apple tissue at different dryness levels: (a) X/X0 = 1.0, (b) X/X0 = 0.55, and (c) X/X0 = 0.29. | ||
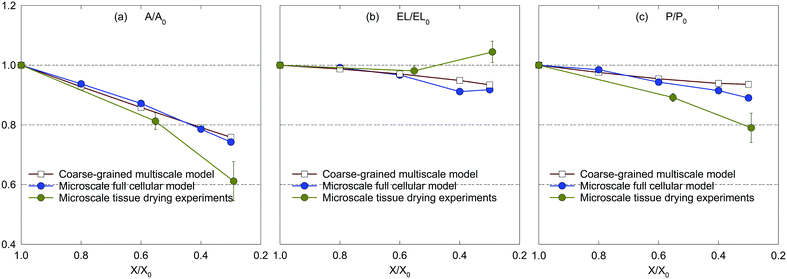 | ||
| Fig. 5 Influence of dryness level on morphological parameters of a microscale tissue: (a) A/A0, (b) EL/EL0, and (c) P/P0 (error bars indicate one standard deviation). | ||
When comparing Fig. 3(a and b) for both MFC and CGMS solutions, inflation from the initial tissue arrangement is observed at the fresh condition (i.e. X/X0 = 1.0). A fresh tissue predicted by the MFC model shows an expansion in the lateral direction mainly due to the outward movement of peripheral cell centroids as a result of interior cells becoming circular during turgid (fresh) condition. The CGMS model similarly demonstrates an expansion behaviour due to the application of Lennard-Jones (LJ) and perimeter adjustment forces, however, with a comparatively less expansion along the lateral direction. One reason for the aforementioned discrepancy in the tissue expansion could be the proposed expression for the scaling factor (β) may not fully capture the peripheral cell wall deformation physics. In addition, the CGMS model employs a constant LJ cut-off radius (r) at a given dryness level to minimise the complexity of the model implementation. However, such a simplified relationship may not be adequate to model the realistic behaviour of the middle lamella of real tissues, as predicted the by the MFC model.
In the case of dried tissues, an apparent reduction of the overall tissue area is predicted by the CGMS model which agrees qualitatively with the MFC model as per Fig. 3(b)–(f). This observation is further evident from morphological parameter variations as given in Fig. 5 (a)–(c). The distance between CG beads also decreases as further moisture is removed, replicating the contraction of the tissue towards the centre. Also, for both models, compared with the central area of the tissue, the tissue periphery experiences a lower shrinkage. The key reason is that the CG beads or cells in these respective locations experience different force interactions. However, compared to the MFC model visualisations in Fig. 3(b)–(f), the CGMS model renders smaller dried tissues even though the deformation of tissue-boundaries are well mimicked. The influence of the expressions used for β and r explained in the context of fresh tissues could be the reason the above behaviour at the dried conditions as well. However, considering the overall prediction by the CGMS model compared with the MFC model, a favourable agreement was observed for A/A0, EL/EL0 and P/P0 trends which result in maximum deviations of 2%, 4% and 5%, respectively. Therefore, the CGMS model is well capable of reproducing the fundamental morphological behaviour of MFC model.
Considering the experimental observations, the modelled tissues agree well with the morphology of the tissue being dried shown in Fig. 4. As illustrated by Fig. 5(a)–(c), the predicted morphological trends of both numerical models closely follow the experimental values up to considerable moisture removal. However, the model predictions significantly deviate from the experimental values when X/X0 ≤ 0.6. This could be due to the intense shrinkage behaviour of a real food-plant tissue at extreme moisture removals. Fundamentally, the tissue experiences such morphological response as a result of structural collapse which occurs simultaneously with porosity development and case hardening during drying.40 Since the MFC and CGMS models disregard the effect of such events in this study, possible deviations could be expected. Nevertheless, considering the general trend, it is evident that the developed CGMS model is capable of simulating the microscale tissue behaviour during drying in a reasonable accuracy. The next Section discusses the applicability of the developed CGMS model to predict the morphological changes of macroscale tissues.
4.2. Simulation of macroscale tissues using the coarse-grained multiscale (CGMS) model
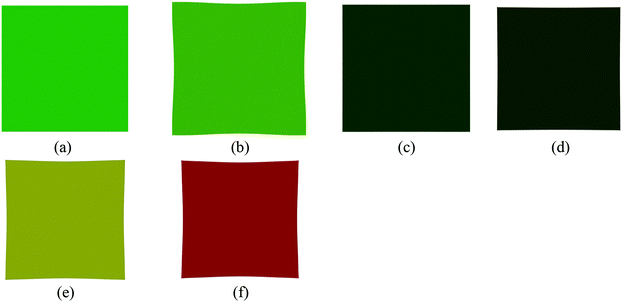
In this simulation study, the 2 cm × 2 cm macroscale tissue that can be numerically constructed using 20![[thin space (1/6-em)]](https://www.rsc.org/images/entities/char_2009.gif) 273 CG beads was used. The qualitative results shown in Fig. 6 provide useful information on the visual interpretation of macroscale deformation profile of a tissue during drying. In addition, the deformation of the similarly sized macroscale tissues during drying is depicted in Fig. 7 to aid the qualitative analysis. The model outcomes are quantitatively evaluated through the derived geometrical parameters as shown in Fig. 8. As the CG model parameters were extracted from the MFC model in the range 0.3 ≤ X/X0 ≤ 1.0, the simulations were conducted for the same range.
273 CG beads was used. The qualitative results shown in Fig. 6 provide useful information on the visual interpretation of macroscale deformation profile of a tissue during drying. In addition, the deformation of the similarly sized macroscale tissues during drying is depicted in Fig. 7 to aid the qualitative analysis. The model outcomes are quantitatively evaluated through the derived geometrical parameters as shown in Fig. 8. As the CG model parameters were extracted from the MFC model in the range 0.3 ≤ X/X0 ≤ 1.0, the simulations were conducted for the same range.
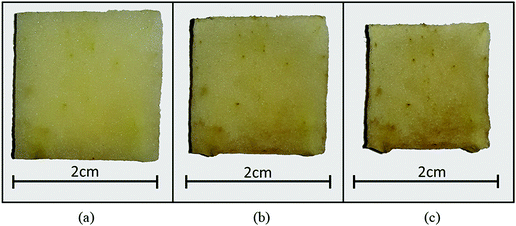 | ||
| Fig. 7 Morphological behaviour of a macroscale (2 cm × 2 cm × 2 mm) apple tissue at different dryness levels: (a) X/X0 = 1.0, (b) X/X0 = 0.7, and (c) X/X0 = 0.4. | ||
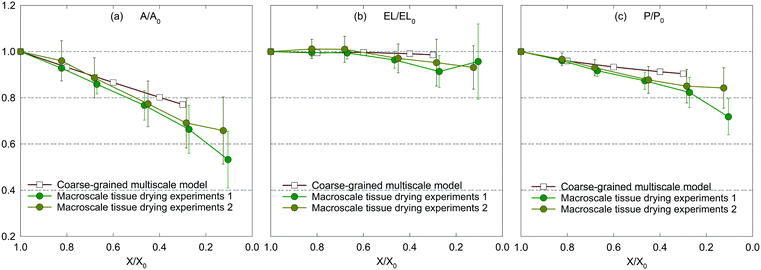 | ||
| Fig. 8 Influence of dryness level on morphological parameters of a macroscale (2 cm × 2 cm × 2 mm) apple tissue: (a) A/A0, (b) EL/EL0, and (c) P/P0 (error bars indicate one standard deviation). | ||
Compared with the inflated nature of the microscale model shown in Fig. 3(b), the macroscale tissue shows a slightly inward-bent structure at the fresh condition as observed in Fig. 6(b). Furthermore, the macroscale dried tissues in Fig. 6(c)–(f) get more contracted compared to the microscale dried tissues in Fig. 3(c)–(f). The possible reason for the above observations is the increase of the force acting on a CG bead, which stems from the increase of overall inter-bead interactions at the macroscale. The tissue experiences a higher level of shrinkage as moisture is removed from the tissue, as observed in Fig. 6(b)–(f), in alignment with the experimental results given in Fig. 7(a)–(c). However, beyond 40% moisture removal, the experimental results indicate more reduction of all geometrical parameters compared to CGMS model predictions.
The main reason behind this behaviour could be the structural collapse of plant tissues which stems from tissue heterogeneities stated previously. This fact highlights the potential improvements for the CGMS model. Furthermore, according to the experimental results, the maximum deviations for A/A0, EL/EL0 and P/P0 trends are found to be 11%, 8% and 8%, respectively, implying the validity of the CGMS model at the macroscale for simulating drying related deformations.
4.3. Computational performance of the coarse-grained multiscale (CGMS) model
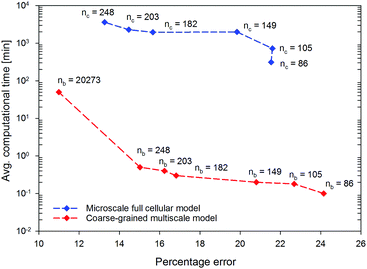
In this section, the computational efficiency and the accuracy of the proposed CGMS model in simulating tissues of different sizes are assessed. To compute the model accuracy, the percentage deviation from the experimental value for the normalised tissue area at the normalised moisture content of 0.3 was used. The above model deviation is termed as “percentage error” for the convenience. The MFC model was referred to obtain the corresponding simulation time and the percentage error that comes from a full-scale simulation model. For the simulations, rectangular tissues of different sizes were developed using MFC and CGMS models by incorporating different numbers of cells (nc) or CG beads (nb) such as nc or nb is 105 for 1.5 mm × 1.5 mm tissue. The corresponding values were 105, 149, 182, 203 and 248 for microscale tissue sizes 1.5 mm × 1.5 mm, 1.5 mm × 2.0 mm, 1.5 mm × 2.5 mm, 2.0 mm × 2.0 mm and 2.0 mm × 2.5 mm, respectively. The simulation results obtained from the tissue having 86 cells and the macroscale tissue (tissue dimensions: 2 cm × 2 cm; nb = 20![[thin space (1/6-em)]](https://www.rsc.org/images/entities/char_2009.gif) 273) were addionally included to further elaborate the performance of the CGMS model.
273) were addionally included to further elaborate the performance of the CGMS model.
As shown in Fig. 9, throughout the series of tissue simulations, the CGMS model closely predicts the percentage error value given by the MFC model, demonstrating the capability of the CGMS model to replicating the similar morphological trend predicted by the MFC model. In particular, the percentage error of MFC and CGMS models vary from 13–21% and 15–24%, respectively. The possible reason for having an accountable percentage error could be explained in the model formulation point of view. In this regard, the MFC and CGMS models account for the uniform moisture distribution across the tissue with a uniform cell or CG bead arrangement. This assumption is not valid for real tissues with heterogeneous cellular arrangements, which also experience highly non-uniform moisture distributions especially towards the end of the drying cycle. In such cases, intense amounts of shrinkage could be anticipated which eventually lead to deviations from model predictions. As observed above, the percentage error decreases with the tissue size. This could be due to the increase of tissue shrinkage with the tissue size as a result of the increase of the force magnitude on a CG bead or cell. Therefore, these higher shrinkage values better approximate the experimental predictions which result in decrease of percentage error.
In terms of computational time, the MFC model consumes an average computational time of around 300 min for the 86-cell-tissue and it increases exponentially to 3600 min for the 248-cell-tissue, highlighting the excessive computational expenditure of the MFC model for modelling large tissues. With the same computational resources, the proposed CGMS model consumes only less than 1 minute to reach the steady-state solution for all tissue sizes (including the 248-cell-tissue) leading to approximately 98% saving of computational time. Therefore, the proposed CGMS model is superior in saving computational time compared with the state-of-the-art computational time saving techniques for meshfree based models.19,20 In addition, the CGMS model only requires a computational time of 50 min to simulate the morphological changes of the macroscale tissue stated above while the MFC model is limited in this simulation. Considering the above numerical outcomes, it is evident that the CGMS model is generally applicable to approximating both micro and macroscale drying-related tissue deformations more accurately and efficiently, compared to conventional approaches.
4.4. Sensitivity analysis
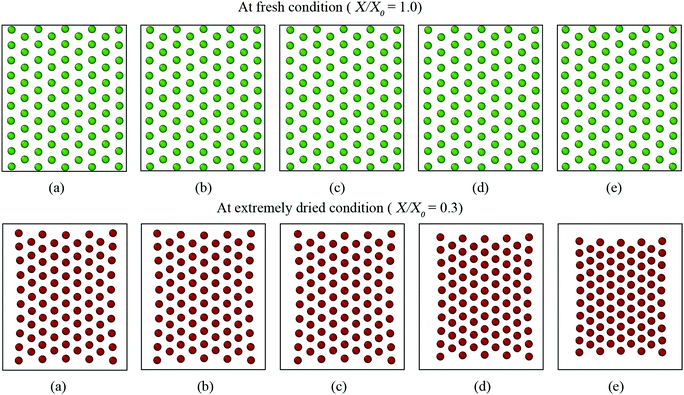
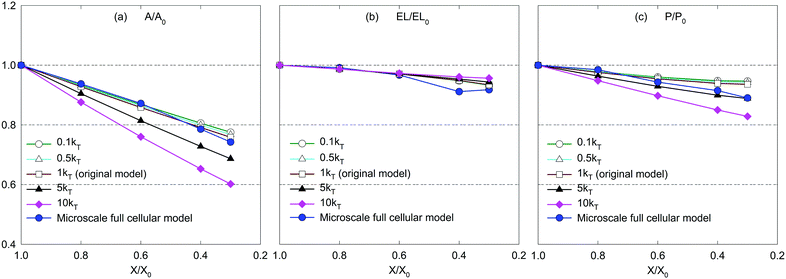
The CGMS model has three parameters which were extracted from the MFC model outcomes. A sensitivity analysis was performed to investigate how these parameters affect the tissue morphological characteristics. For easy interpretation of results, the microscale tissue consisting of 86 cells was chosen for the numerical experiments and the MFC model solution was also referred to better illustrate the impact of the model parameters. The corresponding tissue visualisations at the fresh condition and a critically dried condition (i.e. X/X0 = 0.3) are presented to assist the qualitative analysis. The numerical results are further elaborated through the variation of normalised morphological parameters: surface area (A/A0), perimeter (P/P0) and elongation (EL/EL0).Accordingly, no influence is observed from kT for the fresh tissue morphology, which is mainly due to the cancellation of the turgor induced forces at the fresh condition (please refer eqn (3) in the Appendix). However, for a dried tissue, the tissue area decreases when kT increases as observed in Fig. 10. Larger magnitudes of kT also tend to produce extremely shrunk tissues which are in disagreement with the MFC model predictions considering A/A0 and P/P0 trends in Fig. 11(a and c). This tissue behaviour is mainly due to the dominance of turgor pressure induced forces at extremely dried conditions which significantly attract the neighbouring CG beads based on the difference between P and Pf as defined by eqn (3) in the Appendix. However, the EL/EL0 trend is minimally influenced by the tested parameter according to Fig. 11(b). This is mainly due to the similar shrinkage pattern along the minor and major axis lengths of the tissue as kT increases. Based on this behaviour, moderate turgor coefficient values are recommended to ensure a reasonable accuracy for all the geometrical trends predicted by the CGMS model.
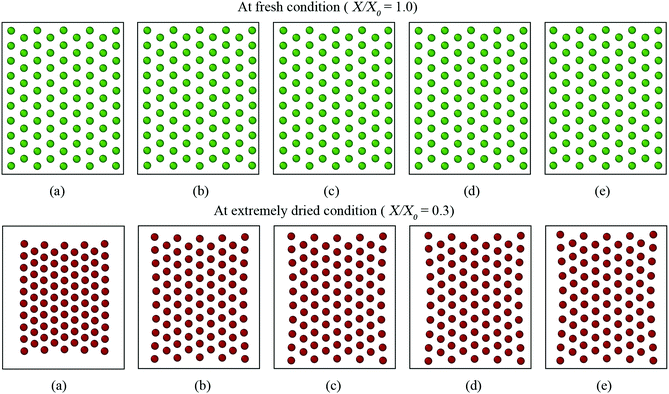
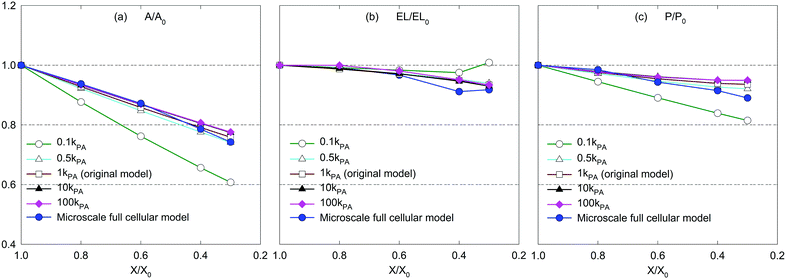
However, for the dried tissues, the model with 0.1kPA results in a highly contracted tissue compared with the rest. According to Fig. 3(f), such higher tissue contractions are unrealistic compared with the predicted tissue morphology by the MFC model. This observation is reconfirmed by Fig. 13(a)–(c), which illustrates significantly deviated trends for all geometrical parameters compared with the MFC model outcomes. The key reason for this tissue behaviour is the less influence from FPA forces to adjust the virtual cell perimeters to the equilibrium perimeter values. For the other tested values of kPA, a slight increase of tissue area is observed in Fig. 12(b)–(e) which is reconfirmed by Fig. 13(a and c) by the slight increase of A/A0 and P/P0. However, insignificant alterations in EL/EL0 values are observed in Fig. 13(b), implying that the magnitudes of minor axis deformation and major axis deformations are almost equal for the range of kPA considered. Based on this discussion, it is evident that moderately higher values of kPA are better suited considering the accuracy of the CGMS model.
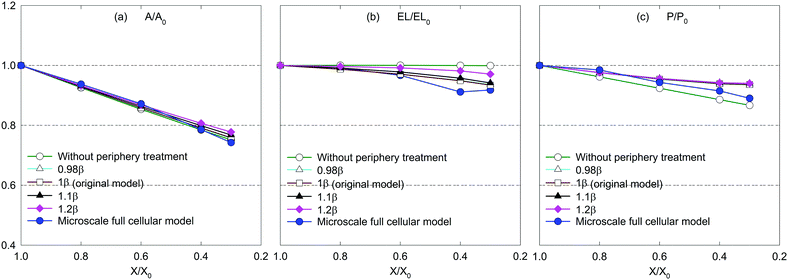 | ||
| Fig. 15 Influence of periphery scaling factor (β) on morphological parameters of a microscale tissue: (a) A/A0, (b) EL/EL0, and (c) P/P0. | ||
According to eqn (11) in the Appendix, comparatively larger perimeters are assigned for the peripheral virtual cells when β is increased. In this case, the perimeter adjustment forces tend to attract adjacent beads to align with the equilibrium perimeter values. At moderate β values, the tissue deforms in such a way that LJ cut-off radii are also maintained according to Fig. 14(b and c). However, as the LJ forces may not be enough to maintain a constant cut-off radius at higher β values where larger virtual cell perimeters are assigned numerically, different inter-bead distances are expected as observed in Fig. 14(d and e). For the dried tissue, similar morphological characteristics are observed as in Fig. 14(b)–(e). Considering the quantitative results depicted in Fig. 15, the A/A0 and P/P0 variations are less influenced by β which is mainly due to the cancellation of the above morphological changes during normalisation. In contrast, especially at the extreme dryness levels, the variation of EL/EL0 is significantly influenced by the elevated values of β, demonstrating the impact of different inter-bead distances observed in Fig. 14. In addition, by disabling the effect of β, the tissue deforms as a uniform square as seen in Fig. 14(a) for both fresh and dried conditions. This uniform square pattern is consistent throughout the drying process, as further evidenced by Fig. 15. This is mainly because identical virtual cell perimeter values are produced for all CG beads by FPA forces during model evolution. It is further evident that the predicted geometrical trends considerably deviate from the MFC model solution in this scenario. This study highlighted the importance of incorporating the effect of β to the numerical model for enhancing the model predictions especially for EL/EL0 and P/P0 trends of the MFC solution. In addition, β is useful in simulating the bending nature of the tissue as simulated by the MFC model. However, moderate values of β are recommended to increase the accuracy of the CGMS model predictions.
5. Conclusions
This investigation focused on the development of a two-dimensional (2-D) coarse-grained multiscale (CGMS) model for simulating morphological changes of food-plant tissues during drying. The plant cells were coarse-grained into CG beads to represent cell centroids during drying, and a plant tissue was represented as a CG bead network. The tissue morphology at a particular dryness level is characterised by the steady-state positions of CG bead network. From this study, the following key conclusions could be drawn:• The CGMS model is superior in saving computational time compared to the microscale full cellular (MFC) model and approximately a 98% saving of computational time was achieved while maintaining a higher accuracy for tissues with 86, 105, 149, 182, 203 and 248 number of cells. The CGMS model is further capable of simulating a tissue with 20![[thin space (1/6-em)]](https://www.rsc.org/images/entities/char_2009.gif) 273 cells in just 50 min of computational time while the MFC model is limited.
273 cells in just 50 min of computational time while the MFC model is limited.
• The CGMS model is capable of simulating drying-related morphological changes of macroscale tissues up to 70% of moisture removal. In addition, computationally efficient and stable numerical solutions could be obtained with a favourable agreement compared to the experimental findings, both qualitatively and quantitatively.
• The overall intercellular and intracellular effects during drying of a plant cell are concentrated into five forces which act between adjacent CG beads.
• Three basic model parameters namely, the turgor coefficient (kT), perimeter adjustment coefficient (kPA), and periphery scaling factor (β) were used to reasonably replicate the microscale full cellular (MFC) solution. A minimization criterion which is based on the already-validated MFC model solution can be used for deriving these parameters.
• During drying, the CGMS model exhibits a higher sensitivity for both kT and kPA. However, the model predictions demonstrate higher sensitivity for kT changes while maintaining a lower sensitivity for kPA changes. In the context of fresh tissues, the model is not sensitive for kT and kPA.
• The model is highly sensitive to β at both fresh and dried conditions, while larger β values result in more inflated tissue structure. Without the impact of β, the tissue tends to deform with straight edges which is a deviation from real tissue behaviour for apple fruit. In order to maintain a good agreement with the realistic tissue deformations, the incorporation of β is crucial, and a careful selection is recommended.
In conclusion, the proposed CGMS model provides a pathway to understand the macroscale morphological behaviour of food-plant tissues during drying in a computationally efficient and a more accurate manner. This model can be further improved by incorporating temperature effects to the key CG model parameters to simulate the tissue morphology at different industrial drying conditions. As observed in Section 4.4, different values of kT, kPA and β provide different morphological structures. Therefore, this model could be easily extended to model morphological changes of different tissue varieties during drying, provided that the corresponding cellular dimensions and the MFC solution are available for computing the required CG model parameters. The conceptual framework established in the model can be used to develop 3-D models to simulate actual morphological nature of food-plant materials as well as other biological soft materials, which will be highly applicable in further understanding real-life biological phenomena.
Conflicts of interest
Authors declare no conflicts of interest.6. Appendix
6.1 Interactions due to turgor pressure variations
The turgor pressure of a plant cell varies due to various external and internal factors such as compression, stretching and moisture removal which is observed during drying. The cellular morphology alters as a result of the natural biophysical mechanism of the cellular structure to counterbalance such turgor pressure fluctuations. The eventual cellular morphology is strongly correlated with the difference between turgor pressures at current (P) and fresh (Pf) states.15,41 It can be thus hypothesized that the quantified morphological changes of a plant cell are proportional to the difference between P and Pf (i.e. P − Pf). This hypothesis is used in this computational investigation to position the CG beads based on turgor pressure variations during drying.As shown in Fig. 2(a), assume that the adjacent CG beads i and k have turgor pressures Pi and Pk at a given time t. The CG bead k moves towards CG bead i when Pk < Pf, representing the contraction of the virtual cell of CG bead k under lower pressurised conditions by reducing the inter-bead distance. Similarly, the bead i moves towards bead k when Pi < Pf. Considering this behaviour between any CG bead pair i–k, the net fluid phase turgor pressure that acts to move any CG bead is given by 1/2(Pi − Pf + Pk − Pf), and this quantity is translated into a turgor-induced force on CG bead i as:
 | (3) |
Following the previous cell-based studies,12,13,16,35 the equation of state (EOS) is used to obtain the fluid phase turgor pressure during the motion of CG beads. The cellular fluid is approximated to water due to its diluteness,15 and minor fluctuations of the fluid phase density are allowed assuming a weakly incompressible fluid nature. In EOS, the current and initial turgor pressures of any CG bead i are associated with the current fluid phase density (ρi), initial fluid phase density (ρ0) and compression modulus (K), as shown in eqn (4). Herein, the parameter K is adjusted carefully to meet numerical stability and incompressibility conditions.11,33
 | (4) |
In addition, the total volume of virtual cell for CG bead i can be approximated to that of fluid phase (Vi), since the cell wall thickness is almost negligible compared to the cell radius. A constant cell height (h) is assumed for the numerical convenience. Following these, the rate of change of density (dρi/dt) is formulated as a function of the rate of change of fluid phase mass (dmi/dt) and the rate of change of virtual cell surface area (dAi/dt), as:
 | (5) |
 | (6) |
 | (7) |
6.2 Interactions due to cell wall hardening and tightening effects
These effects are accounted through a cell wall contraction force in recent plant cell drying models.11,12,42 In these studies, the cell wall contraction force is used as a perimeter penalty force, where the cell perimeter is adjusted numerically to experimentally-found cell perimeter value for a given moisture content. Similar to this, FPA force is used to adjust the perimeter of a virtual cell at a given dryness level to the corresponding experimental value. For an interacting pair i–k, the following relationship is developed analogous to eqn (3) as: | (8) |
 | (9) |
 | (10) |
 | (11) |
6.3 Interactions due to the overall viscous behaviour of the cell fluid and cell wall
The viscous behaviour generated by the above intracellular components is simply represented through a damping force Fd which acts to reduce the velocities of CG beads to lower the kinetic energy of the system. For an interacting pair i–k, the viscous force acting on CG bead i from any neighbouring CG bead k can be given as:12| Fdik = −kdvik, | (12) |
6.4 Interactions due to the intercellular bonding
The CG bead repulsion (Fr) and attraction (Fa) forces are employed to model the behaviour of the middle lamella that avoids unphysical cell interactions in real tissues. In CG, Lennard-Jones and Morse potentials are widely used to model particle attractions and repulsions.28–30 However, the Lennard-Jones (LJ) forces are frequently used in related plant cell mechanics to circumvent the fluid particle penetration through the cell wall and to avoid the overlapping of adjacent cell wall particles.11–16,42 Therefore, the LJ force field was chosen in this study to establish Fr and Fa. As shown in Fig. 2(e and f), the LJ force field is activated based on the threshold distance (cut-off radius) r.The cut-off radius strongly relies on the moisture content of the tissue, and the microstructural images for a particular food variety are used to compute r as a function of dry basis moisture content X(masswater/massdry![[thin space (1/6-em)]](https://www.rsc.org/images/entities/char_2009.gif) solid). The average distance between plant cell centroids is taken as r. The parameters r and X are normalised with respect to the values corresponding to the fresh condition (i.e. X/X0 = 1.0). For an interacting pair i–k, the above mentioned forces are defined in eqn (13) and (14) as:12
solid). The average distance between plant cell centroids is taken as r. The parameters r and X are normalised with respect to the values corresponding to the fresh condition (i.e. X/X0 = 1.0). For an interacting pair i–k, the above mentioned forces are defined in eqn (13) and (14) as:12
| Frik = frikdik, | (13) |
| Faik = faikdik. | (14) |
 | (15) |
Acknowledgements
This research study was financially supported by QUTPRA scholarship and ARC Discovery Project (DP180103009). The authors gratefully acknowledge QUT for providing high performance computing and experimental facilities (by Central Analytical Research Facility). A special thank goes to Ms Isuri Weerasinghe and to Ms Sandunika Wickramasinghe for their supports in conducting drying experiments. The authors also extend their gratitude to Mr Sahan Kuruneru for providing helpful discussions and feedback on the manuscript.References
-
A. Chakraverty, A. S. Mujumdar and H. S. Ramaswamy, Handbook of postharvest technology: cereals, fruits, vegetables, tea, and spices, CRC Press, 2003 Search PubMed
.
- C. O. Perera, Drying Technol., 2005, 23, 717–730 CrossRef CAS
.
- S. Chou and K. Chua, Trends Food Sci. Technol., 2001, 12, 359–369 CrossRef
.
- C. M. Rathnayaka, H. C. P. Karunasena, W. Senadeera and Y. T. Gu, Soft Matter, 2018, 14, 2015–2031 RSC
.
-
Y. T. Gu, L. Guan, W. Senadeera, H. C. P. Karunasena and C. M. Rathnayaka, Advances in Agricultural Machinery and Technologies, CRC Press, 2018, pp. 431–454 Search PubMed
.
- B. P. Hills and B. Remigereau, Int. J. Food Sci. Technol., 1997, 32, 51–61 CrossRef CAS
.
- I. N. Ramos, C. L. M. Silva, A. M. Sereno and J. M. Aguilera, J. Food Eng., 2004, 62, 159–164 CrossRef
.
- E. M. López-Méndez, B. Ortiz-García-Carrasco, H. Ruiz-Espinosa, A. Sampieri-Croda, M. A. García-Alvarado, C. E. Ochoa-Velasco, A. Escobedo-Morales and I. I. Ruiz-López, J. Food Eng., 2018, 216, 52–64 CrossRef
.
- S. Curcio and M. Aversa, J. Food Eng., 2014, 123, 36–49 CrossRef
.
- T. Gulati and A. K. Datta, J. Food Eng., 2015, 166, 119–138 CrossRef CAS
.
- H. C. P. Karunasena, W. Senadeera, R. J. Brown and Y. T. Gu, Eng. Anal. Bound. Elem., 2014, 44, 1–18 CrossRef
.
- H. C. P. Karunasena, W. Senadeera, R. J. Brown and Y. T. Gu, Soft Matter, 2014, 10, 5249–5268 RSC
.
- H. C. P. Karunasena, Y. T. Gu, R. Brown and W. Senadeera, Biosyst. Eng., 2015, 132, 71–87 CrossRef
.
- H. C. P. Karunasena, Y. T. Gu, R. J. Brown and W. Senadeera, Drying Technol., 2015, 33, 713–734 CrossRef
.
- H. C. P. Karunasena, W. Senadeera, Y. T. Gu and R. J. Brown, Appl. Math. Model., 2014, 38, 3781–3801 CrossRef
.
- H. C. P. Karunasena, R. J. Brown, Y. T. Gu and W. Senadeera, J. Food Eng., 2015, 146, 209–226 CrossRef CAS
.
- C. M. Rathnayaka, H. C. P. Karunasena, Y. T. Gu, L. Guan and W. Senadeera, J. Food Eng., 2017, 194, 24–39 CrossRef
.
- S. W. Fanta, M. K. Abera, W. A. Aregawi, Q. T. Ho, P. Verboven, J. Carmeliet and B. M. Nicolai, J. Food Eng., 2014, 124, 86–96 CrossRef CAS
.
- K. G. P. Hansani, B. Sumith and H. C. P. Karunasena, Proceedings of the Manufacturing & Industrial Engineering Symposium (MIES), 2016 Search PubMed
.
- P. Ghysels, G. Samaey, P. Van Liedekerke, E. Tijskens, H. Ramon and D. Roose, Int. J. Multiscale Comput. Eng., 2010, 8, 379–396 CrossRef
.
- V. Harmandaris, N. Adhikari, N. F. van der Vegt and K. Kremer, Macromolecules, 2006, 39, 6708–6719 CrossRef CAS
.
- S. Izvekov and G. A. Voth, J. Phys. Chem. B, 2005, 109, 2469–2473 CrossRef CAS PubMed
.
- T. Li, Y. Gu, X.-Q. Feng, P. K. Yarlagadda and A. Oloyede, J. Appl. Phys., 2013, 113, 194701 CrossRef
.
- M. A. Deriu, A. Shkurti, G. Paciello, T. C. Bidone, U. Morbiducci, E. Ficarra, A. Audenino and A. Acquaviva, Proteins: Struct., Funct., Bioinf., 2012, 80, 1598–1609 CrossRef CAS PubMed
.
- A. P. Lyubartsev, Eur. Biophys. J., 2005, 35, 53 CrossRef CAS PubMed
.
- P. Doruker, R. L. Jernigan and I. Bahar, J. Comput. Chem., 2002, 23, 119–127 CrossRef CAS PubMed
.
- C. Peter and K. Kremer, Soft Matter, 2009, 5, 4357–4366 RSC
.
- L. Monticelli, S. K. Kandasamy, X. Periole, R. G. Larson, D. P. Tieleman and S.-J. Marrink, J. Chem. Theory Comput., 2008, 4, 819–834 CrossRef CAS PubMed
.
- T. Strauch, L. Yelash and W. Paul, Phys. Chem. Chem. Phys., 2009, 11, 1942–1948 RSC
.
- S.-W. Chiu, H. L. Scott and E. Jakobsson, J. Chem. Theory Comput., 2010, 6, 851–863 CrossRef CAS PubMed
.
- I. V. Pivkin and G. E. Karniadakis, Phys. Rev. Lett., 2008, 101, 118105 CrossRef PubMed
.
-
L. Taiz and E. Zeiger, Plant Physiology, Sinauer Associates, Sunderland, USA, 2002, ch. 1–10 Search PubMed
.
- P. Van Liedekerke, P. Ghysels, E. Tijskens, G. Samaey, B. Smeedts, D. Roose and H. Ramon, Phys. Biol., 2010, 7, 026006 CrossRef CAS PubMed
.
- H. C. P. Karunasena, W. Senadeera, R. J. Brown and Y. T. Gu, ANZIAM Journal, 2014, 55, C110–C137 Search PubMed
.
-
A. Blum, Plant breeding for water-limited environments, Springer, 2011, pp. 11–52 Search PubMed
.
- P. Van Liedekerke, E. Tijskens, H. Ramon, P. Ghysels, G. Samaey and D. Roose, Phys. Rev. E: Stat., Nonlinear, Soft Matter Phys., 2010, 81, 061906 CrossRef CAS PubMed
.
- H. C. P. Karunasena, P. Hesami, W. Senadeera, Y. T. Gu, R. J. Brown and A. Oloyede, Drying Technol., 2014, 32, 455–468 CrossRef CAS
.
- A. Stukowski, Modell. Simul. Mater. Sci. Eng., 2009, 18, 015012 CrossRef
.
- C. M. Rathnayaka, H. C. P. Karunasena, W. Senadeera and Y. T. Gu, Drying Technol., 2018, 36, 509–522 CrossRef
.
- Y. Bai, M. S. Rahman, C. O. Perera, B. Smith and L. D. Melton, J. Agric. Food Chem., 2002, 50, 3179–3185 CrossRef CAS PubMed
.
- P. V. Liedekerke, P. Ghysels, E. Tijskens, G. Samaey, B. Smeedts, D. Roose and H. Ramon, Proceedings of the 4th international SPHERIC workshop, 2009 Search PubMed.
- C. M. Rathnayaka, H. C. P. Karunasena, W. Senadeera, H. N. Polwaththe-Gallage and Y. T. Gu, Appl. Math. Model, 2019, 67, 219–233 CrossRef
.
| This journal is © The Royal Society of Chemistry 2019 |


