 Open Access Article
Enhanced water splitting through two-step photoexcitation by sunlight using tantalum/nitrogen-codoped rutile titania as a water oxidation photocatalyst†
Shunta
Nishioka
 ab,
Kei-ichi
Yanagisawa
 c,
Daling
Lu
d,
Junie Jhon M.
Vequizo
 e,
Akira
Yamakata
 e,
Koji
Kimoto
 c,
Miki
Inada
 f and
Kazuhiko
Maeda
 *a
*a
aDepartment of Chemistry, School of Science, Tokyo Institute of Technology, 2-12-1-NE-2 Ookayama, Meguro-ku, Tokyo 152-8550, Japan. E-mail: maedak@chem.titech.ac.jp
bJapan Society for the Promotion of Science, Kojimachi Business Center Building, 5-3-1 Kojimachi, Chiyoda-ku, Tokyo 102-0083, Japan
cElectron Microscopy Group, Research Center for Advanced Measurement and Characterization, National Institute for Materials Science, 1-1 Namiki, Tsukuba, Ibaraki 305-0044, Japan
dSuzukakedai Materials Analysis Division, Technical Department, Tokyo Institute of Technology, 4259 Nagatsuta-cho, Midori-ku, Yokohama 226-8503, Japan
eGraduate School of Engineering, Toyota Technical Institute, 2-12-1 Hisakata, Tempaku, Nagoya 468-8511, Japan
fCenter of Advanced Instrumental Analysis, Kyushu University, 6-1 Kasuga-koen, Kasuga, Fukuoka 816-8580, Japan
First published on 5th July 2019
Abstract
Rutile TiO2 codoped with tantalum and nitrogen (TiO2:Ta,N) was assessed as a water oxidation photocatalyst for Z-scheme water splitting driven by visible light. This material was prepared by thermal ammonolysis of TiO2:Ta with dry NH3 at 773 K, while samples of the oxide precursor were synthesized using a microwave-assisted solvothermal technique, applying various conditions. The photocatalytic activity of the TiO2:Ta,N during water oxidation to O2 from an aqueous FeCl3 solution was found to be greatly affected by the synthesis parameters. The rate of O2 evolution was increased upon increasing the level of Ta doping in conjunction with a highly-crystalized TiO2:Ta precursor resulting from applying a higher temperature during synthesis of the oxide. IrO2 loading of the TiO2:Ta,N photocatalyst also improved the O2 evolution activity. The optimized IrO2/TiO2:Ta,N photocatalyst was applied to a Z-scheme water splitting system in combination with Ru/SrTiO3:Rh and in the presence of redox mediators (Fe3+/2+ or [Co(bpy)3]3+/2+). Under AM1.5G simulated sunlight, this system exhibited a maximum solar-to-hydrogen energy conversion efficiency of 0.039%, which was nearly twice as high as the previously reported system with the use of RuO2/TiO2:Ta,N (0.021%).
Introduction
The photocatalytic splitting of water into H2 and O2 is one potential means of producing H2 using solar energy.1–6 Semiconductors capable of absorbing visible light have been extensively studied over the last half century as photocatalysts for water splitting, because visible light accounts for approximately one half of the energy contained in sunlight.1–6 Various reaction schemes have been proposed for water splitting. Among these, the two-step photoexcitation system referred to as the Z-scheme, which uses two different semiconductor photocatalysts, is the most promising because it requires lower energy photons and allows the separation of the H2/O2 mixture that is generated during the water splitting reaction.4–6 In the Z-scheme process, the two semiconductors catalyze H2 and O2 evolution, while a redox shuttle reagent mediates electron transfer between the two materials (Scheme 1). Many semiconductors, including doped metal oxides, solid solutions and mixed anion compounds, have been assessed as visible light water-splitting photocatalysts applicable to either water reduction or oxidation in Z-scheme water splitting.4–18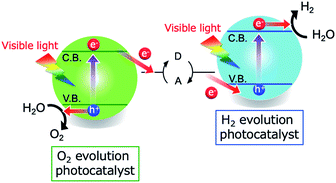 | ||
| Scheme 1 A diagram showing a Z-scheme water splitting system consisting of two different semiconductors and a redox shuttle mediator. | ||
Doping foreign elements into a metal oxide is a conventional approach to obtaining new properties that might assist in water splitting, such as visible light absorption12,19,20 and high carrier concentrations.21,22 As an example, doping of a metal oxide with nitrogen can narrow the band gap of the oxide as a result of substitution of oxide ions with nitride ions, because the valence band potential of the oxide is shifted negatively through the contribution of the N 2p orbitals.19,20 The formation of carriers due to foreign element doping21,22 or defect formation23 in a metal oxide also improves the photocatalytic activity of the oxide, especially with regard to the H2 or O2 evolution half reactions. For these reasons, carefully designed metal oxide photocatalysts based on doping have been shown to function as efficient H2 or O2 evolution photocatalyst in Z-scheme water splitting.4–13,15–18
Our group has recently reported a highly active visible-light-responsive photocatalyst, tantalum/nitrogen codoped rutile titanium dioxide (TiO2:Ta,N), that promotes the oxidation of water to O2.7,24 This photocatalyst can be synthesized via the thermal ammonolysis of rutile TiO2:Ta which, in turn, is produced using a microwave-assisted solvothermal approach. A solar-to-hydrogen energy conversion efficiency (STH) of 0.021% has been obtained using RuO2-modified TiO2:Ta,N and Ru-loaded SrTiO3:Rh as water oxidation and reduction photocatalysts, respectively, in the presence of an Fe3+/Fe2+ redox shuttle mediator. Transient absorption spectroscopy has demonstrated that the codoped tantalum ions in TiO2:Ta,N suppress the defect formation that is otherwise associated with nitrogen doping, thereby prolonging the lifetime of photogenerated free electrons. Therefore, pre-doping of the rutile TiO2 with Ta is essential to the efficient functioning of this catalyst. That is, the precursor oxide (rutile TiO2:Ta) plays an important role in synthesizing the final TiO2:Ta,N material.
Microwave-assisted hydro/solvothermal synthesis is an effective approach to the preparation of nanostructured oxide materials, including photocatalyst powders.25–28 Compared to conventional heating, in which the container is heated from the outside, microwave radiation produces a rapid increase in the internal temperature of the substrate because the microwaves are directly absorbed by solvent, with the temperature rise varying based on the dielectric dissipation factor of the solvent. This rapid heating can lead to interesting phenomena, such as increased reaction rates and selective phase formation.29,30 While microwave-assisted synthesis has been widely applied to the production of various metal oxides,25,27–30 no systematic investigation of the preparation of doped metal oxides such as TiO2:Ta has been reported.
The photocatalytic activity of a semiconductor can be promoted by surface modification with metal/metal oxide nanoparticles, acting as so-called cocatalysts.2,31,32 These cocatalysts facilitate the separation of excited charge carriers2,32 and can also serve as redox reaction sites.2,32 The modification of semiconductor photocatalysts with cocatalysts is especially effective (and even indispensable in some cases) with regard to Z-scheme water splitting in aqueous solutions containing redox shuttle mediators. This is because the cocatalyst improves the selectivity for forward reactions while suppressing undesirable backward reactions.5,6,32–34 As an example, Domen et al. reported that a RuO2 cocatalyst on TaON promotes both the reduction of IO3− and the oxidation of water.33 Abe et al. developed a RuO2 cocatalyst that is active during the selective reduction of IO3− and also improves O2 evolution when used as a co-modifier for a cobalt-based water oxidation cocatalyst.34 Because the effects of loading cocatalysts on rutile TiO2:Ta,N photocatalysts have not yet been investigated in detail, the activity increases provided by such cocatalysts can likely still be significantly improved.
Based on this background, the present work attempted to improve the photocatalytic water oxidation activity of rutile TiO2:Ta,N by refining the synthesis conditions for the semiconductor itself and by optimizing the cocatalyst loading. Rutile TiO2:Ta was synthesized by a microwave-assisted solvothermal approach under various conditions and the resulting materials were used as precursors to obtain TiO2:Ta,N by thermal nitridation with dry NH3 gas. The effects of the synthesis conditions applied during the solvothermal reaction on the photocatalytic activity of the TiO2:Ta,N during water oxidation were investigated in detail. Optimizing the preparation conditions as well as the cocatalyst was found to improve the performance of this catalyst during solar-driven Z-scheme water splitting.
Experimental
Preparation of photocatalysts
Ta-doped rutile TiO2 powders were synthesized via a microwave-assisted technique previously reported in the literature.7 In this method, a quantity of Ti(OiPr)4 (Kanto Chemical, >97.0%, 19.8–19.86 mmol) and an appropriate volume of Ta(OEt)5 (Sigma-Aldrich, 99.98%, 0.14–0.2 mmol) were added to n-hexane (Kanto Chemical, >96.0%, 50 mL) containing HCl (Kanto Chemical, 35–37%, 7 mL) after which the reaction solution was placed in an autoclave and heated at a specific temperature (373–423 K) for 2 h using microwave radiation (400 W). The resulting precipitate was washed with ethanol (Kanto Chemical, >99.5%) and water several times, and then dried at 343 K in an oven. Nitridation of the TiO2:Ta powders was performed by annealing at 773 K under an NH3 flow (Sumitomo Seika Chemicals, >99.9995%, 10 mL min−1) for 30 min in an alumina tube connected to a mass-flow controller.Cocatalyst-loaded samples were prepared by a previously reported impregnation method.33 In each case, the photocatalyst powder was initially dispersed in an aqueous solution of the desired metal precursor with stirring. The precursor was Co(NO3)2·6H2O (FUJIFILM Wako Pure Chemical Corporation, >98.0%), RuCl3·nH2O (Furuya Metal, Ru 41.35 wt%), Na3RhCl6·nH2O (Mitsuwa Chemicals, Rh 15.3 wt%) or Na2IrCl6·6H2O (Kanto Chemical, >97.0%). This was followed by evaporation of the solvent and heating at 573 K for 1 h in air.
The SrTiO3:Rh photocatalyst was obtained by a previously reported hydrothermal method.15,35 In a typical synthesis, Sr(OH)2·8H2O (Kanto Chemical, >96.0%, 22 mmol), TiO2 (JRC-TIO-10, The Catalysis Society of Japan, 19.6 mmol) and Rh(NO3)3 (Kanto Chemical, >80%, 0.5 mmol) were mixed in 50 mL of water, after which the mixture was transferred to a Teflon-lined stainless-steel autoclave and heated at 433 K for 42 h. The resulting precipitate was washed with hot water and room-temperature water, then dried at 363 K in an oven. The hydrothermal product was subsequently mixed with an additional amount of Sr(OH)2·8H2O (1.4 mmol) and heated at 1273 K for 10 h in air. The resulting material was washed with water and dried at 363 K. Finally, the Ru cocatalyst was deposited using a photodeposition method.13,18 In this process, the SrTiO3:Rh (0.3 g) was stirred in an aqueous methanol (Kanto Chemical) solution (100 mL, 10 vol%) containing RuCl3 (3 wt% vs. SrTiO3:Rh) for 3 h and then washed with water several times. The powder was collected and then dispersed in a 10 vol% aqueous methanol solution, followed by irradiation at λ > 400 nm for 3 h to obtain Ru-loaded SrTiO3:Rh (Ru/SrTiO3:Rh). The Ru cocatalyst loading on the SrTiO3:Rh was approximately 2.2 wt%, as determined by inductively coupled plasma-mass spectrometry (ICP-MS) analysis.
Characterization of photocatalysts
The prepared samples were studied by powder X-ray diffraction (XRD; Rigaku, MiniFlex 600; Cu Kα), UV-visible diffuse reflectance spectroscopy (DRS; JASCO, V-670), transmission electron microscopy (TEM; JEOL, JEM-2010F) and X-ray photoelectron spectroscopy (XPS; Shimadzu, ESCA−3400). The binding energies were corrected with respect to the position of the C 1s peak (285.0 eV) for each sample. The chemical compositions were determined using ICP optical emission spectroscopy (ICP-OES; Agilent Technologies, 5100 VDV ICP-OES) and ICP-MS (Agilent Technologies, 7700x). Nitrogen concentrations were assessed using an elemental micro analyzer (J-Science, JM10). The Brunauer–Emmett–Teller (BET) surface areas of the specimens were measured using a BELSORP-mini (MicrotracBEL) at liquid nitrogen temperature (77 K).STEM observations
Scanning transmission electron microscopy (STEM) images were acquired using an electron microscope (Thermo Fisher Scientific, Titan cubed) equipped with spherical aberration correctors (CEOS) and an energy dispersive X-ray spectroscopy (EDS) apparatus, at an acceleration voltage of 300 kV. The convergence semiangle of the incident probe was 18 mrad, with an incident probe current of 18 pA. The detector collection semiangle was from 45.8 to 200 mrad for high-angle annular dark-field (HAADF).Transient absorption spectroscopy
Transient absorption spectroscopy data were acquired using laboratory-built spectrometers described previously.36,37 Briefly, TiO2:Ta,N samples were excited by 450 nm laser pulses from a Nd:YAG laser (Continuum, Surelite I, 6 ns duration, 1.0 mJ, 1 Hz) and the transmittance and reflectance for each specimen were determined below and above 6000 cm−1, respectively, using mid-IR (6000–1000 cm−1; MoSi coil), near-IR (10![[thin space (1/6-em)]](https://www.rsc.org/images/entities/char_2009.gif) 000–6000 cm−1; halogen lamp, 50 W) and visible (25
000–6000 cm−1; halogen lamp, 50 W) and visible (25![[thin space (1/6-em)]](https://www.rsc.org/images/entities/char_2009.gif) 000–10
000–10![[thin space (1/6-em)]](https://www.rsc.org/images/entities/char_2009.gif) 000 cm−1; halogen lamp, 50 W) irradiation. The probe light was dispersed by the spectrometer while the monochromatized mid-IR, near-IR and visible light was detected by an MCT detector (Kolmar), an InGaAs detector and a Si photodiode, respectively. The time resolution of this spectrometer was limited to the range of 1–2 μs as a result of the incorporation of an AC-coupled amplifier (Stanford Research Systems, SR560) in the mid-IR and near-IR regions, and to approximately 4 μs, due to stray light associated with the pump pulse and/or short-lived strong emission from the sample in the visible region.
000 cm−1; halogen lamp, 50 W) irradiation. The probe light was dispersed by the spectrometer while the monochromatized mid-IR, near-IR and visible light was detected by an MCT detector (Kolmar), an InGaAs detector and a Si photodiode, respectively. The time resolution of this spectrometer was limited to the range of 1–2 μs as a result of the incorporation of an AC-coupled amplifier (Stanford Research Systems, SR560) in the mid-IR and near-IR regions, and to approximately 4 μs, due to stray light associated with the pump pulse and/or short-lived strong emission from the sample in the visible region.
Photocatalytic reactions
Photocatalytic O2 evolution reactions were conducted at room temperature using a top-irradiation type cell that was connected to a closed gas circulation system made of glass. In each trial, a 50 mg sample was dispersed in 140 mL of a 10 mM aqueous AgNO3 solution or a 1 mM aqueous FeCl3 (Kanto Chemical, >99.0%) solution (100 mL). In trials in which the O2 evolution reaction was conducted in the co-presence of Fe2+ ions, FeCl2 (FUJIFILM Wako Pure Chemical Corporation, 99.0–102.0%) was also added to the reactant solution. In each trial, the reaction solution was first outgassed using a vacuum pump, after which Ar gas was introduced into the reaction system to a pressure of approximately 5 kPa, and the solution was irradiated with a 300 W Xe lamp (Cermax, PE300BF) operating at an output current of 20 A. The light from the lamp was collected using a CM-1 cold mirror and then passed through an L-42 cut-off filter (λ > 400 nm) prior to reaching the sample. The gases evolved during the reaction were analyzed by gas chromatography (GL Sciences, GC–3200 with a thermal conductivity detector and Ar as the carrier gas).Z-scheme overall water splitting trials were conducted in a similar manner. Quantities of the cocatalyst-modified TiO2:Ta,N (50 mg) and Ru/SrTiO3:Rh (25 mg) powders were dispersed in an aqueous FeCl3 (100 mL, pH 2.4) or tris(2,2′-bipyridyl)cobalt(II) sulfate ([Co(bpy)3]2+, 0.5 mM) solution (100 mL, pH 3.8). The cobalt complex was synthesized according to a previously reported method prior to these trials.16 The pH of the reaction solution was adjusted to the desired value with H2SO4, after which the solution was outgassed and irradiated (λ > 400 nm). In the case of experiments employing simulated sunlight, a HAL-320 solar simulator (Asahi Spectra) served as the light source.
The solar-to-hydrogen energy conversion efficiency (STH) was calculated according to the equation:
Results and discussion
Effects of Ta doping level
Previous work demonstrated that doping of rutile TiO2 with Ta followed by nitridation at the appropriate temperature was necessary to obtain highly active TiO2:Ta,N,7 but the optimal doping amount was not determined. For this reason, we initially performed a detailed investigation of the effects of the Ta doping amount employed during the microwave-assisted solvothermal synthesis on the physicochemical and photocatalytic properties of the TiO2:Ta,N. In the first such trials, the microwave heating temperature was fixed at 423 K.Fig. 1 shows XRD patterns for samples with different Ta doping levels, before and after nitridation. The full width at half maximum (FWHM) values for the diffraction peaks at 36° are summarized in Table S1.† Prior to nitridation, each sample produced a single-phase diffraction pattern corresponding to that expected for rutile TiO2, with no evidence of impurities (Fig. 1a). The diffraction peaks were observed to become sharper (i.e., the FWHM decreased) after annealing under a flow of NH3 gas (Fig. 1b), indicating that the nitridation promoted crystal growth. In addition, the XRD pattern for the sample containing 1.5 mol% Ta exhibited peaks associated with anatase TiO2 after ammonolysis. The positions of the diffraction peaks generated by the oxide precursors changed very little after doping, even at higher Ta doping levels. This lack of change can likely be attributed to the relatively low amount of Ta that was added and/or to the minimal difference in the ionic radii of Ta5+ and Ti4+ in a six coordination environment.38 In addition, no noticeable change in peak positions could be identified after nitridation.
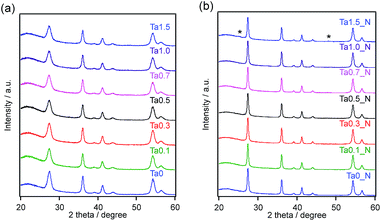 | ||
| Fig. 1 XRD patterns for TiO2:Ta prepared with different levels of Ta doping: (a) before and (b) after nitridation at 773 K. Asterisks indicate diffraction peaks attributed to anatase TiO2. | ||
Fig. 2 presents the UV-visible DRS data for the same set of samples. Each of the oxide materials exhibited an absorption edge at approximately 405 nm, which remained almost unchanged regardless of the Ta doping amount (Fig. 2a). In contrast, the optical properties of the semiconductors were found to change following nitridation (Fig. 2b). Specifically, an absorption band attributed to electron transitions from N 2p to Ti 3d orbitals19,20 appeared in the region of 400–500 nm following nitridation, although the absorption band at approximately 400 nm (assigned to the band gap of the host TiO2:Ta) also remained. The degree of visible light absorption also varied with respect to the amount of Ta added, although there was no clear trend in these variations.
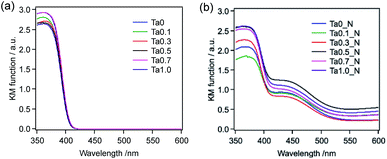 | ||
| Fig. 2 UV-visible DRS spectra of TiO2:Ta prepared with different levels of Ta doping (a) before and (b) after nitridation at 773 K. | ||
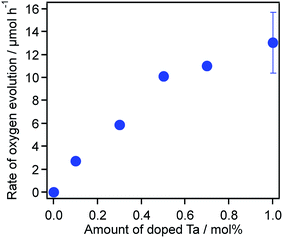
Photocatalytic O2 evolution reactions were conducted using the as-prepared TiO2:Ta,N powders, modified with 0.8 wt% of a RuO2 cocatalyst, in aqueous 1 mM FeCl3 solutions under visible light irradiation (λ > 400 nm). As noted in the Introduction, the RuO2 acted as a bifunctional cocatalyst for reduction/oxidation reactions.31 The photocatalytic activity during O2 evolution was found to sharply increase with increasing Ta doping concentration up to 0.5 mol%, while the undoped sample did not generate O2 under the present conditions (Fig. 3). The O2 evolution rate reached a maximum at 0.5 mol% Ta and essentially plateaued with further increase in the doping level. On the basis of these results, we concluded that a Ta doping amount of 0.5 mol% or more is required to permit TiO2:Ta,N to exhibit high photocatalytic activity during visible-light water oxidation. In the following sections, during analysis of the microwave synthesis, the Ta doping was therefore fixed at 0.7 or 1.0 mol%.
Effects of microwave heating temperature
Because the microwave treatment was expected to greatly affect the TiO2:Ta product, we investigated the effects of applying different temperatures while keeping all other synthesis parameters constant and employing a Ta concentration of 1.0 mol%. Fig. 4a shows XRD patterns for TiO2:Ta specimens prepared using different temperatures, while Table 1 summarizes the FWHM values for the peaks at 36°. All the products produced single-phase diffraction patterns attributable to rutile TiO2. The diffraction peaks became more intense and the FWHM decreased with increasing heating temperature, indicating an improvement in crystallinity.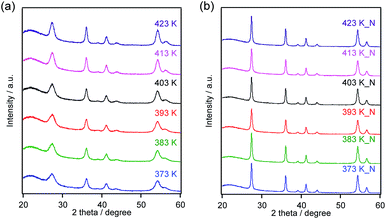 | ||
| Fig. 4 XRD patterns for TiO2:Ta specimens prepared at different temperatures (a) before and (b) after nitridation at 773 K. | ||
| Entry | Heating temperature/K | FWHMa/degree | Specific surface area/m2 g−1 | Nitrogen content in TiO2:Ta,N/wt% | ||
|---|---|---|---|---|---|---|
| Before nitridation | After nitridation | Before nitridation | After nitridation | |||
| a Full width at half maximum for the (101) peak (2θ = 36.0 degree) in the XRD patterns. | ||||||
| 1 | 373 | 0.801 | 0.296 | 80 | 12 | 0.11 |
| 2 | 383 | 0.702 | 0.305 | 73 | 22 | 0.10 |
| 3 | 393 | 0.723 | 0.351 | 41 | 15 | 0.12 |
| 4 | 403 | 0.634 | 0.294 | 45 | 12 | 0.11 |
| 5 | 413 | 0.616 | 0.318 | 86 | 14 | 0.13 |
| 6 | 423 | 0.550 | 0.314 | 37 | 10 | 0.17 |
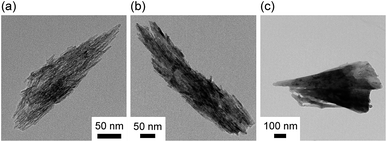
Fig. 5 shows the particle morphology, as observed by TEM. While the morphology of the specimens heated at 383 and 423 K was similar (Fig. 5a and b), a portion of the latter sample evidently underwent crystal growth, forming larger particles with sizes of several hundred nanometers (Fig. 5c). This growth likely resulted from rapid, localized heating in response to the microwave radiation, and could also be related to irregular changes in the specific surface areas of the products (Table 1).
The optical properties of the oxide precursors were examined by means of UV-visible DRS. As shown in Fig. S1,† each specimen showed an absorption edge at approximately 405 nm, although those samples having higher surface areas had absorption edges that were blue-shifted, most likely due to quantum size effects.
The subsequent nitridation process varied the physicochemical properties of the materials dramatically. Fig. 4b shows XRD patterns for the nitrided products, using the same set of oxide materials. Each specimen produced a single-phase diffraction pattern assignable to a rutile structure after nitridation. The FWHM values for the peaks were reduced compared to those for the oxides prior to nitridation (Table 1). These results indicate that crystal growth occurred upon heating at 773 K under a flow of NH3, in agreement with the TEM observations (Fig. S2†). This crystal growth during nitridation was accompanied by a decrease in the specific surface area, to approximately 10–20 m2 g−1. Interestingly, the evident variations in the crystallinity, specific surface area and morphology between the oxide precursors disappeared completely after nitridation.
Nitridation also changed the optical properties of these materials, and Fig. 6 presents the UV-visible DRS spectra of the same series of nitrided samples. As noted above, an absorption band in the range of 400–500 nm appeared after nitridation. While the extent of visible light absorption varied irregularly with respect to the microwave heating temperature, the sample processed at 373 K showed significantly less absorption in the visible region of the spectrum. The nitrogen content was measured by elemental analysis of the same set of nitrided samples, and found to be in the range of 0.1–0.2 wt% (Table 1).
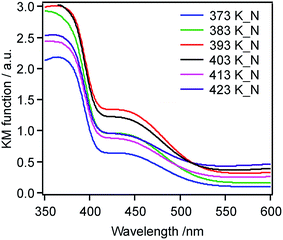 | ||
| Fig. 6 UV-visible DRS spectra for TiO2:Ta,N specimens made from oxide precursors (TiO2:Ta) prepared at different temperatures. | ||
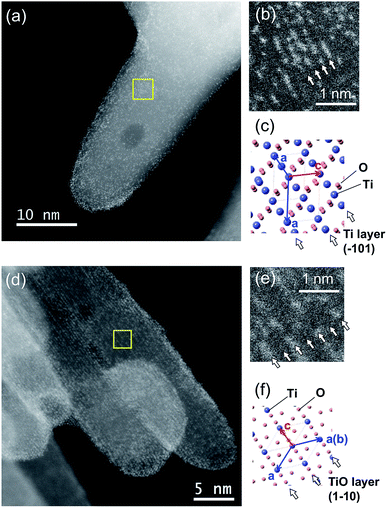
A detailed investigation of the physicochemical state of the Ta dopants was performed so as to ascertain the occupation sites, the actual amounts and the oxidation states. Fig. 7 shows HAADF-STEM images of a TiO2:Ta,N powder with a nominal Ta concentration of 0.7 mol%. The brighter spots in these images correspond to Ta ions because the signal intensity in HAADF imaging is approximately proportional to Z2 (where Z represents the atomic number).39 Here, the Ta sites are seen to be located in Ti{101} and TiO{110} layers. These sites are uniformly distributed throughout the TiO2:Ta,N particles. The concentration of Ta was determined using EDS and ICP-OES. The Ta atom concentrations determined by these techniques were 0.6 and 0.9 mol% (vs. Ti), respectively, both of which are close to the nominal value (0.7 mol%).
The surface oxidation state of the Ta atoms was assessed using XPS, and Fig. S3† presents the Ta 4f XPS spectrum of TiO2:Ta,N (Ta: 0.7 mol%) powder. Two peaks are evident, at 28.1 and 26.3 eV, which can be assigned to Ta 4f5/2 and 4f7/2 orbitals in the Ta2O5.40 It is known that the position of the Ta 4f photoelectron signal is sensitive to the local environment around Ta atoms,41 and these results show that the Ta atoms in the TiO2:Ta,N were in the Ta(V) oxidation state even after thermal ammonolysis.
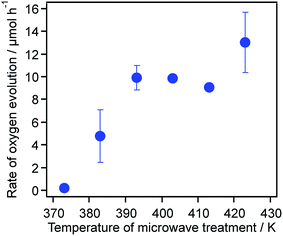
Fig. 8 plots the O2 evolution rates for the TiO2:Ta,N samples as a function of the temperature applied during the microwave synthesis of the oxide precursors. The O2 evolution rate was dramatically accelerated with increasing temperature up to 393 K, beyond which it remained almost unchanged.
Factors affecting the photocatalytic activity of TiO2:Ta,N
The results for the photocatalytic reactions indicate that the activity of TiO2:Ta,N during O2 evolution was significantly affected by the preparation parameters (i.e., the Ta doping amount and the microwave treatment temperature), as shown in Fig. 3 and 8. There were no noticeable differences in the structural and physicochemical properties among TiO2:Ta,N materials with different Ta doping levels (Fig. 1 and Table S1†). In addition, the changes observed in the UV-visible DRS spectra were minimal and somewhat irregular (Fig. 2). However, in the case of photocatalytic O2 evolution reactions in aqueous FeCl3 solutions, the activity was dramatically changed with increasing amount of Ta. In prior work, transient absorption data revealed that Ta doping is necessary to obtain a highly active photocatalyst, because the Ta suppresses the formation of oxygen defects in the TiO2:Ta,N, thus prolonging the lifetimes of photogenerated free and/or shallowly trapped electrons.7 Considering the results of the present study, a Ta doping level of at least 0.5 mol% is likely sufficient for the suppression of defects.The temperature applied during the microwave treatment was also found to be a very important factor affecting the photocatalytic activity (Fig. 8). Changing the temperature resulted in different degrees of crystallinity in the TiO2:Ta precursors (Fig. 4a and Table 1), such that the photocatalytic activity of the TiO2:Ta,N during O2 evolution was enhanced with increasing temperature. While the activity of these materials did not exhibit an obvious correlation with visible light absorption (Fig. 6) or surface area (Table 1), the O2 evolution rate was found to increase as the FWHM of the XRD peaks for the oxide precursors decreased (Table 1). That is, the use of more highly crystalline TiO2:Ta tends to yield higher photocatalytic activity in the resulting TiO2:Ta,N.
Transient absorption spectroscopic analyses of samples synthesized at different microwave treatment temperatures were performed to determine the lifetime of photogenerated free and/or shallowly trapped electrons. Two TiO2:Ta,N samples that showed different activities (383 and 423 K samples) were selected. As shown in Fig. S4,† the lifetimes for these two specimens were almost the same, indicating that the excited carrier dynamics in both materials were similar. These equivalent excited carrier lifetimes as well as the similarities in the other physicochemical properties (e.g., crystallinity, specific surface area and light absorption) suggest that the primary factors affecting the O2 evolution activity are related to surface rather than bulk characteristics. Interestingly, when Ag+ was used as an electron acceptor, the sample heated at 383 K showed a higher rate of O2 evolution (35.1 μmol h−1) than the 423 K sample (21.0 μmol h−1), as shown in Fig. S5,† which was opposite to the results obtained using Fe3+ as the electron acceptor (Fig. 8; 383 K, 4.8 μmol h−1 and 423 K, 13.2 μmol h−1).42 The reduction of Ag+ to Ag is irreversible, while the Fe3+ to Fe2+ reduction is reversible, meaning that there is no competing reductant in a reactant solution containing aqueous AgNO3. In addition, Fe2+ can be photo-oxidized to Fe3+, thereby reducing the rate of the forward water oxidation reaction. We therefore propose that the higher activity for the 423 K sample during O2 evolution from aqueous FeCl3 is attributable to suppression of the reverse reaction (i.e., the oxidation of Fe2+ to Fe3+) and/or enhancement of the reduction of Fe3+.
On the basis of these results, we concluded that the appropriate choice of the oxide precursor for the TiO2:Ta,N is very important for obtaining a highly active TiO2:Ta,N photocatalyst. The critical factors are the Ta doping level (which should be greater than 0.5 mol%) and high crystallinity, which can be obtained by heating at temperatures above 393 K.
Effect of cocatalyst loading on the photocatalytic activity of TiO2:Ta,N
Using the optimized TiO2:Ta,N, we subsequently investigated the effect of cocatalyst loading on the photocatalytic water oxidation activity. Table 2 provides the O2 evolution rates for aqueous FeCl3 solutions containing TiO2:Ta,N (Ta: 0.7 mol%) modified with various metal oxide cocatalysts (0.8 wt% each), loaded by an impregnation method. Each of these metal oxide cocatalysts facilitated the O2 evolution process as compared to the unloaded sample. The IrO2-modified sample showed the highest O2 evolution rate, with stable performance during a 15 h irradiation trial (Fig. S6†). O2 evolution over the IrO2/TiO2:Ta,N was found to cease when 25 μmol of O2 had been generated, which corresponds to the amount expected from the stoichiometry of a reaction involving the four-electron oxidation of water and the one-electron reduction of Fe3+ (100 μmol).| Entry | Cocatalyst | Rate of O2 evolution/μmol h−1 |
|---|---|---|
| a Reaction conditions: catalyst = 50 mg; reactant solution = aqueous FeCl3 (1 mM, 100 mL); light source = Xe lamp (300 W) with a cold mirror (CM-1) and a cutoff filter (L42). | ||
| 1 | None | 0.8 |
| 2 | CoOx | 2.6 |
| 3 | RuO2 | 11.0 |
| 4 | RhOx | 2.5 |
| 5 | IrO2 | 14.1 |
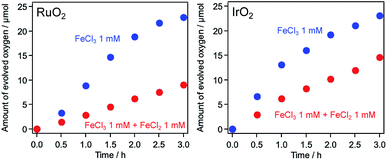
During the O2 evolution reaction from an aqueous FeCl3 solution, photo-oxidation of Fe2+ to Fe3+ can occur, competing with the forward water oxidation reaction. As discussed in the Introduction, it is important to suppress such reverse reactions, because the photo-oxidation of Fe2+ is thermodynamically more favorable than water oxidation.43 The behavior of the IrO2/TiO2:Ta,N photocatalyst during the O2 evolution reaction suggests that the performance of this material is relatively unaffected by the reverse reaction involving Fe2+ to Fe3+ oxidation. To further investigate the effect of IrO2 loading on photocatalytic O2 evolution from aqueous FeCl3 solutions, O2 evolution reactions were performed in the presence of Fe2+ ions. As shown in Fig. 9, the O2 evolution activity for a RuO2-loaded sample was comparable to that for an IrO2-loaded sample in an aqueous FeCl3 solution. In contrast, in an aqueous solution containing both Fe3+ and Fe2+ ions, the activity for the former material was lower than that for the latter. Iridium oxide is known to be an excellent water oxidation catalyst (or cocatalyst) with regard to the generation of O2,44 and so loading of IrO2 on the TiO2:Ta,N likely resulted in efficient water oxidation sites even in the presence of Fe2+. This would explain the higher activity for the IrO2-loaded sample as compared to the material containing RuO2.
The physicochemical characteristics of the most active IrO2-loaded material were further studied, and the electronic states of the IrO2 loaded on the TiO2:Ta,N were investigated by XPS. Fig. 10a shows the Ir 4f XPS spectrum of IrO2-loaded TiO2:Ta,N powder with a nominal Ta level of 0.7 mol%, along with reference data for pure IrO2. The spectrum exhibits two major peaks at binding energies of 64.9 and 62.0 eV, which are consistent with the Ir 4f5/2 and 4f7/2 peaks in the IrO2 reference spectrum.45 This result clearly indicates that the Ir on the TiO2:Ta,N was present as IrO2.
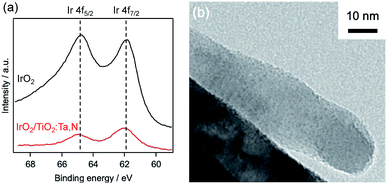 | ||
| Fig. 10 Characterization of 1.0 wt% IrO2-loaded TiO2:Ta,N. (a) Ir 4f XPS spectrum and (b) TEM image. | ||
As shown in Fig. 10b, TEM observations indicated that the IrO2 deposits were uniformly dispersed on the TiO2:Ta,N surface, in the form of nanoparticles with sizes of approximately 1 nm. These particles were readily distinguishable due to the contrast in the images resulting from the different electron densities for Ir and Ti (or Ta).
Z-scheme water splitting using TiO2:Ta,N as an O2 evolution photocatalyst
IrO2-loaded TiO2:Ta,N was subsequently applied as the water oxidation component in a Z-scheme water splitting system in combination with SrTiO3:Rh as a H2 evolution photocatalyst and in the presence of an Fe3+/2+ redox couple. SrTiO3:Rh, which was originally developed by Kudo et al., is a promising photocatalyst for H2 evolution under visible light.15,16,46 The XRD pattern and UV-visible DRS spectrum of the SrTiO3:Rh synthesized in this work are shown in Fig. S7.†Table 3 presents the rates of H2 and O2 evolution from an aqueous FeCl3 solution containing IrO2-loaded TiO2:Ta,N (Ta: 0.7 wt%) and Ru-loaded SrTiO3:Rh. These rates were strongly accelerated in the presence of a small amount of FeCl3 (0.2 mM, entry 2). At higher FeCl3 concentrations, the activity decreased gradually (entries 3–5), possibly due to the reverse reaction of Fe3+ photoreduction. Unmodified TiO2:Ta,N also acted as a water oxidation photocatalyst with Ru/SrTiO3:Rh in the presence of the Fe3+/2+ redox mediator, producing nearly stoichiometric amounts of H2 and O2 (entry 6). The water splitting activity in an aqueous FeCl3 solution was, however, improved upon loading with the IrO2 cocatalyst, by a factor of approximately 4 (entries 2, 7–9). These data again confirm the promotional effect of the IrO2 cocatalyst. In addition, the activity was increased upon increasing the concentration of the IrO2 cocatalyst to 1.0 wt%, beyond which it began to drop. Stoichiometric water splitting into H2 and O2 under visible light irradiation was also achieved using a combination of IrO2/TiO2:Ta,N and Ru/SrTiO3:Rh in aqueous solutions containing [Co(bpy)3]2+ (Fig. S8†), which has been reported to be another effective redox mediator for Z-scheme water splitting.16
| Entry | Concentration of FeCl3/mM | Amount of loaded IrO2/wt% | Rate of gas evolution/μmol h−1 | H2/O2 ratio | |
|---|---|---|---|---|---|
| H2 | O2 | ||||
| a Reaction conditions: catalyst = IrO2/TiO2:Ta,N, 50 mg and Ru/SrTiO3:Rh, 25 mg; reactant solution = aqueous FeCl3 (100 mL, pH 2.4); light source = Xe lamp (300 W) with a cold mirror (CM-1) and a cutoff filter (L42). | |||||
| 1 | 0 | 0.8 | 4.3 | 2.1 | 2.0 |
| 2 | 0.2 | 0.8 | 23.7 | 12.7 | 1.9 |
| 3 | 0.5 | 0.8 | 21.9 | 12.0 | 1.8 |
| 4 | 1.0 | 0.8 | 18.8 | 10.2 | 1.8 |
| 5 | 2.0 | 0.8 | 16.2 | 8.8 | 1.8 |
| 6 | 0.2 | 0 | 8.0 | 3.8 | 2.1 |
| 7 | 0.2 | 1.0 | 29.9 | 15.5 | 1.9 |
| 8 | 0.2 | 1.2 | 21.5 | 10.9 | 2.0 |
| 9 | 0.2 | 1.5 | 17.4 | 9.1 | 1.9 |
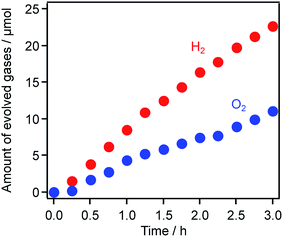
Finally, Z-scheme water splitting was conducted under simulated sunlight (AM1.5G, 100 mW cm−2). As shown in Fig. 11, because H2 and O2 were generated in a nearly stoichiometric ratio, it is clear that this system exhibited solar energy conversion through overall water splitting to store chemical energy in the form of H2. The STH was calculated to be 0.039%, which is 1.9 times higher than the previously reported value for a system using RuO2-loaded TiO2:Ta,N (0.021%).7 In addition, the STH value recorded in this work is comparable to (or a bit higher than) that achieved using a combination of Ir/CoOx/Ta3N5 and Ru/SrTiO3:La/Rh (0.037%), the highest recorded STH for a Z-scheme system based on an (oxy)nitride photocatalyst as the O2 evolution component.47
Conclusions
A microwave-assisted solvothermal approach was applied to the synthesis of Ta-doped rutile TiO2, which was then subjected to thermal nitridation with dry NH3 gas to yield Ta/N-codoped rutile TiO2 (TiO2:Ta,N). The use of a highly crystalline TiO2:Ta precursor, which was obtained by microwave treatment at higher temperatures, was important for obtaining TiO2:Ta,N that exhibited high photocatalytic activity during visible-light water oxidation. It was also found that a minimum level of Ta dopant (here, greater than 0.5 mol%) was necessary to activate the full potential of the TiO2:Ta,N photocatalyst, most likely because of the associated improvement in the lifetime of photogenerated mobile electrons. While TiO2:Ta,N showed activity during water oxidation in the presence of Fe3+ as a reversible electron acceptor, modification with an IrO2 nanoparticle cocatalyst resulted in a marked activity enhancement, by a factor of 17. The IrO2-loaded TiO2:Ta,N photocatalyst could be applied to a Z-scheme water splitting system combined with Ru/SrTiO3:Rh in aqueous FeCl3 (or [Co(bpy)3]2+) solutions under visible light. The maximum solar-to-hydrogen energy conversion efficiency reached 0.039%, which was comparable to values obtained from state-of-the-art Z-scheme systems incorporating (oxy)nitride-based materials as water oxidation photocatalysts.Although the visible light absorption capability of this doped oxide photocatalyst was inferior to that of (oxy)nitrides, we believe that carefully designed doped oxides have significant potential as photocatalysts for visible light water splitting, as clearly demonstrated in this work. Because there are a large number of metal oxides that could be used as host materials for the fabrication of doped photocatalysts, there is still much capacity for the development of more active doped photocatalysts for solar-driven water splitting. This possibility is currently under investigation in our laboratory.
Author contributions
K. M. designed the project. S. N. conducted most of the experiments and analysis, together with K. M. and M. I., J. J. M. V. and A. Y. performed the transient absorption spectroscopic analyses, D. L. conducted the TEM observations, and K. Y. and K. K. conducted the STEM observations. S. N. and K. M. wrote a draft of the manuscript. All authors discussed and provided comments on the experiments and the manuscript during preparation.Conflicts of interest
There are no conflicts to declare.Acknowledgements
This work was supported by a Grant-in-Aid for Scientific Research in the Innovative Area “Mixed Anion” (project numbers JP16H06438, JP16H06440, JP16H06441, JP17H05491 and JP19H04708) from JSPS. The work reported herein was also supported in part by Grants-in-Aid for Young Scientists (A) (project number JP16H06130) and for Challenging Research (Exploratory) (number JP17K19169). S. N. wishes to acknowledge the support of a JSPS Fellowship for Young Scientists (number JP18J10457).Notes and references
- A. Kudo and Y. Miseki, Chem. Soc. Rev., 2009, 38, 253–278 RSC.
- K. Maeda, J. Photochem. Photobiol., C, 2011, 12, 237–268 CrossRef CAS.
- T. Hisatomi, J. Kubota and K. Domen, Chem. Soc. Rev., 2014, 43, 7520–7535 RSC.
- K. Maeda, ACS Catal., 2013, 3, 1486–1503 CrossRef CAS.
- A. Miyoshi, S. Nishioka and K. Maeda, Chem.–Eur. J., 2018, 24, 1–17 CrossRef PubMed.
- Y. Wang, H. Suzuki, J. Xie, O. Tomita, D. J. Martin, M. Higashi, D. Kong, R. Abe and J. Tang, Chem. Rev., 2018, 118, 5201–5241 CrossRef CAS PubMed.
- A. Nakada, S. Nishioka, J. J. M. Vequizo, K. Muraoka, T. Kanazawa, A. Yamakata, S. Nozawa, H. Kumagai, S. I. Adachi, O. Ishitani and K. Maeda, J. Mater. Chem. A, 2017, 5, 11710–11719 RSC.
- A. Nakada, A. Saeki, M. Higashi, H. Kageyama and R. Abe, J. Mater. Chem. A, 2018, 6, 10909–10917 RSC.
- K. Ogawa, A. Nakada, H. Suzuki, O. Tomita, M. Higashi, A. Saeki, H. Kageyama and R. Abe, ACS Appl. Mater. Interfaces, 2018, 11, 5642–5650 CrossRef PubMed.
- S. Sun, T. Hisatomi, Q. Wang, S. Chen, G. Ma, J. Liu, S. Nandy, T. Minegishi, M. Katayama and K. Domen, ACS Catal., 2018, 8, 1690–1696 CrossRef CAS.
- A. Miyoshi, J. J. M. Vequizo, S. Nishioka, Y. Kato, M. Yamamoto, S. Yamashita, T. Yokoi, A. Iwase, S. Nozawa, A. Yamakata, T. Yoshida, K. Kimoto, A. Kudo and K. Maeda, Sustainable Energy Fuels, 2018, 2, 2025–2035 RSC.
- A. Kudo, R. Niishiro, A. Iwase and H. Kato, Chem. Phys., 2007, 339, 104–110 CrossRef CAS.
- Y. Sasaki, A. Iwase, H. Kato and A. Kudo, J. Catal., 2008, 259, 133–137 CrossRef CAS.
- K. Maeda, M. Higashi, D. Lu, R. Abe and K. Domen, J. Am. Chem. Soc., 2010, 132, 5858–5868 CrossRef CAS PubMed.
- H. Kato, Y. Sasaki, N. Shirakura and A. Kudo, J. Mater. Chem. A, 2013, 1, 12327 RSC.
- Y. Sasaki, H. Kato and A. Kudo, J. Am. Chem. Soc., 2013, 135, 5441–5449 CrossRef CAS PubMed.
- Q. Wang, T. Hisatomi, Q. Jia, H. Tokudome, M. Zhong, C. Wang, Z. Pan, T. Takata, M. Nakabayashi, N. Shibata, Y. Li, I. D. Sharp, A. Kudo, T. Yamada and K. Domen, Nat. Mater., 2016, 15, 611–615 CrossRef CAS PubMed.
- H. Suzuki, S. Nitta, O. Tomita, M. Higashi and R. Abe, ACS Catal., 2017, 7, 4336–4343 CrossRef CAS.
- K. Maeda and K. Domen, J. Phys. Chem. C, 2007, 111, 7851–7861 CrossRef CAS.
- H. Kageyama, K. Hayashi, K. Maeda, J. P. Attfield, Z. Hiroi, J. M. Rondinelli and K. R. Poeppelmeier, Nat. Commun., 2018, 9, 772 CrossRef PubMed.
- M. Higashi, Y. Yamanaka, O. Tomita and R. Abe, APL Mater., 2015, 3, 104418 CrossRef.
- F. Amano, R. Tosaki, K. Sato and Y. Higuchi, J. Solid State Chem., 2018, 258, 79–85 CrossRef CAS.
- S. Nishioka, J. Hyodo, J. J. M. Vequizo, S. Yamashita, H. Kumagai, K. Kimoto, A. Yamakata, Y. Yamazaki and K. Maeda, ACS Catal., 2018, 8, 7190–7200 CrossRef CAS.
- A. Nakada, T. Uchiyama, N. Kawakami, G. Sahara, S. Nishioka, R. Kamata, H. Kumagai, O. Ishitani, Y. Uchimoto and K. Maeda, ChemPhotoChem, 2019, 3, 37–45 CrossRef CAS.
- J. Bi, L. Wu, J. Li, Z. Li, X. Wang and X. Fu, Acta Mater., 2007, 55, 4699–4705 CrossRef CAS.
- W. Li, D. Li, W. Zhang, Y. Hu, Y. He and X. Fu, J. Phys. Chem. C, 2010, 114, 2154–2159 CrossRef CAS.
- J. H. Sun, S. Y. Dong, J. L. Feng, X. J. Yin and X. C. Zhao, J. Mol. Catal. A: Chem., 2011, 335, 145–150 CrossRef CAS.
- G. Tan, L. Zhang, H. Ren, S. Wei, J. Huang and A. Xia, ACS Appl. Mater. Interfaces, 2013, 5, 5186–5193 CrossRef CAS PubMed.
- S. Komarneni, R. Roy and Q. H. Li, Mater. Res. Bull., 1992, 27, 1393–1405 CrossRef CAS.
- K. J. Rao, B. Vaidhyanathan, M. Ganguli and P. A. Ramakrishnan, Chem. Mater., 1999, 11, 882–895 CrossRef CAS.
- K. Maeda and K. Domen, J. Phys. Chem. Lett., 2010, 1, 2655–2661 CrossRef CAS.
- K. Maeda and K. Domen, Bull. Chem. Soc. Jpn., 2016, 89, 627–648 CrossRef CAS.
- K. Maeda, R. Abe and K. Domen, J. Phys. Chem. C, 2011, 115, 3057–3064 CrossRef CAS.
- Y. Iwase, O. Tomita, M. Higashi and R. Abe, Sustainable Energy Fuels, 2017, 1, 748–754 RSC.
- S. Nishioka and K. Maeda, RSC Adv., 2015, 5, 100123–100128 RSC.
- J. J. M. Vequizo, H. Matsunaga, T. Ishiku, S. Kamimura, T. Ohno and A. Yamakata, ACS Catal., 2017, 7, 2644–2651 CrossRef CAS.
- A. Yamakata, J. J. M. Vequizo and H. Matsunaga, J. Phys. Chem. C, 2015, 119, 24538–24545 CrossRef CAS.
- R. D. Shannon, Acta Crystallogr., Sect. A: Cryst. Phys., Diffr., Theor. Gen. Crystallogr., 1976, 32, 751–767 CrossRef.
- S. J. Pennycook and D. E. Jesson, Ultramicroscopy, 1991, 37, 14–38 CrossRef.
- S. F. Ho, S. Contarini and J. W. Rabalais, J. Phys. Chem., 1987, 91, 4779–4788 CrossRef CAS.
- W. Chun, A. Ishikawa, H. Fujisawa, T. Takata, J. N. Kondo, M. Hara, M. Kawai, Y. Matsumoto and K. Domen, J. Phys. Chem. B, 2003, 107, 1798–1803 CrossRef CAS.
- Here the O2 evolution rate from aqueous AgNO3 solution was compared by using values recorded at the initial stage of reaction, because the deposition of Ag0, as the result of reduction of Ag+, on TiO2:Ta,N can hinder visible light absorption of the photocatalyst, resulting in slower rate of O2 evolution.
- T. Ohno, D. Haga, K. Fujihara, K. Kaizaki and M. Matsumura, J. Phys. Chem. B, 1997, 5647, 6415–6419 CrossRef.
- A. Harriman, I. J. Pickering, J. M. Thomas and P. A. Christensen, J. Chem. Soc., Faraday Trans. 1, 1988, 84, 2795–2806 RSC.
- M. Rubel, R. Haasch, P. Mrozek, A. Wieckowski, C. De Pauli and S. Trasatti, Vacuum, 1994, 45, 423–427 CrossRef CAS.
- R. Konta, T. Ishii, H. Kato and A. Kudo, J. Phys. Chem. B, 2004, 108, 8992–8995 CrossRef CAS.
- Q. Wang, T. Hisatomi, S. S. K. Ma, Y. Li and K. Domen, Chem. Mater., 2014, 26, 4144–4150 CrossRef CAS.
Footnote |
| † Electronic supplementary information (ESI) available. See DOI: 10.1039/c9se00289h |
| This journal is © The Royal Society of Chemistry 2019 |


