
 Open Access Article
 This Open Access Article is licensed under a
 Creative Commons Attribution 3.0 Unported Licence
Influence of particle size on the apparent electrocatalytic activity of LiMn2O4 for oxygen evolution†
Max
Baumung
 ,
Florian
Schönewald
,
Torben
Erichsen
,
Cynthia A.
Volkert
and
Marcel
Risch‡
*
,
Florian
Schönewald
,
Torben
Erichsen
,
Cynthia A.
Volkert
and
Marcel
Risch‡
*
Institute of Materials Physics, University of Goettingen, Friedrich-Hund-Platz 1, 37077 Goettingen, Germany. E-mail: mrisch@material.physik.uni-goettingen.de
First published on 16th April 2019
Abstract
We investigate LiMn2O4 as a model catalyst for the oxygen evolution reaction (OER), because it shares the cubane structure with the active site of photosystem II. Specifically, we study the influence of different particle sizes of LiMn2O4 on the OER in a sodium hydroxide electrolyte. The product currents of manganese corrosion and oxygen evolution were obtained by rotating ring disk electrodes (RRDE). Physical characterization by various methods supports identical surface chemistry and microstructure of the pristine powders. We obtained similar oxygen current densities of 40(14) μA cmECSA−2 and 26(5) μA cmECSA−2 for micro- and nano-sized particles at 1.68 V vs. RHE. However, the total current densities differed drastically and while the micro-powder had a high disk current density of 205(2) μA cmECSA−2, its faradaic efficiency was only 25%. In contrast, the faradaic efficiency of the nanopowder was at least 75%. We hypothesize that a Mn redox process may occur in the bulk in parallel and possibly in combination with oxygen evolution on the surface based on the observed difference between the total and product current densities. Knowledge of the product currents is crucial for distinguishing the mechanisms of corrosion and catalysis and for designing better catalysts with high faradaic efficiency.
Introduction
An adequate and reliable supply of energy is a necessity in our modern society. Currently, the most common energy vector is burning fossil fuels to generate heat and electricity.1–3 However, due to climate change, political crises in the middle east and rising oil prices, the transition to renewable energy from solar and wind is highly desirable.4 Unfortunately, these sources are not available on demand. Therefore, it is crucial to store the energy from renewables, when it is produced until it is needed. An attractive avenue is the splitting of water for storage of the produced hydrogen. This hydrogen could then be used in a fuel cell to generate electricity. The water splitting reaction is kinetically limited by the oxygen evolution reaction (OER).3,5,6 We focus on LiMn2O4 as a model system in our research as it shares the cubane structure with the active site of photosystem II. Previously, we demonstrated that nano-sized LiMn2O4 is catalytically active in sodium hydroxide electrolytes and interpreted the key mechanistic parameters in the context of natural photosynthesis.7Here, we investigate the influence of the particle size of LiMn2O4 on catalytic activity. A rotation-ring disk electrode (RRDE) setup was used to measure the conventional disk currents and to monitor the trends of either Mn dissolution or oxygen evolution at a ring electrode during 10 cycles. We used X-ray diffraction and electron microscopy to quantify the particle structure and size distribution. While the disk current densities per surface area differed, the detected product currents due to Mn loss and oxygen evolution were identical within error. We hypothesize that the disk current densities differ due to contributions from the bulk, which is discussed in the context of the mechanisms of charge storage and catalysis.
Results and discussion
Characterization of pristine LiMn2O4 particles
XPS-analysis showed no significant difference in the surface electronic structure of the pristine nano- and micro-sized powders (Fig. S1†) so we focused on structural and morphological characterization. XRD measurements identified both oxide powders as LiMn2O4 (Fig. 1), despite slight differences in the peak widths and peak positions. The observed peak shifts indicate differences in lattice constants which may be due to impurities and defects introduced by the different production methods of the LiMn2O4-powders. Using the Scherrer equation (eqn (1)), we obtained a particle size of 47(4) nm for the nano-sized powder. (The Scherrer equation is only valid for particles smaller than 100 nm and was thus not applied to the XRD data of the micron-sized powder.8) | ||
| Fig. 1 (a) XRD diffractogram of nano- and micro-sized LiMn2O4. The background-corrected intensities were normalized to the (111) peak and offset for clarity. HRTEM picture of (b) nano-sized and (c) micro-sized powder as well as interplanar distance for the (111) orientation of (d) nano-sized powder with d111 = 4.68 Å and (e) micro-sized powder with d111 = 4.72 Å. The intensity profiles were obtained in the white boxes and arrows indicate the lattice fringes used in the analysis. | ||
We determined the experimental lattice parameter from the best fit of Bragg's law (eqn (2)) to the six reflections in Fig. 1. The nano-sized powder has a lattice constant of anano = 8.21(1) Å and the micro-sized power a lattice constant of amicro = 8.28(1) Å, which were similar to the expected acrystal = 8.25 Å for LiMn2O4 (single crystals).9 We note that the lattice constant of the previously measured nanopowder was found to be 8.15 Å using Rietveld refinement7 and 8.12(1) Å using Bragg's law. Due to the difference between this work and our previous study,7 the XRD measurements were repeated two additional times, giving anano = 8.22(1) Å and anano = 8.24(1) Å, which are both close to the expected value and deviate by less than 0.4%. The previously measured lower lattice parameter could be due to the specimen not being exactly in the X-ray focus or due to slight lithium10 or oxygen11 deficiency in the investigated powders, which emphasizes the importance of careful storage and measurement of the powders.
Knowing the lattice parameter and space group allows the density of the particles to be calculated as ρnano = 4.339(3) g cm−3 and ρmicro = 4.230(1) g cm−3. The density of LiMn2O4 was previously reported to have a somewhat higher value of 4.436(1) g cm−3 due to the smaller value of the measured lattice constant.7
The lattice spacing of the (111) reflection was also obtained using TEM. The micrographs clearly show lattice fringes up to the surface of nano-sized (Fig. 1b) and micro-sized (Fig. 1c) LiMn2O4 particles. The analysis of ten oscillations in the intensity profiles revealed d111 = 4.68 Å for the nanopowder and d111 = 4.72 Å for the micropowder (Fig. 1d and e). These are smaller than the corresponding (111) diffraction reflections obtained by XRD for the nano-sized (d111 = 4.73 Å) and micro-sized powders (d111 = 4.76 Å). The TEM values have higher uncertainty (≤1%) than the XRD measurements due to a less exact calibration. It also has to be noted, that only a few HRTEM measurements were performed (additional images in Fig. S2 and S3†), so that no statistics could be carried out over a large ensemble of particles, in contrast to XRD. Still, the TEM measured values are comparable to each other and larger trends and changes could have been resolved but were not observed. In summary, the TEM and XRD analyses agree within the accuracy of the methods and support an identical crystal structure of both powders.
We characterized the particle shape and size distributions by SEM (Fig. 2a and b). The micro- and nano-sized particles were mainly truncated octahedrons and some truncated rhombic dodecahedrons (Fig. S4†). Therefore, both pristine powders consist predominantly of {111} facets, with some {100} and {110} facets, in agreement with the calculated equilibrium particle shapes.12 The nano-sized particles tended to agglomerate (Fig. 2a) in contrast to the micro-sized particles which did not agglomerate (Fig. 2b). Additional SEM images may be found in the electronic ESI (Fig. S5†). A TEM investigation of nanopowder sizes showed a comparable particle distribution with the same frequent diameter (Fig. S6†).
 | ||
| Fig. 2 SEM-characterization of (a) nano-sized and (b) micro-sized LiMn2O4 and corresponding histograms of (c) nano-sized and (d) micro-sized LiMn2O4. Dotted lines show the fit to a lognormal distribution. Anodic (squares) and cathodic (circles) currents from cyclic voltammetry of (e) nano-sized and (f) micro-sized LiMn2O4 ink-casted disks for evaluation of the double layer capacitance. Error bars were obtained using at least three independent measurements and may be too small to be visible. | ||
The mean and most common nano-particle diameters were calculated from a lognormal fit to the experimental distribution as 44(14) nm and 42 nm, respectively, which are similar to the crystallite size of 47(4) nm determined by the Scherrer equation. For the micro-sized particles, the mean and most common diameters were calculated as 1.2(6) μm and 1.0 μm, respectively. We approximated the truncated octahedra as spheres for the estimation of the specific surface area (eqn (3)), to obtain 14.376(7) m2 g−1 for nano-sized LiMn2O4. In the work of Köhler et al. the specific surface was calculated as 12.264(2) m2 g−1,7 mainly due to the smaller lattice parameter (and thus larger density). For the micro-sized powder, we calculated a specific surface of 0.490(4) m2 g−1. The latter agrees well with the specific surface of perovskite oxides with similar diameter.13
As an alternative measure of the oxide surface area, we also performed cyclic voltammetry to probe the double-layer capacitance (Fig. S7†). The (differential) capacitance (Cd) of the electrode was obtained by linear regression of the currents at 1.174 V vs. RHE against the sweep speed (Fig. 2e and f). The fit range was chosen to minimize the Pearson correlation coefficient (Table S1†). The capacitance of the micropowder was less reproducible as compared to the nanopowder for reasons that are not entirely clear but possibly the target loading was less accurate for the micropowders, which sedimented quickly during ink-casting. The anodic currents (squares) showed better linearity and were thus selected for evaluation. We obtained capacitances of 1.00(2) mF and 0.07(2) mF for the nano- and micro-sized powders. These capacitances are proportional to the electrochemical surface area (ECSA) but the exact conversion factor (specific capacitance) is not known for LiMn2O4. Nonetheless, using the specific capacitance of α-Mn2O3 of 0.19(8) mF cmox−2,14 gave quite reasonable agreement with the SEM based estimates of the electrode surface areas (Table 1). However, the ratio of the ECSAs of the nanopowder to the micropowder is a factor of two smaller than the ratio of SEM determined areas (Table 1). The discrepancy likely arises due to agglomeration, of the nanoparticles, making much of their surface area inaccessible for the electrochemical measurement. Nonetheless, both methods demonstrate that the surface area of the nanopowder was clearly larger than that of the micropowder as expected.
| Property | Micro (M) | Nano (N) | Ratio N/M |
|---|---|---|---|
| a At 1.68 V vs. RHE applied to disk during 5th cycle. Disk area 0.126 cm2; catalyst loading 0.4 mg cm−2. b Determined by SEM; Fig. 2c and d. c The electrochemical surface area (ECSA) was determined by cyclic voltammetry; Fig. 2e and f. Specific capacitance was assumed to be 0.19(8) mF cmox−2.14 The disk area was 0.126 cm2. | |||
| Disk current (μA)a | 75(7) | 186(4) | 2.5 |
| Ring current (μA)a | 0.178(2) | 7.55(4) | 42.4 |
| Specific surface area (m2 g−1)b | 0.49(4) | 14.38(1) | 29.4 |
| SEM surface (cmSEM2)b | 0.25(1) | 7.19(3) | 29.4 |
| Capacitance (mF)c | 0.07(2) | 1.00(2) | 14.3 |
| ECSA (cmECSA2)c | 0.37(2) | 5.26(3) | 14.3 |
Electrochemical calibration experiments
For the RRDE investigations of stability and activity, the detection potential for manganese and oxygen at the ring has to be selected. The general goal is to find a potential where the reduction of only one species occurs. In order to identify these potentials, we added either oxygen gas or permanganate ions to the sodium hydroxide electrolyte. The platinum ring-electrode was scanned from 0 V vs. RHE to 1.55 V vs. RHE to detect the reduction of these species (Fig. 3). We identified detection potentials of 0.4 V vs. RHE for oxygen and 1.2 V vs. RHE for manganese. We also performed the RRDE experiment at both detection potentials without any rotation (Fig. S8†), which suggested that there was no significant electronic crosstalk between the ring current and the disk current that would affect the product detection.15 | ||
| Fig. 3 Identification of the ring potential for oxygen (dotted; in oxygen-saturated electrolyte) and permanganate (dashed; in argon-saturated electrolyte) by CV. The detection potential was set to 0.4 V vs. RHE for oxygen and 1.2 V vs. RHE for manganese detection as indicated by vertical lines. | ||
The detection potential for manganese could not be set to a potential, for which the detection is limited by Mn transport (i.e. current independent of potential) while avoiding overlap with the detection of oxygen. Thus, only qualitative detection is possible for Mn and we did not correct the measured ring currents for the collection efficiency. The identified detection potential of 1.2 V vs. RHE is identical to that previously used in the literature.16,17
The detection potential for oxygen was set on the current plateau at 0.4 V vs. RHE, where oxygen detection is limited by diffusion of oxygen. This detection potential is also identical to that previously used in the literature.16,17 It is challenging to quantify the amount of the released oxygen, due to bubble formation at the disk electrode and the PTFE (polytetrafluoroethylene) spacer, which prevent a continuous transport to the ring electrode.7,18 Therefore, the oxygen detection is also only qualitative and we did not correct the measured ring currents for the collection efficiency. Since detection of manganese is also possible at 0.4 V vs. RHE, it is imperative to exclude the presence of manganese in the electrolyte. This motivated us to study the activation process of LiMn2O4 described in the next section.
Catalyst activation and performance
The stability of the two types of LiMn2O4 particles was investigated at the detection potential for Mn during cyclic voltammetry (Fig. 4). The ring currents increased above 1.4 V vs. RHE, indicating dissolution of Mn in the electrolyte during the first cycle for both the nano- and micro-sized LiMn2O4 based electrodes. The ring currents for both powders decreased with increasing cycle number and little change was observed between the fifth and tenth cycles. The currents for the nano-LiMn2O4 are similar to our previous study7 and are much larger than for the micro-sized LiMn2O4, presumably due to the much larger surface area. | ||
| Fig. 4 Detection of Mn loss at 1.2 V vs. RHE for (a) nano-sized and (b) micro-sized powder (inset smoothed by Savitzky–Golay method). Post-mortem TEM investigation of (c) nano-sized and (d) micro-sized LiMn2O4 and interplanar distance for the (111) orientation of (e) nano-sized powder with d111 = 4.74 Å and (f) micro-sized powder with d111 = 4.68 Å. The intensity profiles were obtained in the white boxes and arrows indicate the lattice fringes used in the analysis. | ||
We performed post-mortem TEM on electrodes cycled ten times between 1.25 and 1.75 V vs. RHE (Fig. 4c and d), to investigate the stability of both types of particles. Lattice fringes up to the surface could still be resolved after electrochemical cycling. This can be seen most clearly in an additional picture recorded with a higher resolution TEM (Fig. S9†) similar to ref. 7. Neither particle showed evidence of surface amorphization as reported, e.g., for perovskites.17,19,20 The inter-planar distances obtained after catalysis (Fig. 4e and f), are d111 = 4.74 Å for the nanopowder and d111 = 4.68 Å for the micropowder, which are very close to the values of the pristine samples (d111 = 4.68 Å and 4.72 Å, respectively). The lattice fringes were somewhat more difficult to resolve for the thicker microparticles, but are nonetheless clearly detectable, meaning that the crystal structure of LiMn2O4 was preserved for both nano- and micro-sized particles despite loss of Mn from the materials during the initial cycles.
Having confirmed the absence of structural changes due to catalysis, we now discuss the CV traces and corresponding catalytic currents during the fifth cycle, during which the loss of Mn had reached steady state. The CV traces at the disk only show an exponential rise above 1.6 V vs. RHE (Fig. 5a). The shape of the CV trace of the micropowder was slightly asymmetric, which may indicate the hidden shoulder of a redox peak. The disk current of the nano-sized powder was higher than that of the micron-sized powder (Fig. 5a) as expected due to the larger surface area (Table 1). Due to the ambiguity of the total disk current, qualitative detection of oxygen generated at the disk was performed by setting the ring potential to 0.4 V vs. RHE as discussed above (Fig. 5b). The positive-going traces of the ring current follow the same trends as the disk currents, while the negative-going scans show strong hysteresis likely due to trapping of oxygen at the spacer. This effect is particularly pronounced for the micropowder.
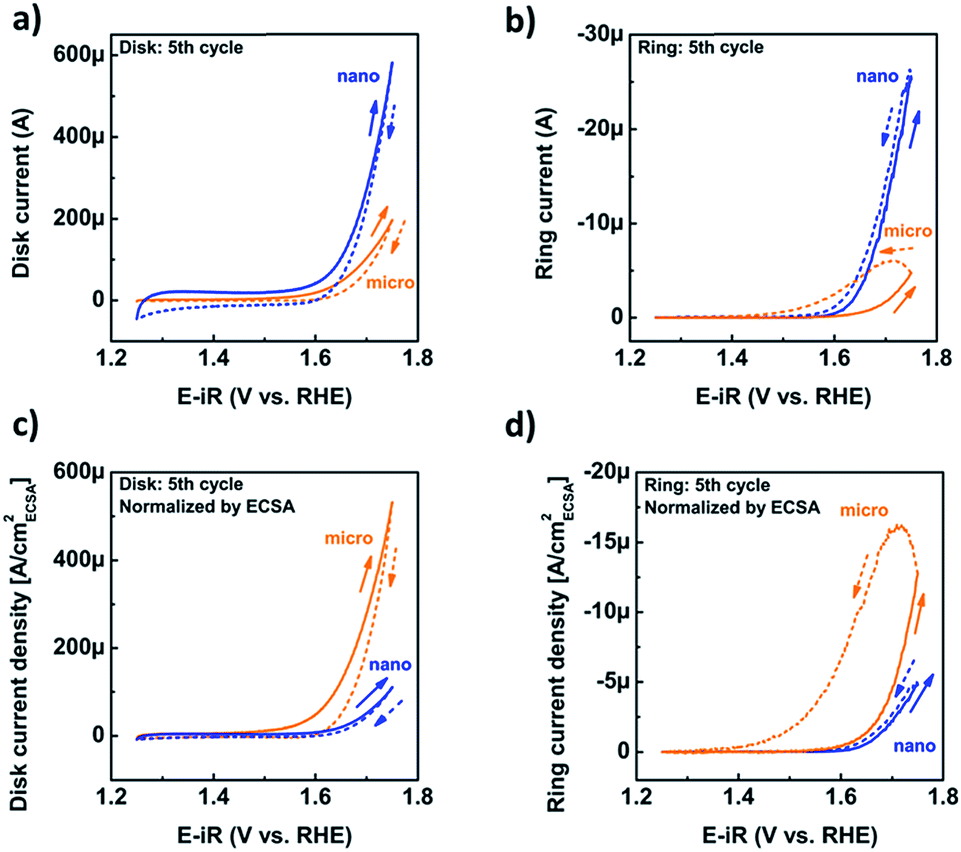 | ||
| Fig. 5 (a) Representative cyclic voltammograms (fifth cycle) of nano- and micro-sized LiMn2O4 ink-casted disks and (b) and ring current of the corresponding oxygen detection at the ring electrode at 0.4 V vs. RHE (c) cyclic voltammetry (fifth cycle) of nano- and micro-sized LiMn2O4 ink-casted disks normalized by the ECSA and (d) and the corresponding oxygen detection at the ring electrode at 0.4 V vs. RHE also normalized by the ECSA of the LiMn2O4 on the disk. The positive-going half cycles are shown as solid lines, while the negative-going half-cycles are shown as dashed lines. | ||
To investigate whether there are intrinsic differences between the two powders, we focused on the currents normalized by the ECSA as a proxy for the active surface area of the oxide. The area from SEM was not considered for the detailed analysis due to particle agglomeration. Surprisingly, the disk (Fig. 5c) and ring (Fig. 5d) current densities of the micropowder exceeded that of the nanopowder, although the ring current densities of the positive-going cycles were similar (Fig. 5d). Due to the observed hysteresis in the negative-going half-cycle (dashed lines), we only evaluated the positive-going half-cycle (solid lines) in detail.
The disk, O2 and Mn ring current densities were recorded at a disk potential of 1.68 V vs. RHE for both particle sizes as a function of cycle number (Fig. 6). The disk current densities of the micro-sized particles are higher than those of the nano-sized particles for all cycles (Fig. 6a). The current densities of both particle sizes decreased with cycle number to a nearly constant value. In contrast, the ring current densities due to oxygen evolution were nearly constant and their averages were the same within error (solid symbols in Fig. 6b). The measured currents are not necessarily directly proportional to the available surface area, e.g., when the electrode loading is varied.21 Yet, the constant and similar ring current densities of the two powders suggest that the activity is proportional to the available surface area. The ring currents due to Mn loss (Fig. 6c) show a similar trend with cycle number to the disk current densities and are the same for both particle sizes within the noise. During later cycles, the experimental error of some points included zero current density, yet the averages (solid symbols) did not vanish. A continuous small loss of Mn was also reported for sputtered manganese oxide by a different method.22
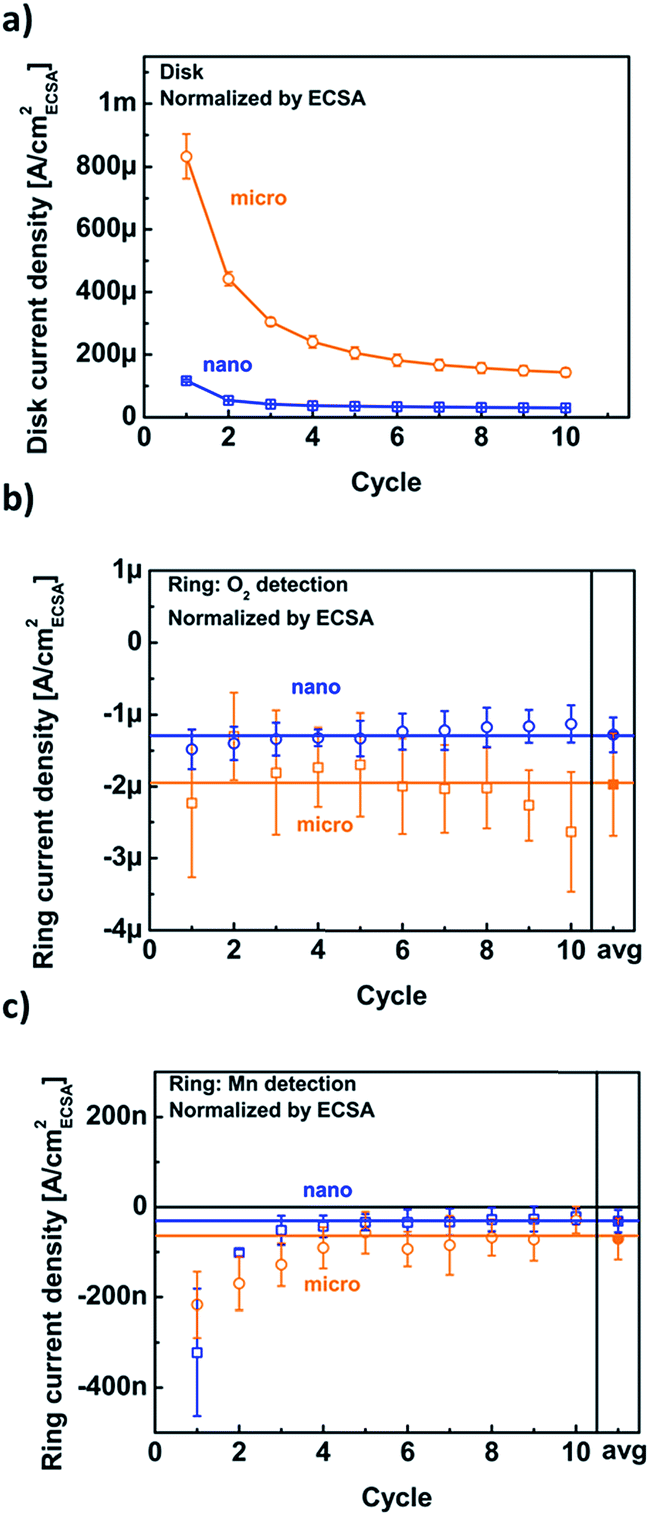 | ||
| Fig. 6 Trends of (a) disk current density, (b) the corresponding current density of the ring set to detect oxygen and (c) the corresponding current density of the ring set to detect manganese. The data points were evaluated at a disk potential of 1.68 V vs. RHE during all ten cycles. Only the positive-going half-cycle was considered and normalized by the ECSA. Error bars indicate the standard deviation of three (nano) and eight (micro) independent measurements. Connecting lines were added to guide the eye. | ||
Identical ring currents due to catalysis (O2) and corrosion (Mn) are expected and have been confirmed because the pristine powders were chemically identical as demonstrated by XPS (Fig. S1†) and have the same crystal facets (Fig. S4†). Moreover, the similarity of the ring current densities due to Mn loss indicates that the surfaces of the micro- and nano-sized LiMn2O4 particles change in the same way with cycle number and thus retain an identical activity per (electrochemical) surface area within experimental error. However, both ring measurements were qualitative and additional analysis is required to quantify the activity for oxygen evolution.
Origin of the disk currents
The disk currents of conventional electrochemical experiments are ambiguous as they do not discriminate between redox currents, catalytic currents and corrosion currents. Using product detection at ring electrodes, we aim to deconvolute the contributions to the disk current. While the ring currents in our setup only qualitatively probed the currents due to catalysis (i.e. O2 detection) and corrosion (i.e. Mn detection), the trends with the number of cycles permit a linear combination analysis of the disk current density according to jdisk = cO2jR,O2 + cMnjR,Mn + cxjx, where cO2, cMn, cx are the coefficients of oxygen evolution, Mn loss and additional processes (i.e. side reactions) with current density jx, respectively, and jO2, jMn the measured uncalibrated current densities at 1.68 V vs. RHE (Fig. 6). The best fit values for the coefficients may be found in Table S3,† where we have assumed that the coefficients are not changed by the particle size or by the cycle number. This is equivalent to assuming that the intrinsic nature of the reactions is not affected by particle size or cycle number and is justified by the chemical and structural characterization of both powders as supported by the previous discussions (Fig. S1, and S4†). The calibrated ring current densities are named after the detected product henceforth, i.e. oxygen and manganese current density.The disk current of the nanopowder was well described by only the first two terms in eqn (1), namely cO2jR,O2 + cMnjR,Mn (Fig. 7a). The oxygen current density was 26(5) μA cmECSA−2 at 1.68 V vs. RHE independently of the cycle number. In contrast, the analysis of the manganese current density suggested that the decay of the disk current density as entirely due to Mn loss, which reached a nearly steady value of 8(7) μA cmECSA−2 at the third cycle. As discussed above, the possibility that the Mn loss contribution has reduced to zero cannot be ruled out within the experimental error. The faradaic efficiency for oxygen evolution can be calculated as {cO2jR,O2}/jdisk. It increased with cycle number from 26% to 75% with 75(2)% after the third cycle, which are lower boundaries as the manganese current density could have vanished. Any change in faradaic efficiency after the third cycle was minor and the electrode can be considered activated thereafter.
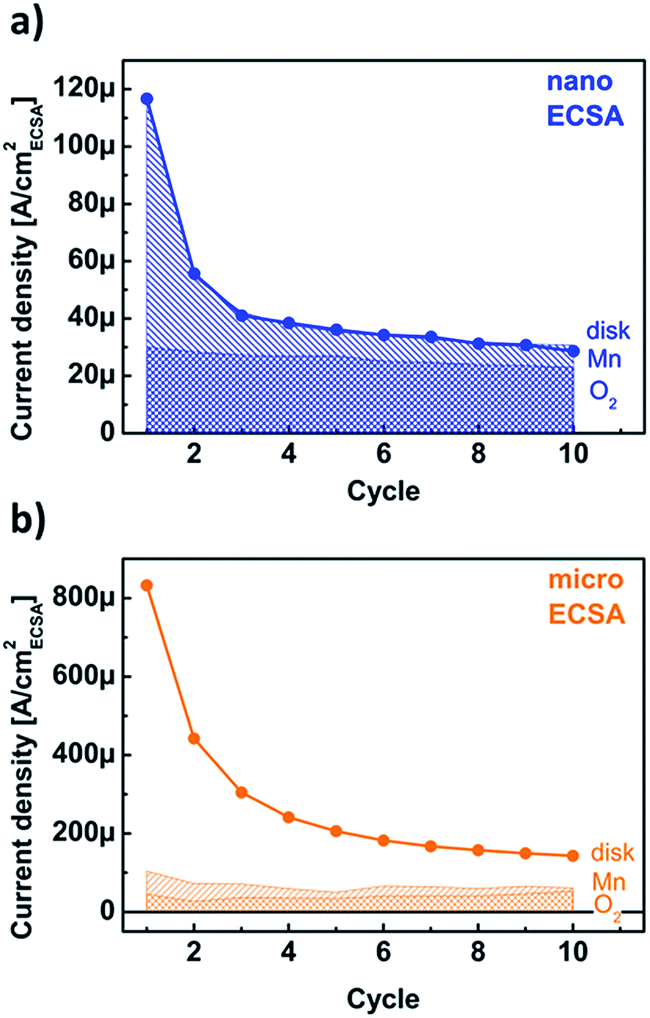 | ||
| Fig. 7 Calculated assignment of the currents due to Mn corrosion (line shade) and catalysis (cross shade) to the measured disk current (black line and circles) for (a) nano-sized and (b) micro-sized LiMn2O4. Calculation details may be found in the text. Connecting lines were added to guide the eye. | ||
The analysis of the micropowder could be fit with the same values of the oxygen evolution and Mn loss coefficients as obtained from the nanopowder, but revealed an additional jx contribution to the measured current density (Fig. 7b). It is worth pointing out that a similar quality fit to the two sets of data in Fig. 7 can be obtained by allowing some contribution from additional jx processes during reaction of the nanopowder. However, the magnitude of the micropowder disk current makes it clear that these additional processes are much stronger for the micropowder than the nanopowder. Consequently, the faradaic efficiency is only 25(8)% and our model suggests that the majority of the measured disk current density of the micropowder comes from a different process.
Product currents are unfortunately rarely reported in the literature. The ECSA-normalized current densities of micro-sized manganese oxides were benchmarked by Jung et al.23 who reported disk currents at 0.35 V overpotential ranging for various ink-casted manganese oxides (Table S4†). Unfortunately, the faradaic efficiencies were not reported. Our micro-sized LiMn2O4 showed a disk current density of 34(3) μA cmECSA−2, which is similar to the value of 31(25) reported for MnO.23 However, our detailed analysis of the product currents showed that only a small fraction of this current contributes to oxygen evolution.
The disk current generally depends on catalytic currents, corrosion currents and redox currents. Having measured and assigned the first two sources, we hypothesize that the remaining contribution is related to manganese redox throughout the particles, including in the bulk. Micro-sized particles have relatively more bulk atoms as compared to the smaller nano-sized particles. Unlike metals, oxides exhibit charged regions near the surface, the space charge layer. Furthermore, LiMn2O4 has also been previously discussed as a material for electrochemical supercapacitors in aqueous solutions24 as well as for non-aqueous25 and aqueous batteries.26 These applications entail redox of manganese ions in the bulk, in most cases associated with Li addition or removal. Mn oxidation of the subsurface has also previously been reported during the activation procedure of another manganese oxide.14 The shape of the CV trace of the micropowder in Fig. 5c further supports that a Mn redox process may occur. However, a definite proof requires additional measurements that are beyond the scope of this report.
Mechanistic considerations and our comparative study suggest that the particle size must be considered in the design of catalysts even in the case of identical surface chemistry and microstructure, since the bulk may contribute to the measured total currents. The mechanisms of manganese oxidation for charge storage in electrochemical capacitors24 and batteries25 are virtually identical to that of the common proposals for electrocatalysts before catalytic turnover.27–29 In particular, we previously concluded that the electrocatalytic mechanism of our nanopowder includes an electrochemical pre-equilibrium step involving manganese oxidation coupled to a proton-transfer.7 This step can also occur in electrochemical energy storage mechanisms that rely on the bulk such as batteries and capacitors, where the charge can also be compensated by species other than protons, e.g., Li. In contrast, catalysis requires the adsorption of the reactant, which can only occur on the surface. While the conditions of the electrochemical pre-equilibrium step may thus be satisfied in the bulk and on the surface, only the pre-equilibrium at the surface is relevant for product formation, i.e. oxygen evolution. Therefore, these spatial considerations can explain the observed commonalities and differences between nano- and micro-sized LiMn2O4, namely identical oxygen current density due to an identical surface chemistry and differing total current due to different bulk volumes.
Experimental
Materials
Micro-sized (electrochemical grade) and nano-sized (>99%) LiMn2O4 were purchased from Sigma-Aldrich. Tetrahydrofuran (THF) was purchased from VWR (≥99.9% stabilized). The electrolyte was 1 M sodium hydroxide Titripur (Merck) solution which was diluted to cNaOH = 0.1 M by ultrapure water (Milli-Q R ≥ 18.2 MΩ). The gases used to purge the electrolytes were purchased from AirLiquide Alphagaz (argon 5.0 and oxygen 4.8). Acetylene carbon black was purchased from Alfa Aesar (≥99.9%) and was acid-treated.30 All other chemicals were used as received.Physical characterization of LiMn2O4 particles
LiMn2O4 particles were characterized by X-ray diffraction (XRD) using a Bruker D8 Discovery with a monochromatized CuKα radiation in the 2θ range from 15° to 85° in 0.05° steps. Specimens for XRD measurements were prepared by gluing the oxide powder to a glass slide. The particle size of the nanopowder was calculated using the Scherrer-equation | (1) |
We determined the experimental lattice parameter according to
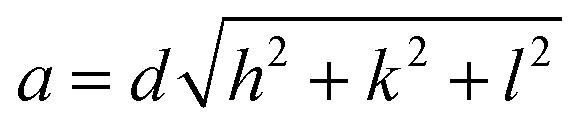 | (2) |
![[thin space (1/6-em)]](https://www.rsc.org/images/entities/char_2009.gif) sin(θ), λCu = 1.5406 Å) and hkl are the Miller indices. The lattice constant of the powders was obtained by linear regression of d of six reflections on the inverse of the square root in eqn (2).
sin(θ), λCu = 1.5406 Å) and hkl are the Miller indices. The lattice constant of the powders was obtained by linear regression of d of six reflections on the inverse of the square root in eqn (2).
Scanning electron microscopy (SEM) was performed in a FEI Nova Nano SEM 650 in a high vacuum mode at 5 kV (micro-sized particles) and 15 kV (nano-sized particles). Specimens for SEM were prepared by mixing 10 mg oxide with 2 mL of THF and applied on a SEM carbon tape. For the evaluation of the average particle size, 200 randomly picked particles were measured. The elliptic shape of the particles was simplified as a circle and the equivalent diameter was calculated from the measured area as  (Fig. 2). Subsequently, we used the Cauchy expression to determine the specific area31
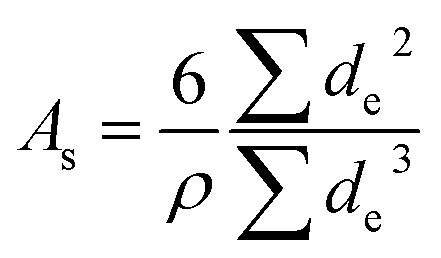 | (3) |
The oxide particles were investigated in high-resolution transmission electron microscopy (TEM) before and after the experiments. For this investigation, we used a FEI Tecnai G2 Spirit at 120 kV. For this, we drop-casted a copper-carbon TEM grid with the catalytic ink. For post mortem analysis, the same procedure was used after washing the particles off the electrode.
Electrochemical setup
For all catalysis experiments, an OrigaFlex system was used, composed of three OGF500 Potentiostats (Origalys SAS) and for the determination of the double-layer capacitance, we used a Gamry Interface 1000E. Our measurement station consisted of a RRDE-3A rotator (ALS Japan Co Ltd.) and custom-made electrochemical cells made of polytetrafluoroethylene (PTFE) cylinders that were used in a three-electrode configuration with a saturated calomel electrode (SCE) (ALS Japan Co Ltd., RE-2B) and a platinum counter electrode. The radial distance between the working and counter electrode or reference electrode was 17 mm. The RRDE-electrode setup consisted of a glassy carbon disk that is 4 mm in diameter (area = 0.126 cm2) and a concentric platinum ring with 5 mm inner diameter and 7 mm outer diameter. These working electrodes (disk and Pt-ring) were separately polished to a mirror finish with Al2O3-micro-polish and cleaned with isopropanol. The used SCE reference electrode was calibrated to the RHE scale (HydroFlex Gaskatel) by determining the offset of characteristic peaks during cyclic voltammetry (CV) on a clean polycrystalline Pt surface in the hydrogen underdeposition region.Electrochemical calibration experiments
The electrolyte was first saturated with oxygen and a CV at the ring electrode was executed between 0–1.75 V vs. RHE at 100 mV s−1 for five cycles at 1600 rpm. The same procedure was carried out for an electrolyte saturated with argon. Afterwards, 10.3 mg of KMnO4 was added to this argon-saturated electrolyte for a final molarity of 1 mM and another CV was carried out. LiMn2O4 catalytic ink was made by mixing 10 mg LiMn2O4 powder, 2 mg carbon black into a slurry of 2 mL THF. After sonication for 30 minutes, 10 μL of this suspension was applied on a polished glassy carbon disk, which was assembled in a RRDE setup. The ink covered the disk completely and homogeneously. The electrolyte was also saturated with argon 30 minutes before any of the electrochemical measurements.Catalytic experiments
Six electrodes of the nanopowder were made so that three measurements each could be recorded with the ring set to oxygen and manganese. Due to the higher experimental errors, fifteen electrodes of the micropowder were prepared, of which three were recorded with the ring set to manganese and twelve with the ring set to oxygen. Of the latter, four measurements were discarded as the values differed by more than 50% from the median of all measurements. All catalytic experiments were performed using the same protocol. The disk electrode was conditioned at 1.25 V vs. RHE for three minutes and afterwards a CV between 1.25 V and 1.75 V vs. RHE was carried out at 10 mV s−1 for ten cycles at 1600 rpm. The ring electrode was set to the identified detection potential for manganese (1.2 V vs. RHE) or oxygen (0.4 V vs. RHE). All characterization and electrochemical experiments were carried out at room temperature. Subsequently, we performed electrochemical impedance spectroscopy in the range from 100 kHz to 1 Hz to determine the uncompensated resistance and correct the applied voltage for the ohmic drop. Typical uncompensated resistances were 50.72(1) Ω for electrodes coated with nano-sized and 47.64(4) Ω for micro-sized LiMn2O4.Electrochemical determination of double-layer capacitance
For the determination of the double layer capacitance all experiments were performed without rotation and a disconnected ring electrode. Data acquisition was performed in the ‘surface mode’ to capture the capacitive currents. The lower scan potential of 1.1 V vs. RHE was held for 60 seconds to equilibrate the powders, followed by cyclic voltammetry between 1.1 and 1.25 V vs. RHE with various scan rates (10, 20, 40, 80, 100, 150, 200 mV s−1) was executed (Fig. S7†).Conclusions
We observed an influence of the particle size on the electrocatalytic activity. Two commercial powders LiMn2O4 with mean particle sizes of 44(14) nm (nano) and 1.1(5) μm (micro) were selected for this study. They had nominally identical chemical composition and valence as probed by XPS. We determined similar lattice parameters of anano = 8.21(1) Å and amicro = 8.28(1) Å that were also directly visible as lattice fringes in TEM. Based on the differential capacitance, we obtained ECSA of 5.26(3) cmECSA2 for the nanopowder and 0.37(2) cmECSA2 for the micropowder, which was used to calculate the current density per particle surface. The ring potentials for Mn (1.2 V vs. RHE) and O2 (0.4 V vs. RHE) detection were identified firstly for the qualitative detection of the product currents and secondly for quantitative evaluation based on linear combination analysis. The total disk current densities decayed, which matched the trend of the current density due to manganese loss. The main reduction occurred in the first three cycles and we considered the catalyst fully activated after five cycles due to minor changes thereafter. The current density due to oxygen evolution was constant independently of cycling and the oxygen current densities (per ECSA) were identical for both powders as expected for identical surface chemistry and microstructure. The oxygen current densities were identical within error, namely 40(14) μA cmECSA−2 and 26(5) μA cmECSA−2 for micro- and nano-sized LiMn2O4, but only the latter had a faradaic efficiency of at least 75%. We hypothesized that Mn redox in the bulk of micro-sized LiMn2O4 was the source of the large disk current density (per ECSA), while the oxygen current densities of the micro- and nano-powders were identical due to identical surfaces. Bulk redox processes drive electrochemical energy storage in capacitor and battery materials, which provides a mechanistic link between these different subfields of electrochemistry. Furthermore, corrosion processes are often, if not always, in competition with catalysis. Therefore, the detailed knowledge of product currents is crucial, on the one hand for the rational design of better electrocatalysts as it is the relevant metric that should be optimized by materials design and on the other hand for a mechanistic understanding when more than one product is formed.Conflicts of interest
There are no conflicts to declare.Acknowledgements
The authors are grateful for the financial support by the collaborative research center (CRC) 1073 (SFB 1073, project C05) sponsored by the Deutsche Forschungsgemeinschaft (DFG). We also like to thank Mr R. Köhler and Prof. Dr W. Viöl (HAWK) for the XPS measurement. The XPS instrument was funded by the DFG.Notes and references
- N. Armaroli and V. Balzani, Angew. Chem., Int. Ed., 2007, 46, 52–66 CrossRef CAS.
- P. C. K. Vesborg and T. F. Jaramillo, RSC Adv., 2012, 2, 7933–7947 RSC.
- R. Schlögl, Top. Catal., 2016, 59, 772–786 CrossRef.
- N. S. Lewis and D. G. Nocera, Proc. Natl. Acad. Sci. U. S. A., 2006, 103, 15729–15735 CrossRef CAS PubMed.
- R. Dufo-López, J. L. Bernal-Agustín and J. Contreras, Renewable Energy, 2007, 32, 1102–1126 CrossRef.
- J. Qi, W. Zhang and R. Cao, Adv. Energy Mater., 2018, 8, 1701620 CrossRef.
- L. Köhler, M. Ebrahimizadeh Abrishami, V. Roddatis, J. Geppert and M. Risch, ChemSusChem, 2017, 10, 4479–4490 CrossRef PubMed.
- A. Weibel, R. Bouchet, F. Boulc’ and P. Knauth, Chem. Mater., 2005, 17, 2378–2385 CrossRef CAS.
- J. Akimoto, Y. Takahashi, Y. Gotoh and S. Mizuta, Chem. Mater., 2000, 12, 3246–3248 CrossRef CAS.
- M. M. Thackeray, A. de Kock and W. I. F. David, Mater. Res. Bull., 1993, 28, 1041–1049 CrossRef CAS.
- P. Strobel, F. Le Cras, L. Seguin, M. Anne and J. M. Tarascon, J. Solid State Chem., 1998, 135, 132–139 CrossRef CAS.
- A. Karim, S. Fosse and K. A. Persson, Phys. Rev. B: Condens. Matter Mater. Phys., 2013, 87, 075322 CrossRef.
- J. Suntivich, K. J. May, H. A. Gasteiger, J. B. Goodenough and Y. Shao-Horn, Science, 2011, 334, 1383–1385 CrossRef CAS PubMed.
- M. Kölbach, S. Fiechter, R. van de Krol and P. Bogdanoff, Catal. Today, 2017, 290, 2–9 CrossRef.
- S. Vesztergom, N. Barankai, N. Kovács, M. Ujvári, P. Broekmann, H. Siegenthaler and G. G. Láng, Electrochem. Commun., 2016, 68, 54–58 CrossRef CAS.
- Q. Gao, C. Ranjan, Z. Pavlovic, R. Blume and R. Schlögl, ACS Catal., 2015, 5, 7265–7275 CrossRef CAS.
- M. Risch, A. Grimaud, K. J. May, K. A. Stoerzinger, T. J. Chen, A. N. Mansour and Y. Shao-Horn, J. Phys. Chem. C, 2013, 117, 8628–8635 CrossRef CAS.
- J. Scholz, M. Risch, K. A. Stoerzinger, G. Wartner, Y. Shao-Horn and C. Jooss, J. Phys. Chem. C, 2016, 120, 27746–27756 CrossRef CAS.
- K. J. May, C. E. Carlton, K. A. Stoerzinger, M. Risch, J. Suntivich, Y.-L. Lee, A. Grimaud and Y. Shao-Horn, J. Phys. Chem. Lett., 2012, 3, 3264–3270 CrossRef CAS.
- B. Han, M. Risch, Y.-L. Lee, C. Ling, H. Jia and Y. Shao-Horn, Phys. Chem. Chem. Phys., 2015, 17, 22576–22580 RSC.
- W. Hu, Y. Wang, X. Hu, Y. Zhou and S. Chen, J. Mater. Chem., 2012, 22, 6010–6016 RSC.
- R. Frydendal, E. A. Paoli, B. P. Knudsen, B. Wickman, P. Malacrida, I. E. L. Stephens and I. Chorkendorff, ChemElectroChem, 2014, 1, 2075–2081 CrossRef CAS.
- S. Jung, C. C. L. McCrory, I. M. Ferrer, J. C. Peters and T. F. Jaramillo, J. Mater. Chem. A, 2016, 4, 3068–3076 RSC.
- F. X. Wang, S. Y. Xiao, Y. S. Zhu, Z. Chang, C. L. Hu, Y. P. Wu and R. Holze, J. Power Sources, 2014, 246, 19–23 CrossRef CAS.
- M. M. Thackeray, J. R. Croy, E. Lee, A. Gutierrez, M. He, J. S. Park, B. T. Yonemoto, B. R. Long, J. D. Blauwkamp, C. S. Johnson, Y. Shin and W. I. F. David, Sustainable Energy Fuels, 2018, 2, 1375–1397 RSC.
- R. Trócoli, C. Erinmwingbovo and F. LaMantia, ChemElectroChem, 2017, 4, 143–149 CrossRef.
- H. Dau, C. Limberg, T. Reier, M. Risch, S. Roggan and P. Strasser, ChemCatChem, 2010, 2, 724–761 CrossRef CAS.
- W. T. W. T. Hong, M. Risch, K. A. K. A. Stoerzinger, A. Grimaud, J. Suntivich and Y. Shao-Horn, Energy Environ. Sci., 2015, 8, 1404–1427 RSC.
- B. Han, R. R. Rao, L. Giordano, Y. Shao-Horn, W. T. Hong, K. A. Stoerzinger and M. Risch, Catal. Today, 2015, 262, 2–10 CrossRef.
- J. Suntivich, H. A. Gasteiger, N. Yabuuchi and Y. Shao-Horn, J. Electrochem. Soc., 2010, 157, B1263–B1268 CrossRef CAS.
- S. Trasatti and O. A. Petrii, J. Electroanal. Chem., 1992, 327, 353–376 CrossRef CAS.
Footnotes |
| † Electronic supplementary information (ESI) available. See DOI: 10.1039/c8se00551f |
| ‡ Current address: Helmholtz Zentrum Berlin für Materialien und Energie, Young Investigator Group Oxygen Evolution Mechanism Engineering, Hahn-Meitner-Platz 1, 14109 Berlin, Germany. |
| This journal is © The Royal Society of Chemistry 2019 |