
Physico-chemical elimination of unwanted CO2, H2S and H2O fractions from biomethane
Muhammad Rashed
Al Mamun
 a,
Shuichi
Torii
b,
Mohammed M.
Rahman
c and
Mohammad Razaul
Karim
*d
a,
Shuichi
Torii
b,
Mohammed M.
Rahman
c and
Mohammad Razaul
Karim
*d
aDepartment of Farm Power and Machinery, Faculty of Agricultural Engineering and Technology, Sylhet Agricultural University, Sylhet-3100, Bangladesh
bDepartment of Advanced Mechanical System Engineering, Graduate School of Science and Technology, Kumamoto University, 2-39-1 Kurokami, Kumamoto 860-8555, Japan
cCenter of Excellence for Advanced Materials Research (CEAMR) & Chemistry Department, King Abdulaziz University, P. O. Box 80203, Jeddah 21589, Saudi Arabia
dDepartment of Chemistry, School of Physical Sciences, Shahjalal University of Science and Technology, Sylhet-3114, Bangladesh. E-mail: krazaul@yahoo.com
First published on 19th November 2018
Abstract
Biomethane, the principal component of biogas, is one of the major alternatives to fossil fuel. Reducing the amount of carbon dioxide (CO2), hydrogen sulfide (H2S) and water (H2O) content from their mixture with methane (CH4) in biogas is necessary for ensuring their practical applications as fuels and the minimum methane (CH4) content is stipulated to be 95%. Herein, a facile process for the combined removal of CO2, H2S and H2O by using two different sets of purifying mixtures including calcium hydroxide (Ca(OH)2) + activated carbon + silica gel for experiment T1 and Ca(OH)2 + zero-valent iron (Fe0) + sodium sulphate (Na2SO4) for experiment T2 is presented. The CO2 concentration was reduced from 33% in raw biogas to 2.65 and 4.8% in biogas treated in T1 and T2, respectively. The corresponding H2S concentration falls from 365 ppm to 14 and 29 ppm, while H2O content decreased from 5% to 0.03 and 0.87%. As a result of this physico-chemical minimization of the unwanted gas fraction, the overall biomethane concentration increased from 62% in raw biogas to 97.55 and 95.02% in the purified gas after the accomplishment of the purification process by experiments T1 and T2, respectively. We propose that this purification method can be applied in a small farmland or rural area to obtain purified biomethane.
Introduction
Biomethane is a popular alternative energy source nowadays. Worldwide research on sustainable energy technology is driven mainly to limit the use of fossil fuels.1,2 In order to face the threat of global energy crisis and environmental pollution associated with fossil fuel-fired power plants, there is an increasing interest in finding alternative energy sources.3 Biogas generation and its utilization have become a popular approach in this respect. Biogas is a cheap, environmentally friendly and easily processable renewable energy source.4–9 In particular, the anaerobic digestion of solid biomass is considered as a feasible alternative to the possibility of producing biomethane enriched biogas from solid wastes in small-scale plants, farmlands and rural areas. Biogas is a combustible gas generated by the action of micro-organisms on biodegradable wastes of plants and animals. The combustible component of biogas is methane (CH4), which has a high calorific value with the least emission of harmful and greenhouse gases. As an additional benefit, production of biogas by the action of micro-organisms on bio-waste is favoured greatly in the absence of air and the process is known as anaerobic metabolism. The process can be proceeded both in mesophilic (30.0 °C) and thermophilic (65.0 °C) conditions for solid wastes digestion in the urban area and hence is associated with waste management, pollution control and fertilizer generation.10 Usually, biogas is a medium-energy content fuel with energy efficiency of ∼22.0 MJ kg−1, as the major component of biogas is CH4.11 However, a major drawback of using raw biogas generated in a gas plant is the presence of other non-combustible gaseous components with methane. The complete production of biogas over a 25–45 days digestion time inside the reactor is associated with the generation of unwanted gas fractions including carbon dioxide (CO2), hydrogen sulfide (H2S) and water (H2O). Owing to the high volume of such unwanted gaseous components and the impossibility of generating the gas instantly for use, biogas failed to attract wider interest for large-scale use. Nevertheless, in recent years, some efforts have successfully considered the application of biogas in small farmlands or rural areas for use in heating, transportation or running small households and agriculture machinery. The low cost of setting the gas plant, the high benefit to cost ratio and opportunity for solid waste management, pollution control and fertilizer generation have added additional interest for the generation and use of biogas.Besides methane (40–75%), the major components of biogas produced from the nonaerobic process contain 15–60% carbon dioxide. It also contains minor amounts of water (5–10%), hydrogen sulphide (0.005–2%) and traces of siloxanes (0–0.02%), halogenous volatile organic compounds (VOCs, <0.6%), ammonia (NH3, <1%), oxygen (O2, 0–1%), carbon monoxide (CO, <0.6%) and nitrogen (N2, 0–2%). The composition of the components varies depending on the type of biomass raw material and production methods.12–16 The fuel value of biogas is proportional to the CH4 concentration. For use as a fuel in internal combustion engines, the CH4 content in biogas must be higher than 90%.17
The unwanted gases have some harmful effect on the machinery. For example, the high CO2 content (∼40%) in raw biogas reduces the engine efficiency and power output by increasing the carbon monoxide and hydrocarbon emissions. Thus, the use of biogas in power plants or internal combustion engines is hindered.4,18,19 The presence of H2S causes corrosion in the engine or piping system by forming metal sulfides through chemical reactions with metallic parts. Therefore, removal of contaminated gases from raw biogas is necessary not only to increase the caloric value, but also to use the gas safely without facing any corrosion risks.20 The corrosion mechanism of sulfur is initiated in the presence of an H2S concentration higher than 50 ppm.21 The valve systems, bronze gears and the exhaust system are attacked by H2S and the deterioration of engines becomes significant. In general, the presence of H2S in biogas reduces the lifetime of the engine by 10 to 15%.11 Water also functions as corrosive materials when react with H2S as well as reduce the caloric value. Water forms acids with H2S and CO2, which react with the compressors, gas storage tanks etc. By means of condensation and freezing the water fraction reduces the lifetime of pipelines.22 Therefore, it is necessary to reduce the CO2, H2S and H2O content from raw biogas.
There exist a number of methods for the biomethane upgradation process and removal of the unwanted gas fraction from biogas mixtures. All the processes are associated with their own advantages and disadvantages, which were discussed in some previous studies.22–32 In short, the processes include physical adsorption, chemical treatment, reverse flow of gas through various scrubbing towers and separation of the harmful component using a number of polymeric molecular filters. However, in small-scale plants and rural farmhouses, it is quite feasible to employ physico-chemical adsorption and precipitation methods, as these are associated with simple and affordable techniques with a low cost set up. Based on this necessity, herein, we report a combined process for the removal of CO2, H2S and H2O through a single stage operation. We used two different sets of purifying agents in the form of their solid phase adsorbent mixtures: calcium oxide (CaO), activated carbon and silica gel, and CaO, zero-valent iron (Fe0) and sodium sulfate (Na2SO4), for experiments T1 and T2, respectively. The successful elimination of CO2, H2S and H2O content from raw biogas along with the increment in the CH4 percentage indicates the potential of these processes for using biogas in rural areas and small-scale plants.
Materials and methods
1. Anaerobic metabolism unit
The instrumental setup for the biodegradation of solid wastes into biogas in the absence of oxygen is known as the digester. We used a laboratory scale batch digester made of a 200.0 L polypropylene tank as the reactor digester. The tank was fitted with an airtight rubber gasket to prevent any unwanted mass or heat transfer. The apparatus associated with the digester includes: (1) a hopper through which a slurry of biomass and water is transported inside the digestion chamber, (2) inlet piping which transports the slurry from the hopper into the fermentation chamber and (3) a 12.0 mm (diameter) hose pipe for allowing the generated raw biogas to flow from the fermentation unit to the collection chamber. The control valves in every mass transfer unit regulate the flow of slurry or raw biogas. In addition, there is a safety outlet for pressure release inside the digester and a bio-slurry outlet includes a collection tank and an excess water expelling system through a drainage pipe fitted with a gate valve.2. Preparation of feedstock
Three different types of organic wastes, namely, cafeteria waste (CW), vegetable waste (VW) and fruit waste (FW) were collected from a nearby vegetable market and restaurants. Cow manure (CM) was collected from a dairy farm. Except for the CM other larger sized raw materials were crushed into small pieces of 2.0 mm sizes with a mechanical blender. The blended samples were mixed with an equal proportion of CW![[thin space (1/6-em)]](https://www.rsc.org/images/entities/char_2009.gif) :VW:FW:CM = 1:1:1:1 and diluted with tap water in the ratio of 1:1 (w/w). The prepared feedstock having a volume of 160.0 L was charged inside the digester. A higher volume of feedstock was avoided carefully for allowing possible compression/explosion of generated biogas due to insufficient vacant space inside the digester.
:VW:FW:CM = 1:1:1:1 and diluted with tap water in the ratio of 1:1 (w/w). The prepared feedstock having a volume of 160.0 L was charged inside the digester. A higher volume of feedstock was avoided carefully for allowing possible compression/explosion of generated biogas due to insufficient vacant space inside the digester.
3. Preparation of purifying agents
All the reagent grade chemicals including CaO, activated carbon, silica gel, Fe0 and Na2SO4 were purchased from Kanto Chemical Co. Ltd, Japan. Activated carbon was in a powdered form with ∼100 mesh, ∼600 m2 g−1 surface area and ∼0.95 mL g−1 pore volume. Other materials were in a granular state. The materials were used without any further purification except mentioned any condition elsewhere. CaO, Na2SO4 and silica gel were crushed manually into a powdered form to increase the surface area. For the batch type treatment process, two sets of purifier mixtures, CaO + activated carbon + silica gel and CaO + Fe0 + Na2SO4, were employed in two different experiments, namely T1 and T2. Varied amounts (1–10 g) of CaO were dissolved in 1 L water to convert them into Ca(OH)2 of varied concentrations. The experimental conditions including time needed per test, the pressure of the system and gas flow rates maintained are presented in Table 1.| Test | Purifying agents in the mixture | Amount of uploaded water (L) | Amount (g) | Gas flow rate (L min−1) | Time per exp. (min) | Pressure (bar) |
|---|---|---|---|---|---|---|
| T1 | CaO | 1 | 1–10 | 1.5 | 120 | 8 |
| Activated carbon | — | |||||
| Silica gel | — | |||||
| T2 | CaO | 1 | 1–10 | 1.5 | 120 | 8 |
| Fe0 | — | |||||
| Na2SO4 | — |
4. Experimental procedures
The experiments were carried out in a laboratory scale set-up (Fig. 1) consisting of four sections: the digester, raw gas storage, gas purifying unit and gas composition analysing section. Charging and purification of biogas were continued in batches. After charging the raw materials, the digester was kept at rest for 10 days to achieve the state of anaerobic digestion. Then the gas was collected regularly for a total duration of 20 days. Every day, before treating the gas with the purifying agent the methane content was evaluated by gas chromatography. After 20 days the experiment was completed. Raw biogas generated from the digester was stored in a storage flask. It was then passed through the purification unit, which consisted of three glass flasks of 2.0 L volume each. For the experiment T1, the three flasks contained Ca(OH)2 solution of varied concentrations (1.0–10.0 g L−1) and varied amounts (1.0–10.0 g) of activated carbon and silica gel. On the other hand, for the experiment T2, the three flasks contained Ca(OH)2 solutions of varied concentrations (1.0–10.0 g L−1), Fe0 and Na2SO4, respectively. From the storage flask, the raw biogas flows into the first purification flask containing Ca(OH)2 solution through a hosepipe (5.0 mm in diameter and 0.4 m in length). The sample of raw biogas for analysis was also collected by a similar sized hosepipe. The first, second and third flasks are interconnected by 1 m long U-shaped hose pipes having 5 mm diameter. For H2S removal, the first hosepipe was filled with activated carbon and Fe0 in experiments T1 and T2, respectively. For removing H2O, the U-shaped adsorption hose pipe column was filled with a powder of silica gel and Na2SO4 for experiments T1 and T2, respectively. Through the Ca(OH)2 solution, small bubbles of raw biogas were allowed to flow from the bottom of the flasks using a glass tube (5.0 mm diameter and 0.3 m long).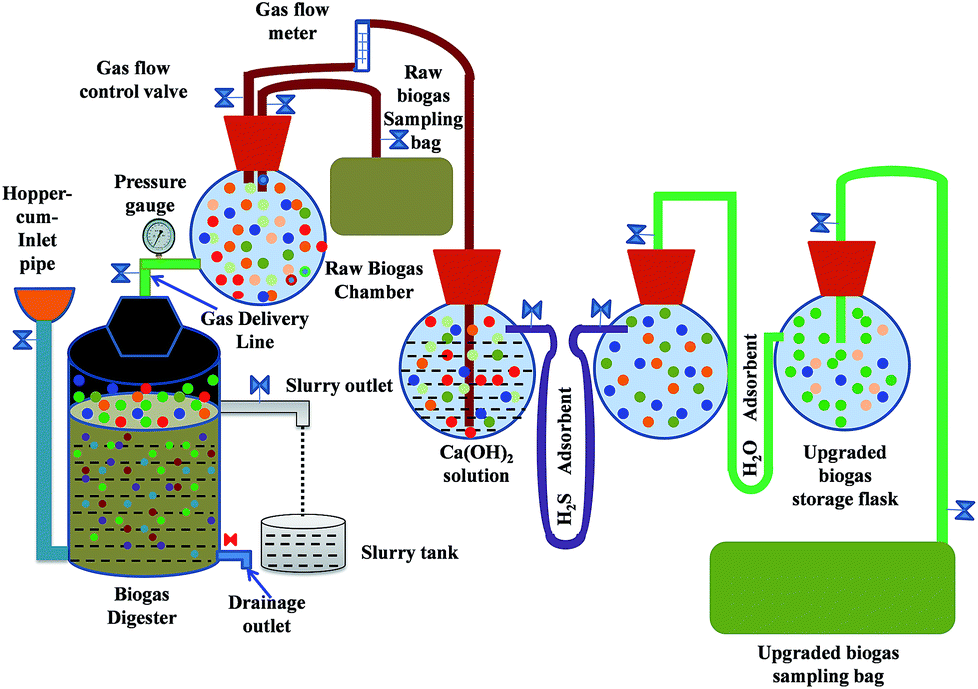 | ||
| Fig. 1 Schematic for the generation and purification of biogas. | ||
5. Sampling and analysis
The biogas after being treated with Ca(OH)2 solution enters into the H2S removal unit. The treated biogas then enters into the third chamber, which is the H2O removal unit. The treated biogas coming out of the purifying unit at the final stage was collected in a 50.0 L aluminium gas bag (GL Science Inc., Japan) and analysed by gas chromatography for its composition. For both the experiments (T1 and T2) biogas samples were collected before and after the treatment. The tests were conducted at a gas flow rate of 1.5 L min−1 within a fixed time duration of 120 minutes. The experimental setup and gas flow could be maintained without using any external energy sources. Gas chromatography (GC-8AIT/C-R8A Shimadzu Corporation, Japan) was employed to determine the relative amount of components in the raw and purified biogas. The chromatography set up contains a Porapak N 80/100, 274 cm, a 1/8 mesh 250 × 250 × 145 mm column, a molecular sieve (Mole sieve 5A 60/80, 182 cm, 1/8), a stainless-steel column and a thermal conductivity detector. The maximum temperature of the column oven was 399 °C with ± 0.1 °C temperature stability. A TCD type detector was employed which consisting Tungsten Rhenium filament. The detector ensured a maximum temperature and selectivity at 400 °C and 7000 mV mL mg−1, respectively. The gas was carried by an argon (Ar) carrier at a flow rate of 30 mL min−1. The temperatures of the column and the injector were maintained at 60 and 80 °C, respectively with 60 mA operating current. A gas flow meter was employed to regulate the flow rates. Pressure gauges were used to monitor the pressure of the gaseous mixtures. During data collection, for every unit experiment, we repeated the experiment three times. The results were almost similar and we chose the statistical average of the three datasets for every plot. During data collection, all measurements were repeated three times. The decrease in CO2, H2S and H2O content with corresponding CH4 enrichment was determined from gas chromatographic measurements. The rate of gas flow, pressure, pH and water content were measured using a gas flow meter, pressure gauge, digital pH meter (HM-25R) and moisture meter (MOC63u), respectively.Results and discussion
Fig. 2 presents the CO2-concentration profile of raw biogas and the gas purified by treating with Ca(OH)2 solution of varied concentrations (1–10 g L−1). The average CO2 concentration in raw biogas is 33%. This concentration decreases gradually with increasing concentration of Ca(OH)2 solution. In experiment T1, the CO2 content in the purified gas becomes 22.1, 12.8, 7.42 and 3.9% on treating the raw biogas with Ca(OH)2 solutions of 1, 3, 5 and 7 g L−1 concentrations, respectively. The extent of CO2 removal becomes sluggish on treating the raw biogas with Ca(OH)2 solution of high (>7 g L−1) concentration and the CO2 content reaches 2.65% on treating the raw biogas with 10 g L−1 Ca(OH)2 solution. Beyond 10 g L−1 Ca(OH)2 solution, the extent of CO2 removal remains almost constant. Almost a similar trend is observed for experiment T2. Here, the CO2 concentration reduces from 33% in raw biogas to 26.85, 20.7, 13.6 and 6.6% in the biogas purified after treating with 1, 3, 5 and 7 g L−1 Ca(OH)2 solution. Also here, treating the raw gas with Ca(OH)2 solution having a concentration higher than 7 g L−1 results in sluggish changes and on treating with 10 g L−1 Ca(OH)2 solution, the CO2 concentration in purified biogas becomes 4.8%. A similar saturation state of CO2 removal process to that of T1 is attained on treatment beyond 10 g L−1 Ca(OH)2 solution.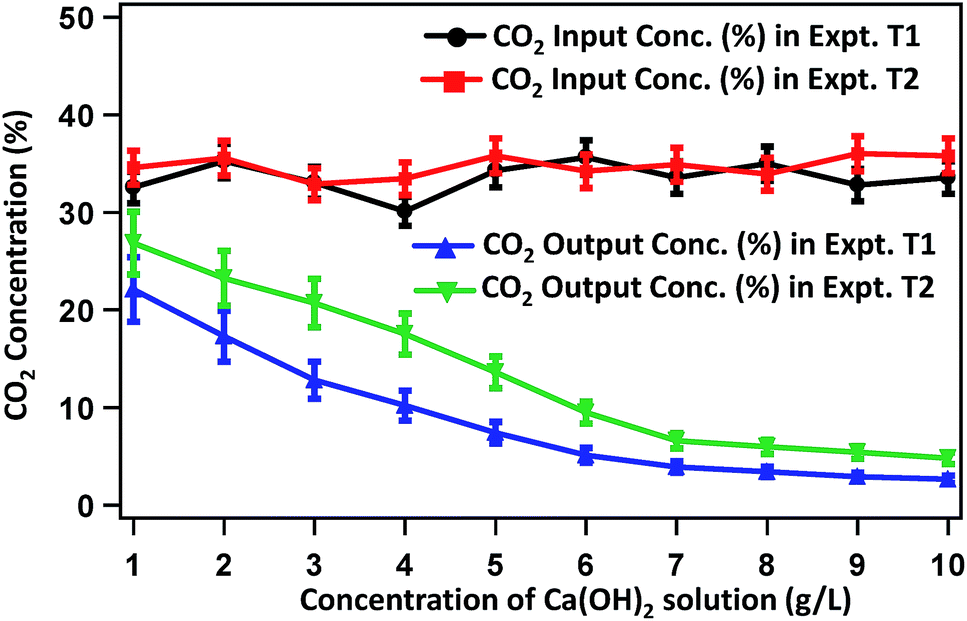 | ||
| Fig. 2 Changes in CO2 content in the biogas during purification by Ca(OH)2 solution of varied concentrations. | ||
Fig. 3 presents the concentration profile of H2S in raw biogas and the biogas treated with a varied amount of activated carbon or Fe0 in experiments T1 and T2, respectively. The average concentration of H2S in raw biogas is 400 ppm. In T1, after treatment, the H2S content decreases significantly with increase in the mass of activated carbon. The H2S content becomes 219.3, 135.4, 65.8, 31.8 and 14.7 ppm on treating the raw biogas with 2, 4, 6, 8 and 10 g activated carbon, respectively. This is well below the maximum concentration of H2S acceptable for running in internal combustion engines.36 It seems that the removal efficiency reaches saturation on using a higher amount of activated carbon. Almost a similar trend for the concentration change of H2S is observed for treating the raw biogas with Fe0 in experiment T2. Here the H2S content in treated biogas becomes 210.3, 135.6, 74.2, 45.9 and 29.4 ppm on treating the raw biogas with 2, 4, 6, 8 and 10 g Fe0, respectively. A state of saturation for the adsorption of H2S is noticeable here also on using a higher amount of adsorbent and we continued the experiment until 10 g of Fe0 was used.
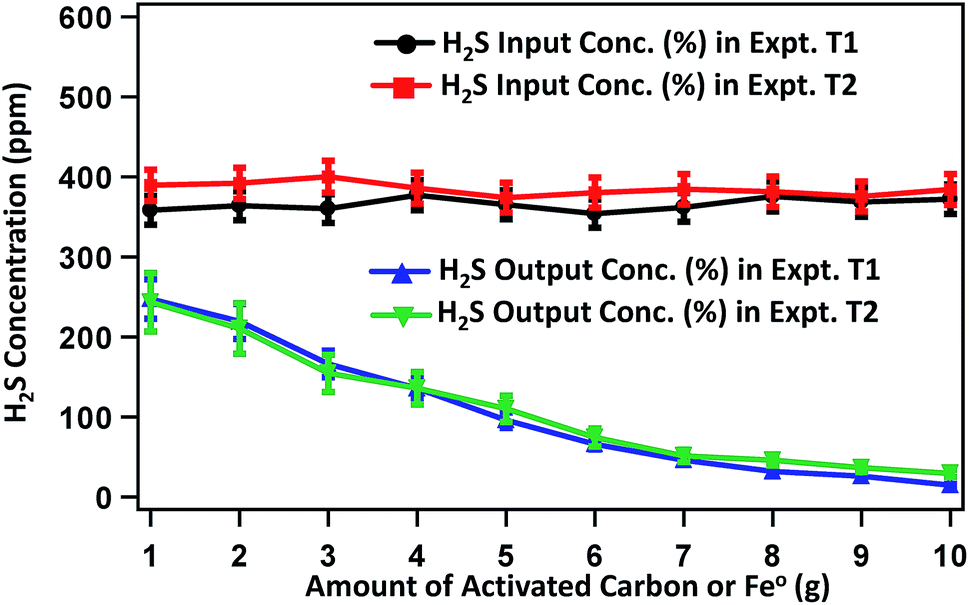 | ||
| Fig. 3 Changes in H2S content in the biogas purified by treating the raw biogas with varied amounts of activated carbon (for experiment T1) and Fe0 (for experiment T2). | ||
Fig. 4 presents the change in H2O-content in raw biogas and biogas purified after treating with varied amounts of silica gel and Na2SO4 in experiments T1 and T2, respectively. The average concentration of H2O in raw biogas is around 5%. On treating with 1.0 g of silica gel, the H2O content becomes 2.65% and is decreased gradually on treating with a higher amount of silica gel. The H2O content reaches 1.92, 1.88, 1.06, 0.16 and 0.03% on treating the raw biogas with 2, 4, 6, 8 and 10 g silica gel. H2O is also eliminated gradually on treating the raw biogas with Na2SO4. On using 1, 2, 4, 6, 8 and 10 g Na2SO4, the H2O concentration is changed to 3.6, 3.54, 2.1, 1.45, 0.99 and 0.87% respectively. In both cases (T1 and T2) the extent of removal seems to be optimized when around 10 g of the adsorbent phase is used.
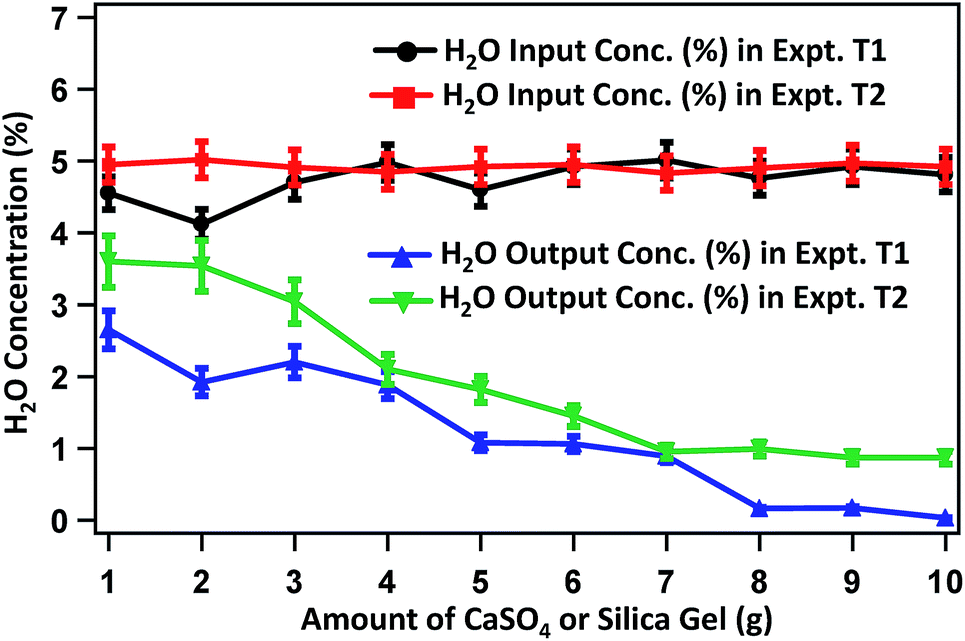 | ||
| Fig. 4 H2O content in raw and purified biogas with respect to the mass of silica gel or Na2SO4 used during the purification. | ||
The CO2, H2S and H2O removal efficiencies are 32.12, 30.96 and 33.33% when 1 g each of Ca(OH)2, activated carbon and silica gel, respectively, is used. The removal efficiencies increase gradually with increase in the mass of removing agents and reached the highest value of 92.09, 96.05 and 97.97%, respectively when 10 g of the respective removal agents was used. Similarly, in experiment T2 the CO2, H2S and H2O removal efficiencies increase from 22.35, 29.55 and 29.67% when 1 g of Ca(OH)2, Fe0 and Na2SO4 was used to 86.58, 89.15 and 84.19% when 10 g of the respective removing agents was used.
Fig. 5 represents the removal efficiencies of CO2, H2S and H2O with respect to the amount (concentration/masses) of removing agents for experiments T1 and T2. The results showed that the most efficient performance in T1 was investigated to compare with T2. The operation of the system in T1 was observed better results than T2 with respect to CO2 removal efficiency although same material used. A possible reason for this was that in T1 was contained activated carbon, which extremely porous and thus to have a very large surface area for adsorption of H2S simultaneously CO2.
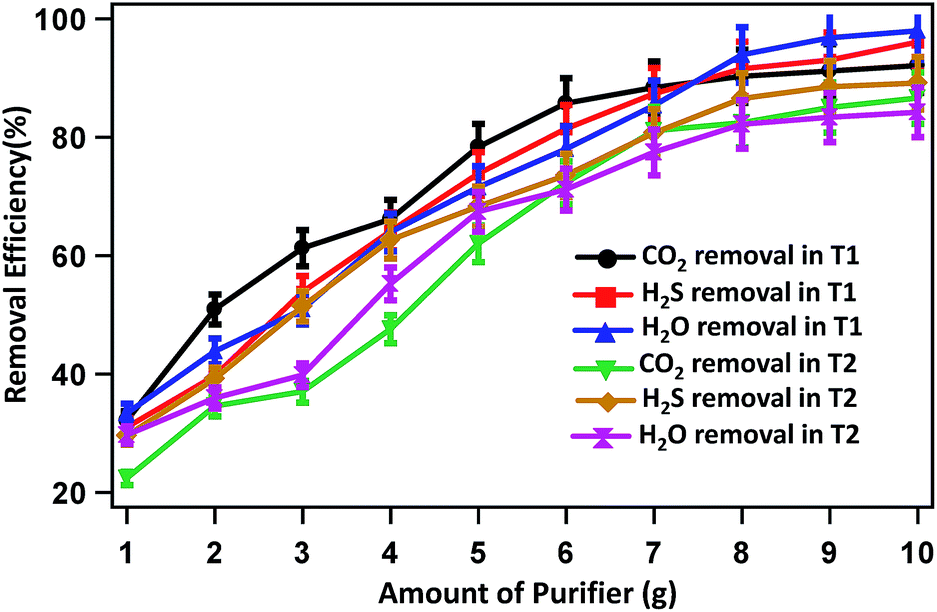 | ||
| Fig. 5 CO2, H2S and H2O removal efficiencies with respect to the amount of purifying agents used in experiments T1 and T2. | ||
The CH4 enrichment profile is presented in Fig. 6. Here the y-axis represents the CH4 percentage in the purified biogas, while the values along the x-axis represent the amount of each of the adsorbents used in experiments T1 and T2. The CH4 content in raw biogas is around 62%. In experiment T1, the CH4 content increased to 76.2% on treating the raw biogas with 1 g each of CaO, activated carbon and silica gel. The percentage of CH4 increases gradually with increase in the mass of the purifying agents. When 2, 4, 6, 8 and 10 g each of CaO, activated carbon and silica gel are used, the CH4 content becomes 78.65, 82.54, 86.57, 92.5 and 97.55%, respectively. Similarly, in experiment T2 after treating with 1, 2, 4, 6, 8 and 10 g each of CaO, activated carbon and silica gel, the CH4 content reaches 71.2, 74.6, 79.86, 84.56, 90.24 and 95.02%, respectively. The mirror X-axis in Fig. 6 represents the concentration of CH4 with respect to the production date. It shows that the CH4 concentration is almost the same over a duration of 20 days of gas collection.
 | ||
| Fig. 6 CH4 content in raw biogas and in purified biogas after treating with various amounts of purifying agents. The mirror face of X-axis represents the date of gas production. | ||
Being an acidic gas, CO2 reacts with CaO to produce a colloidal suspension of CaCO3, which ultimately precipitated out from the system after undergoing coagulation in the basic medium. This acid–base neutralization method can be presented by two consecutive chemical reactions as:
| CO2(g) + H2O(l) → H2CO3(aq.) | (1) |
| Ca(OH)2(aq.) + H2CO3(aq.) → CaCO3(s) + H2O(l) | (2) |
The overall chemical process is highly exothermic and a well-known spontaneous reaction. Hence the removal process takes place under ambient conditions. The removal of CO2 by CaO, therefore, is clearly a chemical elimination process, the efficiency of which is influenced partly by agitation, turbulence, the extent of interaction between the gaseous and liquid phase reactants and the concentration of Ca(OH)2 solution.33 The activated carbon and Fe0 in their commercial form possess nanometer range dimensions with high surface areas. Therefore, the exposure of these materials to H2S gas might result in the maximum adsorption or chemical elimination process for the optimized surface of contact.34–36 The removal mechanism of H2S by activated carbon is the adsorption of H2S within the carbon phase by means of the micropore filling theory, which in fact is a phenomenon of enhanced physisorption by adsorbent atoms closely surrounding the adsorbate due to the small pore size. Sometimes the presence of oxygenous functional groups on the carbon phase accelerates the physical adsorption method. There also exists the possibility of chemisorption if the carbon phase pore size is extraordinarily low. Such a phenomenon can be confirmed only if the heat of adsorption is very high. However, in the present case, such a thorough study is beyond our scope of this paper. The removal mechanism of H2S by Fe0 is associated with chemical transformation of the gas into solid sulphide by a two-step method as follows:
| Fe0 + 2H2O → Fe2+ + H2(g) + OH− | (3) |
| Fe2+ + H2S → FeS + 2H+ | (4) |
At first, Fe0 reacts with moisture to form Fe2+ ion. The generated Fe2+ ion possesses high chemical affinity toward sulphide. The H2S thus transformed into FeS after a rapid chemical reaction. The reaction is accompanied by an increase in H+ ion or a decrease in system pH. The process thus seems to be pH sensitive. Our next study includes a detailed investigation of this issue. Both in the experiments T1 and T2, the H2S content in biogas after treating with 10 g purifying agent (activated carbon or Fe0) lies below the maximum concentration of H2S acceptable for running internal combustion engines.12 However, the results showed that the H2S removal capability of activated carbon is higher than that of Fe0. This variation needs further scientific reasoning. Fe0 removes gaseous H2S by forming metallic sulphide through the reaction H2S(g) + Fe0(s) → FeS(s). The reaction stoichiometry suggests the formation of sulphide at the surface of iron nanoparticles in a 1:1 ratio. The extent of removal is therefore limited by the surface area of Fe0. Here, rather than a perfect solid phase–gas phase interaction, the chemical reaction is supported by the water molecules present in the biogas mixture. In contrast, the H2S adsorption process on the surface of activated carbon is supported by van der Waals type of interactions.11 It is not clear whether the adsorption process is in the single layer form or in the BET type multilayer form. However, it is expected that for a multilayer deposition, the removal efficiency will exceed the extent displayed by Fe0.
The removal mechanism of H2O by sodium sulphate and silica gel is simply adsorption. The blue silica gel turns pink gradually by adsorbing water molecules. The silica gel can be reactivated after saturation by removing the water molecules from its pink form by heating for 3 hours at 150 °C. The removal of water vapour from biogas is significant as it reduces the risk of formation of sulphuric and carbonic acids (H2SO4 and H2CO3) from the possible reactions between the water molecules and H2S and CO2, respectively.37,38 The acids are responsible for corrosion in piping and engines.
Even the composition of biogas varies due to the nature of raw materials and operational conditions; this report represents a composite phenomenon to purify the raw biogas of any source. We propose that the biogas purification method is highly fascinating, as it could eliminate the unwanted components by desirable amounts from the raw biogas. In fact, we primarily used 12 g of all the purifying agents. But, on using beyond 10 g of the purifier no substantial changes in the concentration of gas component were observed. For this reason, we conducted the experiment three times for each of the unit tests and the results from the average of the 3 tests using 10 g of the purifier are presented. Even it seems that using 10 g Ca(OH)2 solution, the methane content slightly increased, while carrying out the experiment with the higher amount of Ca(OH)2 didn't show any significant variation in the result. The purifying materials used are cheap, inexpensive and non-hazardous in nature. Besides, the technology employed is simple and affordable. The CO2 is removed by a simple chemical transformation. Fe0 and activated carbon could remove H2S simply by adsorption. The water vapour is removed by physical adsorption only. The experimental results revealed that the biomethane content could be enriched to >95% using the proposed combined chemical and physical removal process. Between experiments T1 and T2, the maximum methane concentration after treatment was achieved in T1.
Conclusions
Through the anaerobic digestion of cafeteria, vegetable and food wastes, and cattle manure, a biogas mixture having an average CH4 content around 62% was generated. The unwanted CO2, H2S and H2O was removed by using physical adsorption and chemical transformation using two different sets of purifying agents including, Ca(OH)2 + activated carbon + silica gel and Ca(OH)2 + zero-valent iron (Fe0) + Na2SO4 in experiments T1 and T2, respectively. In experiment T1 the minimum concentration of CO2, H2S and H2O in purified biogas was 2.65%, 14.7 ppm and 0.03%, respectively with a maximum CH4 content of 97.55%. The results of experiment T2 displayed some variation. In this case, the minimum concentration of CO2, H2S and H2O in the purified biogas was 4.8%, 29.4 ppm and 0.87%, respectively with a maximum CH4 content of 95.02%. A CH4 enrichment efficiency of 42% implies the potential of these purification techniques for the utilization of biogas in small-scale farmlands or rural areas.Conflicts of interest
There are no conflicts to declare.Notes and references
- P. M. Christ, L. R. Gopinath and D. Divya, Renewable Sustainable Energy Rev., 2014, 34, 167–173 CrossRef.
- B. Budiyono, I. N. Widiasa, S. Johari and S. Sunarso, Int. J. Chem. Biol. Eng., 2010, 3, 39–44 Search PubMed.
- E. Favre, R. Bounaceur and D. J. Roizard, J. Membr. Sci., 2009, 238, 11–14 CrossRef.
- U. Marchaim, Biogas technology as an environmental solution to pollution, Bull. FAO Agric. Services, Rome, Italy, 1992 Search PubMed.
- R. E. Speece, Anaerobic biotechnology for industrial wastewaters, Archae Press, Nashville, Tennessee, U.S.A., 1996 Search PubMed.
- G. Lettinga, A. F. M. van Velsen, S. W. Hobma, W. de Zeeuw and A. Klapwijk, Biotechnol. Bioeng., 1980, 22, 699–734 CrossRef CAS.
- A. Van Haandel, M. T. Kato, P. F. F. Cavalcanti and L. Florencio, Rev. Environ. Sci. Bio/Technol., 2006, 5, 21–38 CrossRef CAS.
- K. Braber, Biomass Bioenergy, 1995, 9, 365–376 CrossRef CAS.
- V. N. Gunaseelan, Biomass Bioenergy, 1997, 13, 83–114 CrossRef CAS.
- M. R. Al Mamun and S. Torii, J. Clean Energy Technol., 2015, 3, 428–432 CrossRef CAS.
- M. S. Horikawa, M. L. Rossi, M. L. Gimenes, C. M. M. Costa and M. G. C. da Silva, Braz. J. Chem. Eng., 2004, 21, 415–422 CrossRef CAS.
- A. Wellinger and A. Lindberg, IEA Bioenergy Task 24: Energy from Biological Conversion of Organic Waste, 2005 Search PubMed.
- E. Wheless and J. Pierce, Siloxanes in landfill and digester gas update, Los Angeles Country Sanitation Districts and SCS Energy, Whittier (Canada) and Long Beach (California), 2004 Search PubMed.
- M. Hagen, E. Polman, J. Jensen, A. Myken, O. Jönsson and A. Dahl, Adding gas from biomass to the gas grid, Swedish Gas Center, Malmö, Sweden, 2001, p. 144 Search PubMed.
- M. Persson and A. Wellinger, IEA Bioenergy Report, 2006.
- K. Krich, A. Augenstein, J. Batmale, J. Benemann, B. Rutledge and D. Salour, in Biomethane from Dairy Waste -A Sourcebook for the Production and Use of Renewable Natural Gas in California, ed. K. Andrews, Clear Concepts, California, 2005, pp. 47–69 Search PubMed.
- M. Harasimowicz, P. Orluk, G. Zakrzewska-Trznadel and A. Chmielewski, J. Hazard. Mater., 2007, 144, 698–702 CrossRef CAS PubMed.
- N. Abatzoglou and S. Boivin, Biofuels, Bioprod. Biorefin., 2009, 3, 42–71 CrossRef CAS.
- E. Porpatham, A. Ramesh and B. Nagalingam, Int. J. Hydrogen Energy, 2007, 32, 2057–2065 CrossRef CAS.
- J. B. Holm-Nielsen, T. Al Seadi and P. Oleskowicz-Popiel, Bioresour. Technol., 2009, 100, 5478–5484 CrossRef CAS PubMed.
- D. P. Gosh, The 2007 Tri-service Corrosion Conference, Denver, Colorado, USA, 2007 Search PubMed.
- E. Ryckebosch, M. H. Drouillon and H. Vervaeren, Biomass Bioenergy, 2011, 35, 1633–1645 CrossRef CAS.
- D. Schieder, P. Quicker, R. Schneider, H. Winter, S. Prechtl and M. Faulstich, Water Sci. Technol., 2003, 48, 209–212 CrossRef CAS PubMed.
- D. Ramirez-Saenz, P. B. Zarate-Segura, C. Guerrero-Barajas and E. I. Garcia-Pena, J. Hazard. Mater., 2009, 163, 1272–1281 CrossRef CAS PubMed.
- V. G. Gomes and K. W. K. Yee, Sep. Purif. Technol., 2002, 28, 161–171 CrossRef CAS.
- A. D. Ebner and J. A. Ritter, Sep. Sci. Technol., 2009, 44, 1273–1421 CrossRef CAS.
- Y. Cheng-Hsiu, H. Chih-Hung and T. Chung-Sung, Aerosol Air Qual. Res., 2012, 12, 745–769 CrossRef.
- S. Nishimura and M. Yoda, Water Sci. Technol., 1997, 36, 349–356 CrossRef CAS.
- K. S. Cho, H. W. Ryu and N. Y. Lee, J. Biosci. Bioeng., 2000, 90, 25–31 CrossRef CAS PubMed.
- Y. C. Chung, K. L. Ho and C. P. Tseng, J. Environ. Sci. Health, Part B, 2003, 38, 663–679 CrossRef PubMed.
- Y. C. Chung, K. L. Ho and C. P. Tseng, Environ. Eng. Sci., 2006, 26, 942–953 CrossRef.
- M. R. Al Mamun, M. R. Karim, M. M. Rahman, A. M. Asiri and S. Torii, J. Taiwan Inst. Chem. Eng., 2016, 58, 476–481 CrossRef CAS.
- R. Bajracharya, A. Dhungana, N. Thapaliya and G. Hamal, J. Taiwan Inst. Chem. Eng., 2009, 7, 1–9 Search PubMed.
- A. Wellinger and A. Linberg, IEA Bioenergy Task 24, International Energy Association, Paris, France, 2000 Search PubMed.
- X. Q. Li, D. G. Brown and W. X. Zhang, J. Nanopart. Res., 2007, 9, 233–243 CrossRef CAS.
- W. L. Yan, A. A. Herzing, C. J. Kiely and W. Zhang, J. Contam. Hydrol., 2010, 118, 96–104 CrossRef CAS PubMed.
- R. H. Zhang, H. M. El-Mashad, K. Hartman, F. Wang, G. Liu, C. Choate and P. Gamble, Bioresour. Technol., 2007, 98, 929–935 CrossRef CAS PubMed.
- W. F. Owen, D. C. Stuckev, J. B. Healv Jr, L. Y. Young and P. L. Mccagrv, Int. J. Water Res., 1979, 13, 485–492 CrossRef CAS.
| This journal is © The Royal Society of Chemistry 2019 |