
 Open Access Article
 This Open Access Article is licensed under a Creative Commons Attribution-Non Commercial 3.0 Unported Licence
Acoustic cavitation generates molecular mercury(II) hydroxide, Hg(OH)2, from biphasic water/mercury mixtures†
Minjun
Yang
 ,
Bertold
Rasche
and
Richard G.
Compton
*
,
Bertold
Rasche
and
Richard G.
Compton
*
Department of Chemistry, Physical and Theoretical Chemistry Laboratory, University of Oxford, South Parks Road, Oxford OX1 3QZ, UK. E-mail: Richard.Compton@chem.ox.ac.uk
First published on 22nd November 2019
Abstract
Emulsification of elemental mercury in aqueous solution in the form of grey particles occurs upon exposure to intense sound fields. We show the concomitant formation of molecular Hg(OH)2 in the solution phase reaching a saturation limit of 0.24 mM at 25 °C. The formation of Hg(OH)2 is consistent with the ‘hot spot’ model which suggests the formation of OH˙ as a result of acoustic cavitation; such radicals are proposed to combine with Hg to form the Hg(OH)2 species here characterised using voltammetry.
Introduction
‘Acoustic cavitation’, the formation and collapse of bubbles suspended in a liquid can occur on exposure to intense sound fields with frequencies ranging from audible sound to ultrasound.1–3 When the bubbles collapse during the cavitation cycle photons are emitted with energies approximately eleven orders of magnitude higher as compared to the energy density of the sound field;4 this phenomenon, known as sonoluminescence, sparked interest throughout scientific community with over 1000 papers published between 1990 to 2005.5 The bubbles collapse near adiabatically, generating a ‘hot spot’ in which the temperature can reach 1000–10![[thin space (1/6-em)]](https://www.rsc.org/images/entities/char_2009.gif) 000 K with a pressure >107 N m−2.5–8 Under these extreme conditions water molecules pyrolytically cleave to H˙ and OH˙.9–11
000 K with a pressure >107 N m−2.5–8 Under these extreme conditions water molecules pyrolytically cleave to H˙ and OH˙.9–11
Separate studies report OH˙ radicals, generated via photolysis of nitrate or methyl nitrite, can react with atomic mercury in both gaseous12 and aqueous13 phases as inferred indirectly from kinetic data with the possible formation of HgOH˙ and/or Hg(OH)2 suggested. Direct spectroscopic or other evidence for Hg(OH)2 is sparse; an infra-red spectrum of Hg(OH)2 deposited on solid neon and argon at 5 K has been reported14 and is thought might play a role in the transport of inorganic mercury through lipid bilayer membranes.15,16
Metallic mercury at room temperature is immiscible with water. However, within tens of seconds of exposure to ultra-sound sonication, a grey ‘cloud’ of particles is seen emanating from the mercury–water interface into the aqueous phase.17–20 The particles in the resulting mercury emulsion sediment within hours but do not re-merge with the bulk metallic mercury. Herein, we investigate the redox behaviour of the insonated mercury–water system, so as to generate OH˙ via acoustic cavitation, and the possibility of Hg(OH)2 formation. In particular electrochemical methods evidence Hg(OH)2 in the solution phase which gives a voltammetric signature distinct from Hg2+ or Hg22+.
Experimental
Chemicals
All chemicals used were of analytical grade and were purchased from Sigma-Aldrich (U.K) with the exception of metallic mercury purchased from Elgar Phosphors & Chemicals Ltd (U.K). All chemicals were used without further purification. Aqueous solutions were made using ultrapure water (Millipore, resistivity of 18.2 MΩ cm at 25 °C). The saturated solution of Hg(OH)2(aq) at 0.24 mM was made by stirring solution containing the equivalent amounts of HgO(s) in 0.1 M KNO3 at an elevated temperature of 70 °C for 2 hours.21Electrochemical cell
The electrochemical cell consists of three electrodes; a carbon microdisc working electrode (diameter = 7 μm, IJ Cambria Scientific Ltd, UK), a saturated mercury sulphate reference electrode MSE (ALS, Japan) and a carbon rod counter electrode. The electrochemical experiments were conducted with a computer controlled potentiostat (Bio-Logic SP200, France). The working electrode was cleaned after each experiment using alumina slurries of decreasing particle sizes: 1.0, 0.3 and 0.05 μm (Buehler, LakeBluff, IL, USA). All electrochemical experiments were thermostated at 25 °C.Mercury emulsion and supernatant separation
The ultra-sound sonication of 1 mL of metallic mercury in 100 mL of aqueous 0.1 M KNO3 was conducted in a SW1H Clifton ultrasonic water bath (37 kHz, Nickel-Electro Ltd, UK). During sonication, a ‘cloud’ of grey particles is seen emanating from the mercury–water interface into the aqueous phase. The grey emulsion (termed a “mercury emulsion” in this article) was collected at sonication times of 5, 10, 15, 25, 40 and 60 minutes for electrochemical analysis. The grey particles were separated from the mercury emulsion via centrifugation (Eppendorf® Centrifuge 5702, Hamburg, Germany) at 4000 rpm for 5 minutes; the clear supernatant was then separated from the sedimented grey particles for further electrochemical analysis. An experimental scheme is provided in the ESI.†Results and discussion
A 0.1 M KNO3 aqueous solution containing metallic Mercury was sonicated for times of 5, 10, 15, 25, 40 and 60 minutes and the resulting mercury emulsion was collected. Fig. 1 shows the resulting cyclic voltammogram (CV) recorded with a carbon micro-disc electrode. The voltammograms were swept reductively from an initial potential of +0.5 V vs. MSE with reversal from −0.6 V. No faradaic current was observed for 5 minutes of sonication time although emulsification occurred within tens of seconds. After a sonication time of 10 minutes or longer, a quasi-steady state cathodic current with a half-wave potential around −0.26 V vs. MSE can be seen, and approaches −0.9 nA after prolonged sonication times. The steady state cathodic current signals reduction of a solution phase species. During the reverse sweep, a near-symmetric “stripping” peak is observed at +0.05 V vs. MSE and the peak height evolves over 60 minutes of sonication time. Furthermore, at higher oxidative over-potentials ‘spike-like’ voltammetric behaviour sporadically occurs. Those oxidative signals, the stripping peak and the ‘spikes-like’ events, are only seen during the reverse sweep suggesting oxidation of reduction product(s).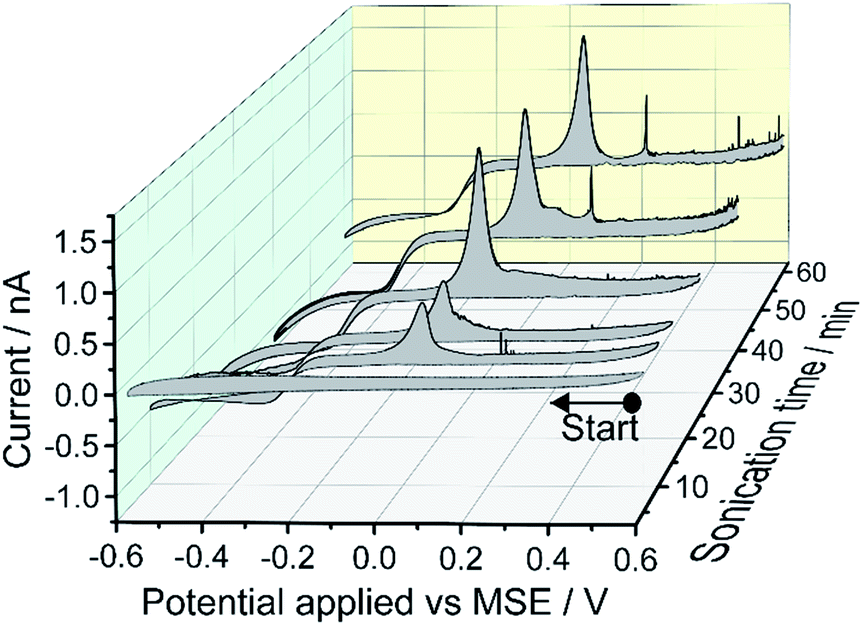 | ||
| Fig. 1 Cyclic voltammograms of the grey mercury emulsions generated by ultra-sound sonication of an aqueous solution containing 0.1 M KNO3 and metallic mercury for 5, 10, 15, 25, 40 and 60 minutes. The voltammograms were recorded on a carbon micro-disk electrode (diameter = 7 μm) at a scan rate of 20 mV s−1. | ||
Next, a series of double-step chronoamperometry experiments were conducted; first, the potential was stepped to a negative potential of either −0.8, −0.4, −0.2, or 0.0 V vs. MSE for 30 s followed by a second potential step to a oxidative potential of +0.5 V for another 30 s. Fig. 2 plots the current–time transient recorded during the second potential step. As can be seen, both the magnitude and frequency of the oxidative ‘spikes’ increases with the magnitude of the applied negative over-potential (see ESI† for spike analysis). Note the electrode was polished in between experiments to produce a fresh surface.
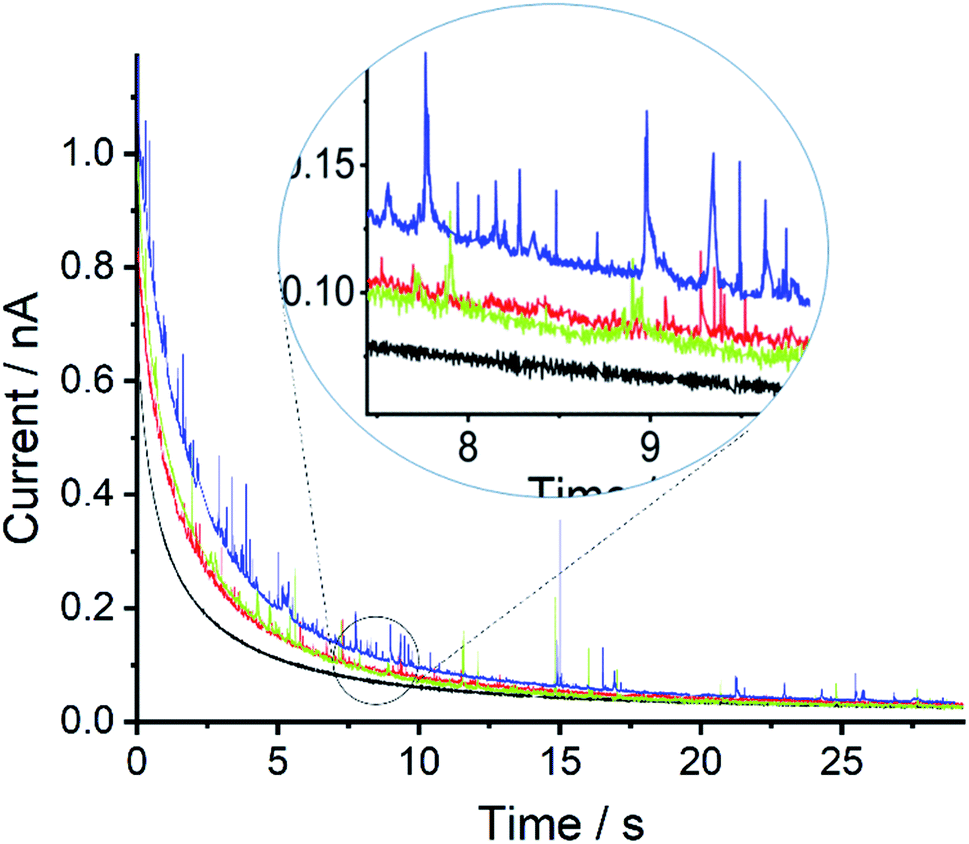 | ||
| Fig. 2 Chronoamperogram of the mercury emulsion with sonication time of 60 minutes. The potential step was first stepped to −0.8 V (blue), −0.4 V (green), −0.2 V (red) or 0.0 V (black) for 30 s then immediately to +0.5 V for 30 s. Note the graph shows the current–time transient during the second potential step. | ||
In a next step, the emulsion particles were successfully separated from the mercury emulsion via centrifugation and both the supernatant and the particles were collected for analysis. The particles were characterised by X-ray diffraction showing broad peaks consistent with liquid mercury22–24 and amorphous HgO(am), see ESI Section 2.† The amorphous HgO(am) is likely present as shells surrounding Hg droplets resulting in the matt grey, non-metallic particle appearance. To the best of our knowledge this is the first XRD study of an Hg emulsion and the first to show that it consists of Hg and amorphous HgO(am).
Fig. 3 shows the cyclic voltammograms of the supernatant solutions separated from the mercury emulsions prepared with different exposure times to sonication. Similar to the case of the mercury emulsion, presented in Fig. 1, a quasi-steady state cathodic current is seen and with a magnitude approaches to −0.8 nA; a subsequent oxidation peak can again be seen at +0.05 V. Thus, this evidences a soluble mercury(I) or mercury(II) complex present in the solution phase after tens of minutes of sonication and this is independent of the presence of the grey particles which result from emulsification. The near symmetric oxidation peak at +0.05 V is attributed to the oxidation of Hg0 at the electrode surface. Small oxidative spikes are seen and occur less frequently compared to the CV obtained in the mercury emulsion (Fig. 1).
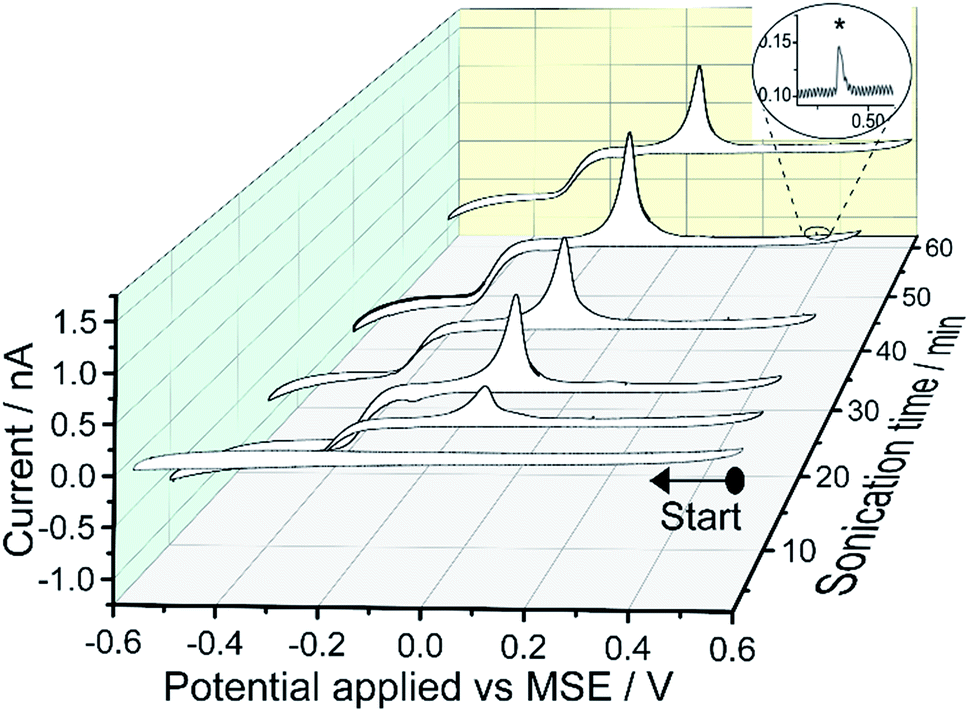 | ||
| Fig. 3 Cyclic voltammograms of the supernatant separated from the mercury emulsion after sonication. The supernatant solution was obtained by centrifuging mercury emulsions at 4000 rpm for 5 minutes. The voltammetric experimental conditions are the same as Fig. 1. Inlay shows an examples of a small spikes (*). | ||
Fig. 4 shows the voltammograms of a ‘transfer’ experiment where a reductive sweep (black line) was first conducted in the supernatant. The electrode was then rinsed with deionised water and subsequent transferred to a 0.1 M KNO3 only electrolyte solution for “oxidative stripping” (red line). Both the stripping peak (Epeak at +0.05 V vs. MSE) and the ‘spike’ events are seen, suggesting both of the oxidation processes resulted from surface bound reduction products.
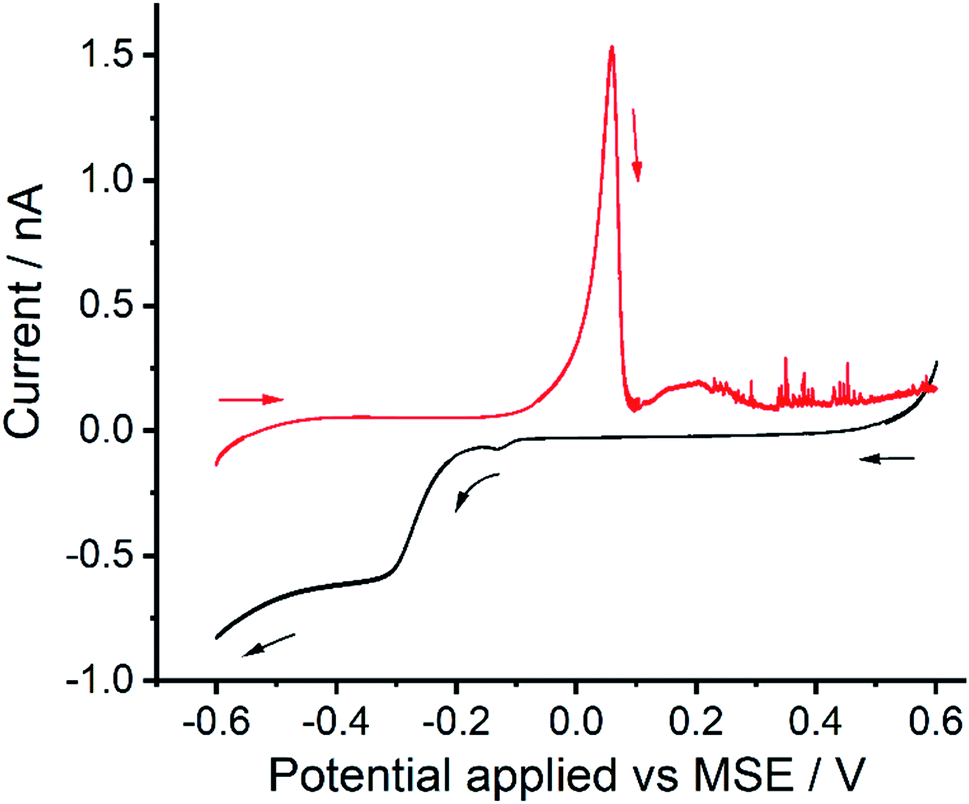 | ||
| Fig. 4 Transfer experiment conducted with the supernatant separated from a mercury emulsion after 60 minutes of sonication. Black line shows the reductive linear sweep voltammetry (LSV) recorded in the supernatant. Subsequently, the electrode was rinse with deionised water and transferred to solution of 0.1 M KNO3 for oxidative sweep, shown as red line. Scan rate was 20 mV s−1. | ||
The physical origin of the spikes can be deduced from the above observations. First, the presence of mercury particles (Hg@HgO core–shell) in solution do not lead to direct oxidative spikes unless a negative over-potential is first applied (Fig. 2). Second, spikes are seen during the re-oxidation sweep in 0.1 M KNO3 electrolyte (transfer experiment, Fig. 4). Thus, the ‘spike-like’ events are likely due to incomplete oxidation of surface-bound bulk mercury, resulting from the loss of small mercury droplets either into the solution phase, and/or as remnants on the electrode surface. These lead to sporadically occurring oxidation spikes as the droplets re-encounter the electrode or newly make electrical contact. As such these spikes are different in some respects to those seen in ‘Faradaic impact electrochemistry’ notably where nanomaterials are electrolysed.25,26 Furthermore, the size and frequency of the occurring spikes in CVs recorded in the Hg@HgO core–shell particles containing emulsion solutions (Fig. 1) are higher than that seen in the supernatant solutions (Fig. 3), obtained under the same voltammetric conditions. A likely explanation is that the thin amphorous HgO shell layers surrounding the Hg@HgO core–shell particles are reduced during the cyclic voltammetry, contributing their reservoir of core mercury to form more surface-bound mercury at the electrode surface.
It is evident that, a mercury(I) or mercury(II) complex soluble in the solution phase, after exposure to ultrasound, is electrochemically visible. The identity of this species is next considered. Plausible sono-chemical reactions include first hydroxyl radicals OH˙ – formed via cavitation – reacting directly with Hg0 to form soluble Hg(OH)2(aq) viaeqn (1)–(3)
| Hg0 + OH˙ → HgOH˙ | (1) |
| HgOH˙ + OH˙ → Hg(OH)2 | (2) |
| HgOH˙ + O2 + H2O → Hg(OH)2 + H+ + O−2 | (3) |
 | (4) |
| HgO(s) + H2O(l) ⇌ Hg(OH)2(aq) | (5) |
The limit of dissolution of solid HgO in water at 298 K is 0.052 g dm−3 which corresponds to a saturation limit of 0.24 mM Hg(OH)2.21 Hg(OH)2(aq) is known not to dissociate to Hg2+ and OH−.27
Fig. 5 shows four cyclic voltammograms obtained with the supernatant and three other mercury species; overlaid in the top-half are: supernatant obtain after 60 minutes of sonication, saturated concentration of 0.24 mM Hg(OH)2 obtained via dissolution of HgO; overlaid in the bottom-half are 0.24 mM of Hg2(NO3)2 and Hg(NO3)2. In all cases, the potential was swept reductively from +0.6 V to −0.6 V vs. MSE. For the supernatant solution, obtained after 60 minutes of insonation, a quasi-steady state cathodic current is seen approaching to −0.8 nA as mentioned above. Similarly, the steady state cathodic current for the saturated solution of Hg(OH)2, obtained by dissolution of HgO, approaches to −0.9 nA with a half-wave reduction potential seen around −0.28 V vs. MSE (indicated by the grey dotted line). In comparison, the voltammometric signal for Hg22+(aq) and Hg2+(aq) – at equal concentration of 0.24 mM – are distinctively different to that seen for Hg(OH)2; first, the cathodic steady state current approaches to −0.6 nA and second, a hysteresis/cross-over in current are seen in the voltammograms of Hg22+ and Hg2+. It is likely that deposition of mercury on a carbon surface changes both the electrode kinetic and surface morphology during the voltammetric sweep and thus leading to the reduction of Hg22+ and Hg2+ ions at higher oxidation potential on the reverse sweep. Similar behaviour was seen on a Pt electrode (see ESI†).
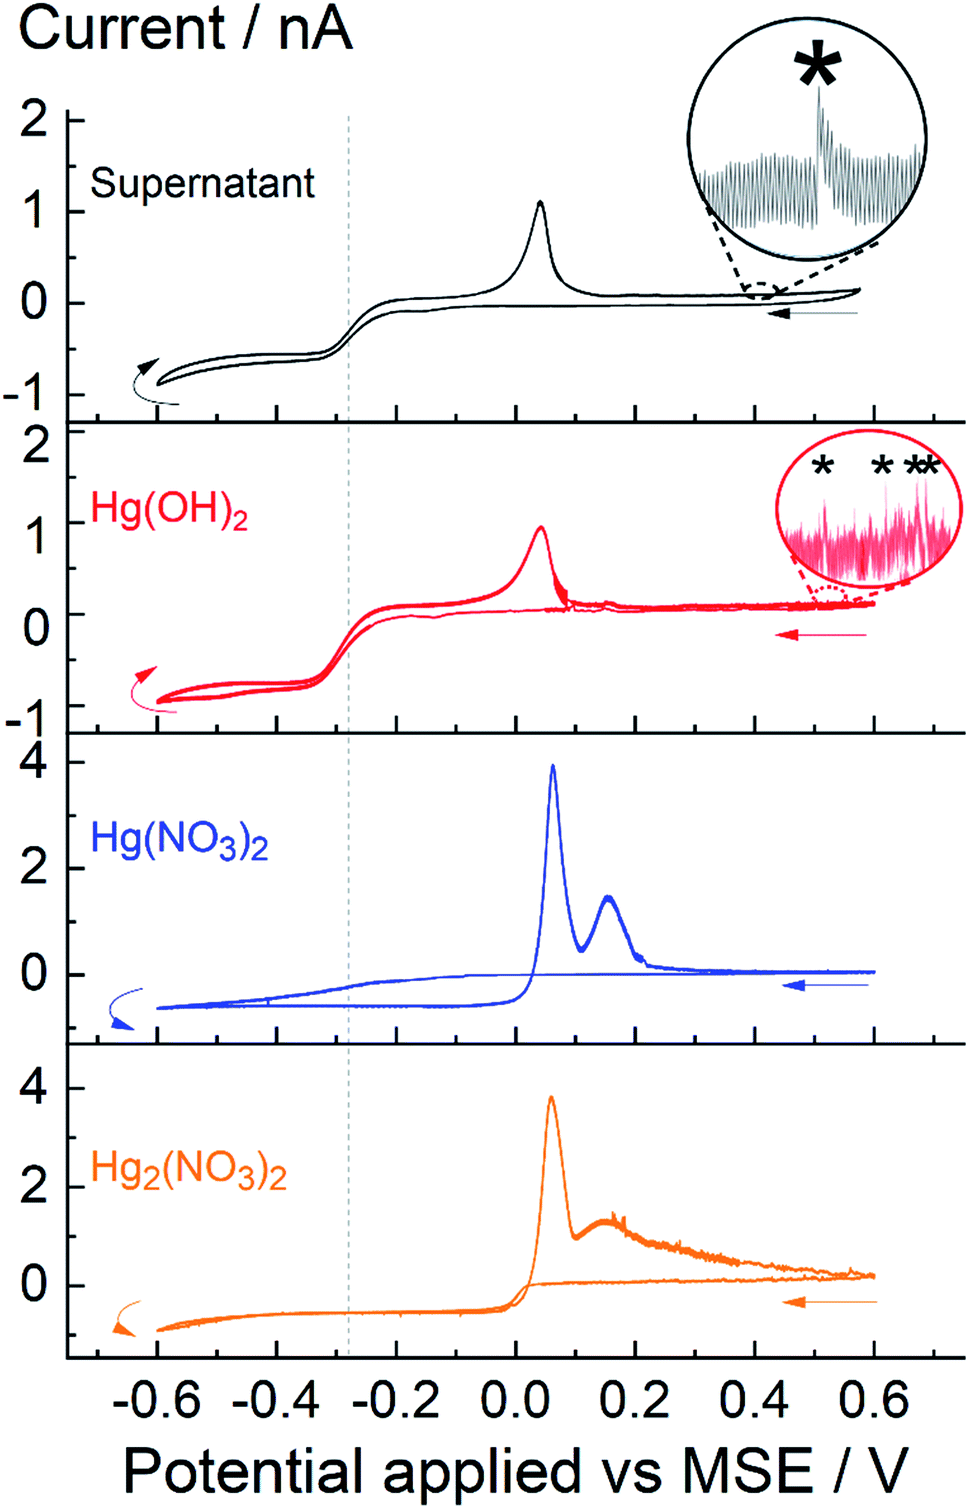 | ||
| Fig. 5 Cyclic voltammograms various mercury(I) or mercury(II) ion containing 0.1 M KNO3 solutions. Black line – supernatant obtained after 60 minutes of sonication; red line –saturated solution of Hg(OH)2(aq) obtained via dissolution of 0.24 mM HgO; blue line – 0.24 mM Hg(NO3)2; orange line – 0.24 mM Hg2(NO3)2. The grey dotted line indicates the half-wave potential at −0.28 V. Inlay shows examples of small spikes (*). | ||
It is evident that, insonation of a mercury–water system generates soluble Hg(OH)2 which is visible voltammetrically. The electrode kinetics of Hg(OH)2 is irreversible with a cathodic transfer coefficient around 0.5. Moreover, the magnitude of the steady state current Iss recorded on a micro-disk electrode is directly proportional to the concentration (C) and diffusion coefficient (D) of the analyte
| Iss = 4nFDCr | (6) |
Conclusions
Insonation of mercury/water system leads to grey emulsions in which the particles have been characterised as Hg@HgO core–shell structures. Further, a molecular mercury species in the solution phase – after insonation of mercury–water system – is voltammetrically visible and characterised as that of Hg(OH)2, a possible intermediate in the sonochemical formation of HgO. The voltammetric signatures of Hg(OH)2 are distinctively different to the freely solvated Hg22+ and Hg2+ ions, with noticeably different half-wave potentials and an absence of hysteresis in the current during the reverse sweep. The formation of molecular Hg(OH)2 is consistent with the ‘hot spot’ model in which generation of OH˙ via cavitation leading to concomitant reactions with elemental mercury to form Hg(OH)2. Moreover, the cathodic steady state current of −0.8 nA recorded with the supernatant, obtained after 60 minutes of insonation, suggest a concentration approaching the saturation limit of 0.24 mM at 298 K.Conflicts of interest
There are no conflicts to declare.Acknowledgements
The research leading to these results has received partial funding via an EPSRC Industrial CASE award (EP/N509711/1) and German Research Foundation (DFG) Research Fellowship (RA 3120/1-1).Notes and references
- L. A. Crum, T. J. Mason, J. L. Reisse and K. S. Suslick, Sonochemistry and sonoluminescence, Springer Science & Business Media, 2013 Search PubMed.
- K. S. Suslick, Ultrasound: its Chemical, Physical, and Biological effects, VCH Publishers, 1988 Search PubMed.
- G. J. Price, Current Trends in Sonochemistry, Royal Society of Chemistry, 1992 Search PubMed.
- B. P. Barber and S. J. Putterman, Nature, 1991, 352, 318 CrossRef.
- L. A. Crum, J. Acoust. Soc. Am., 2015, 138, 2181–2205 CrossRef.
- W. B. McNamara III, Y. T. Didenko and K. S. Suslick, Nature, 1999, 401, 772 CrossRef.
- E. B. Flint and K. S. Suslick, Science, 1991, 253, 1397–1399 CrossRef CAS.
- P. Jarman, J. Acoust. Soc. Am., 1960, 32, 1459–1462 CrossRef.
- G. J. Price, M. Ashokkumar, M. Hodnett, B. Zequiri and F. Grieser, J. Phys. Chem. B, 2005, 109, 17799–17801 CrossRef CAS.
- R. Pflieger, H. P. Brau and S. I. Nikitenko, Chem.–Eur. J., 2010, 16, 11801–11803 CrossRef CAS.
- K. S. Suslick, S. J. Doktycz and E. B. Flint, Ultrasonics, 1990, 28, 280–290 CrossRef CAS.
- J. Sommar, K. Gårdfeldt, D. Strömberg and X. Feng, Atmos. Environ., 2001, 35, 3049–3054 CrossRef CAS.
- K. Gårdfeldt, J. Sommar, D. Strömberg and X. Feng, Atmos. Environ., 2001, 35, 3039–3047 CrossRef.
- X. Wang and L. Andrews, Inorg. Chem., 2005, 44, 108–113 CrossRef CAS PubMed.
- J. Gutknecht, J. Membr. Biol., 1981, 61, 61–66 CrossRef CAS.
- T. Barkay, M. Gillman and R. R. Turner, Appl. Environ. Microbiol., 1997, 63, 4267–4271 CAS.
- R. W. Wood and A. L. Loomis, London, Edinburgh Dublin Philos. Mag. J. Sci., 1927, 4, 417–436 CrossRef CAS.
- C. Bondy and K. Söllner, Trans. Faraday Soc., 1935, 31, 843–846 RSC.
- E. C. Marboe and W. A. Weyl, J. Appl. Phys., 1950, 21, 937–938 CrossRef CAS.
- C. Bondy and K. Söllner, Trans. Faraday Soc., 1936, 32, 556–567 RSC.
- T. P. Dirkse, Copper, Silver, Gold & Zinc, Cadmium, Mercury Oxides & Hydroxides, Elsevier, 2016 Search PubMed.
- L. Bosio, R. Cortes and C. Segaud, J. Chem. Phys., 1979, 71, 3595–3600 CrossRef CAS.
- B. R. Orton and R. L. T. Street, J. Phys. C: Solid State Phys., 1972, 5, 2089 CrossRef CAS.
- V. G. Rivlin, R. M. Waghorne and G. I. Williams, Philos. Mag., 1966, 13, 1169–1179 CrossRef CAS.
- Z. Sofer, D. Bouša, J. Luxa, V. Mazanek and M. Pumera, Chem. Commun., 2016, 52, 1563–1566 RSC.
- K. J. Stevenson and K. Tschulik, Curr. Opin. Electrochem., 2017, 6, 38–45 CrossRef CAS.
- A. B. Garrett and A. E. Hirschler, J. Am. Chem. Soc., 1938, 60, 299–306 CrossRef CAS.
Footnote |
| † Electronic supplementary information (ESI) available: Experimental scheme, spike analysis and particle characterisation. See DOI: 10.1039/c9sc04743c |
| This journal is © The Royal Society of Chemistry 2020 |