 Open Access Article
Tumor-acidity activated surface charge conversion of two-photon fluorescent nanoprobe for enhanced cellular uptake and targeted imaging of intracellular hydrogen peroxide†
Lanlan
Chen
*abc,
Shuai
Xu
c,
Wei
Li
c,
Tianbing
Ren
 c,
Lin
Yuan
 c,
Shusheng
Zhang
 *a and
Xiao-Bing
Zhang
 *c
*c
aCollaborative Innovation Center of Tumor Marker Detection Technology, Equipment and Diagnosis-Therapy Integration in Universities of Shandong, Shandong Provincial Key Laboratory of Detection Technology for Tumor Markers, College of Chemistry and Chemical Engineering, Linyi University, Linyi, Shandong 276005, P. R. China. E-mail: lanlanchen1989@126.com; shushzhang@126.com
bThe Key Lab of Analysis and Detection Technology for Food Safety of the MOE, College of Chemistry, Fuzhou University, Fuzhou 350002, P. R. China
cState Key Laboratory of Chemo/Biosensing and Chemometrics, Molecular Science and Biomedicine Laboratory, College of Chemistry and Chemical Engineering, Hunan University, Changsha 410082, P. R. China. E-mail: xbzhang@hnu.edu.cn
First published on 20th August 2019
Abstract
Elevated levels of intracellular hydrogen peroxide (H2O2) are closely related to the development of cancers. Specific imaging of H2O2 in tumor sites would be significant not only for cancer diagnosis but also for gaining a deep understanding of the role of H2O2 in cancer. However, traditional fluorescent probes based only on responses to overexpression levels of H2O2 in cancer cells are insufficient to distinguish cancer cells from other unhealthy or healthy cells in complex biological systems. Herein, we developed a smart, two-photon fluorescent GC–NABP nanoprobe with pH-dependent surface charge conversion for tumor-targeted imaging of H2O2. The nanoprobe was constructed by the self-assembly of amphiphilic GC–NABP, which was synthesized by grafting the hydrophobic, H2O2-responsive and two-photon fluorophore, NABP, onto hydrophilic biopolymer glycol chitosan (GC). Taking advantage of pH-titratable amino groups on GC, the nanoprobe had the capability of surface charge conversion from negative at physiologic pH to positive in the acidic tumor microenvironment. The positive charge of the nanoprobe promoted electrostatic interactions with cell membranes, leading to enhanced cellular uptake in acidic environment. Upon cellular uptake, the high level of H2O2 in tumor cells triggered boronate deprotections of the nanoprobe, generating a “turn-on” fluorescence emission for H2O2 imaging. The nanoprobe exhibited good sensitivity and selectivity to H2O2 with a detection limit down to 110 nM in vitro. The results from flow cytometry and two-photon fluorescence imaging of H2O2 in living cells and tissues evidenced the enhanced cellular uptake and targeted imaging of intracellular H2O2 in acidic environment. Compared to control nanoparticles that lack pH sensitivity, our nanoprobe showed enhanced accumulation in tumor sites and was applied to targeted imaging of H2O2 in a tumor-bearing mouse model. This work demonstrates that the nanoprobe GC–NABP holds great promise for tumor-specific imaging of cellular H2O2, providing a potential tool to explore the role of H2O2 in tumor sites.
Introduction
Hydrogen peroxide (H2O2), one of the most abundant and stable reactive oxygen species (ROS) in living organisms, actively participates in a wide range of physiological processes, such as signaling cell growth and differentiation, regulating the activity of enzymes, and mediating inflammation.1,2 Overproduction and accumulation of H2O2 cause oxidative stress and can damage cellular proteins, lipids and DNA.3 Mounting evidence suggests that abnormal levels of H2O2 are related to cancers.4–6 Elevated generation rates of H2O2 have also been found in most types of cancer cells (up to 0.5 nmol/104 cells per h).7 Therefore, developing effective methods for sensitive detection and real-time monitoring of H2O2 in tumor sites would be of great significance and highly desirable not only for cancer diagnosis but also for gaining a better understanding of the roles of H2O2 in the development of cancers.Fluorescence imaging, particularly using two-photon microscopy (TPM), provides a powerful tool for selective, noninvasive and real-time monitoring of ROS in biological systems with high spatial resolution, deep tissue penetration and low phototoxicity.8–21 To date, several two-photon fluorescence probes have been reported for imaging H2O2 in living cells and tissues.22–25 The “turn on” fluorescence of these probes mainly arises from the oxidative reaction or oxidative rearrangement of the reaction site upon exposure to H2O2. However, some challenges associated with these fluorescent probes remain for the specific imaging of H2O2 in tumor sites. First, differentiating tumor tissues and healthy tissues only using responses of fluorescence signals to overexpressed levels of H2O2 is still insufficient, because the sensitivity of a single response process or event even at a molecular level is limited in a complex biological system. Second, abnormal levels of H2O2 may also be present in some other unhealthy cells, such as inflamed cells,26 increasing the difficulty to effectively distinguish them from cancer cells. Moreover, these small-molecule fluorescent probes often have poor water solubility, biodistribution, rapid renal clearance and short blood circulation, limiting their application to imaging in vivo.
The tumor microenvironment has some unique characteristics; for example, the extracellular pH (pHe) in solid tumors tends to be more acidic (∼6.5) than that of normal tissues (7.4), on the basis of Warburg effect, where increased metabolism and activated anaerobic glycolysis lead to augmented production of acidic metabolites (e.g., lactate).27–30 Many efforts have been devoted to constructing nanomaterials that can respond to this altered acidic tumor microenvironment signal by changing their physicochemical properties including size, zeta potential, and hydrophilic–hydrophobic balance, thereby leading to improved diffusion, cellular uptake, enhanced permeability and retention (EPR) effect and/or targeted imaging.31–38 Targeting to an acidic tumor microenvironment provides a generalizable strategy that can be applied to a broad range of tumors compared with other targeting strategies, such as receptor-specific targeting. Inspired by these, constructing a smart nanoprobe via the integration of stimuli-responsive nanomaterials and fluorescent probes with the remarkable tumor-targeting capacity of nanomaterials in the acidic tumor microenvironment and the outstanding H2O2 imaging properties of fluorescent probes, might be a promising way to realize precise tumor-targeted imaging of H2O2in vivo.
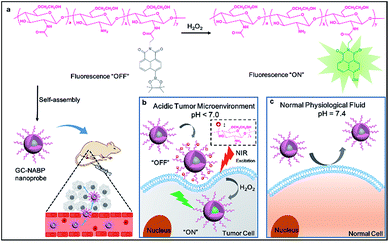
In this work, we developed a novel, smart, two-photon fluorescent GC–NABP nanoprobe with pH-dependent surface charge conversion for tumor-targeted visualization of H2O2 (Scheme 1). GC–NABP was constructed by covalently conjugating the hydrophobic, H2O2-responsive and two-photon fluorophore, NABP, onto side chains of glycol chitosan (GC), which is a water-soluble, low-cost, biocompatible and biodegradable polymer with the capability of pH-titratable charge.39–44 GC–NABP exhibited an amphiphilic feature and could self-assemble into nanosized micelles in aqueous solution. Notably, taking advantage of pH-titratable amino groups on GC (pKa ∼ 6.5), the surface charge of the nanoprobe could transition from negative at physiologic pH to positive in the acidic tumor microenvironment. The nanoprobe with positive charge promoted electrostatic interactions with surrounding cells, leading to enhanced cellular uptake in acidic environment. Once the nanoprobe was internalized in the cells, the high level of H2O2 in tumor cells could initiate boronate deprotections of the nanoprobe, yielding a “turn-on” fluorescence emission for H2O2 imaging. The nanoprobe displayed good sensitivity (a limit of detection of 110 nM in vitro) and selectivity to H2O2. We investigated the capability of the nanoprobe for promoted cellular uptake and targeted imaging of H2O2 in living cells and tissues under acidic environment using flow cytometry and two-photon fluorescence imaging. Compared to control nanoparticles that lack pH sensitivity, the nanoprobe showed enhanced accumulation in tumor sites. Experiments of intravenously injecting the nanoprobe into tumor-bearing mice confirmed that the nanoprobe could achieve tumor-targeted imaging of H2O2. Our results suggest that the nanoprobe GC–NABP might offer a potential imaging tool for tumor-specific visualization of H2O2.
Results and discussion
Synthesis and characterization of GC–NABP and the self-assembled nanoprobe
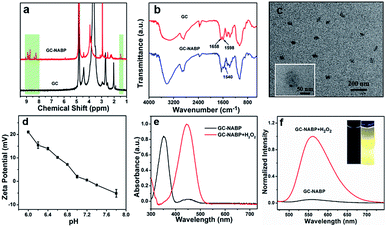
To construct the GC–NABP nanoprobe for H2O2 detection, the H2O2-responsive, two-photon fluorophore, NABP, was synthesized first. As shown in Fig. S1a,† molecule 1 was synthesized by Suzuki coupling of 4-bromo-1,8-naphthalic anhydride and bis(pinacolato)diboron. NABP was obtained by the treatment of 1 with γ-aminobutyic acid. The chemical structure of NABP was confirmed by 1H NMR (Fig. S2†), 13C NMR (Fig. S3†) and HR-MS (Fig. S4†). Then, NABP was reacted with primary amine groups of GC to produce GC–NABP in the presence of EDC and NHS (Fig. S1b†). Compared with the 1H NMR spectrum of GC, new signals of boronate methyl protons at 1.5 ppm and aromatic protons at 8.2–9.0 ppm appeared in the spectrum of GC–NABP (Fig. 1a), suggesting the successful grafting of NABP onto GC. FTIR spectra also confirmed the formation of amide linkages between the carboxyl group of NABP and amine groups of GC (Fig. 1b). Compared with the FTIR spectrum of GC, the peak at 1598 cm−1 in the spectrum of GC–NABP assigned to the N–H bending of primary amine significantly weakened. The characteristic peaks at 1658 and 1540 cm−1, attributed to the carbonyl of amide I band and N–H bending of amide II band, respectively, increased after conjugation. The grafting ratio (nNABP groups/nglucosamine unit in GC) was calculated to be 0.21 according to the UV-vis absorbance at 350 nm of GC–NABP (Fig. S5†).Due to the amphiphilic structure comprising hydrophobic NABP groups and the hydrophilic GC backbone, GC–NABP could be self-assembled into nanosized micelles. The GC–NABP nanoprobe was obtained via a dialysis method. The TEM image (Fig. 1c) shows that the average diameter of the GC–NABP nanoprobe was about 70 nm. DLS results revealed that the nanoprobe had a mean hydrodynamic diameter of 90 ± 20 nm in pH 7.4 PBS and the self-assembled nanoparticles remained at acidic pH (Fig. S6a†). The stability of the nanoprobe was also examined under dilute conditions and in biological media. As shown in Fig. S6b,† the nanoprobe was stable after dilution or in 10% FBS for 24 h.
Titratability of the nanoprobe surface charge
To investigate the titratability of the GC–NABP nanoprobe surface charge, the zeta potential of the GC–NABP nanoprobe was measured at different pH values from 6.0 to 7.8. As shown in Fig. 1d, the GC–NABP nanoprobe demonstrated a distinctly pH-dependent surface charge, with zeta potential values increasing from −1.58 mV at pH 7.4 to +21.03 mV upon exposure to pH 6.0 buffer solution. This result suggests that the nanoprobe might be capable of enhanced cellular internalization through electrostatic interactions (between the positively charged nanoprobe and negatively charged cell membranes) that occur preferentially in the acidic tumor microenvironment.Optical properties of GC–NABP nanoprobe and responses to hydrogen peroxide
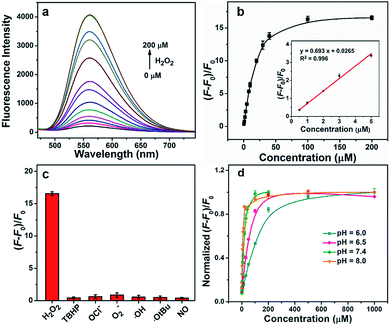
We investigated the optical properties and H2O2 responses of the GC–NABP nanoprobe in PBS buffer (10 mM, pH 7.4). GC–NABP exhibited a maximum UV-vis absorption at 350 nm and weak fluorescence with a maximum at 550 nm. Addition of excess H2O2 triggered a redshift of the absorbance peak from 350 to 450 nm and a significant increase in the fluorescence intensity at 560 nm (Fig. 1e and f). The fluorescence kinetics curve revealed that the fluorescence intensity increased rapidly within 1200 seconds and tended to reach equilibrium at about 3600 seconds when the GC–NABP nanoprobe was treated with a large excess of H2O2 (10 mM) (Fig. S7a†). The kinetics curves were fitted with a pseudo-first-order kinetic equation, giving an observed rate constant (kobs) of 8.21 ± 1.43 × 10⁻⁴ s−1, which is comparable to those of small molecule probes containing boronic ester moieties for H2O2 response.45Then, we performed fluorescence titrations of the GC–NABP nanoprobe upon the addition of H2O2. The fluorescence intensity of the nanoprobe increased gradually with increasing concentration of H2O2 and reached a plateau at a H2O2 concentration of 100 μM with a ∼15-fold increase (Fig. 2a and b). The nanoprobe exhibited a linear fluorescence response in the low concentration range of H2O2 with the detection limit down to 110 nM in vitro. Fluorescence responses of the nanoprobe to other biologically relevant reactive oxygen species (ROS), including tert-butyl hyperoxide (TBHP), OCl−, O2−, ˙OH, ˙OtBu and NO, were also studied. Generally, when treated with H2O2, the aryl boronate group of the nanoprobe initially reacted as an electrophile in a reversible manner with nucleophiles to form a negatively charged tetrahedral boronate complex; then the C–B bond became capable of reacting as a nucleophile (Fig. S8a†).46,47 Benefiting from the dual-mode reactivity of H2O2 with boronate, the nanoprobe displayed a high selectivity for H2O2 over the other ROS (Fig. 2c), whereas most of the other ROS operated by single-electron transfers or purely electrophilic oxidation pathways.45
The H2O2-triggered “turn-on” fluorescence arises from the deprotection of the phenylboronic acid pinacol ester group on the nanoprobe (Fig. S8b†). The deprotection reaction is irreversible, as shown in Fig. S9.† With the addition of the reductant, a negligible change of fluorescence intensity was observed. To verify the response mechanism, we investigated the reaction mixture of NABP with H2O2 using HPLC. As shown in Fig. S10,† with the addition of H2O2, a new peak at 10.6 min appeared, corresponding to 4-hydroxy-1,8-naphthalimide fluorophore (NAOH). The strong peak at m/z 298.02 (Fig. S11†) was attributed to the [M − H]1− ion of NAOH, confirming the oxidation of the boronic ester group to generate NAOH.
The pH of the reaction solution has an effect on the rate of boronate oxidation; thus, responses of the nanoprobe to H2O2 at different pH levels were investigated. As shown in Fig. 2d, due to the promotion of the nucleophilic reaction, the H2O2 response of the nanoprobe was accelerated at high pH values. It is worth noting that the nanoprobe could achieve a H2O2 response both at physiological pH values (e.g. pH 7.4) and acidic tumor pH values.
The two-photon fluorescence properties of GC–NABP in the absence and presence of H2O2 were then studied. GC–NABP treated with H2O2 exhibited the largest two-photon absorption cross section at 780 nm, whereas that of GC–NABP was very low (Fig. S12†).
Enhanced cellular uptake and targeted fluorescence imaging of hydrogen peroxide in living cells under acidic microenvironment
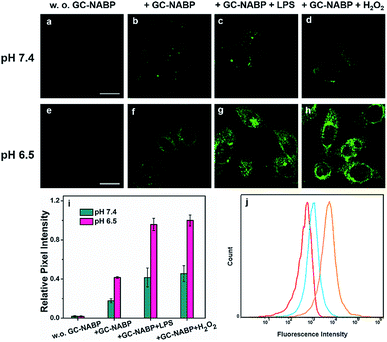
Encouraged by the good sensitivity and selectivity of the GC–NABP nanoprobe for H2O2 responses, we applied the nanoprobe to H2O2 imaging in living cells. Before the bioimaging application, cytotoxicity of the nanoprobe was evaluated by MTT assay. The cell viability was about 97% when cells were incubated with 100 μg mL−1 GC–NABP for 24 h, and remained over 88% even with the concentration up to 1000 μg mL−1 (Fig. S13†), suggesting that the nanoprobe has negligible cytotoxicity and excellent biocompatibility.To demonstrate that the GC–NABP nanoprobe has the ability of targeted bioimaging in acidic microenvironment, TPM imaging of H2O2 in HepG2 cells with the nanoprobe was investigated at two different pH values, pH 7.4 and 6.5 (Fig. 3). Lipopolysaccharide (LPS) was used to stimulate HepG2 cells to generate endogenous H2O2.48 Both at pH 7.4 and 6.5, compared with the weak fluorescence observed in HepG2 cells incubated with only the nanoprobe (Fig. 3b and f), cells pretreated with LPS showed increased fluorescence, suggesting that the nanoprobe could image endogenous H2O2 in living cells. Cells treated with extra H2O2 also showed obvious fluorescence. Furthermore, cells incubated with the nanoprobe in culture medium at pH 6.5 exhibited brighter fluorescence compared with those incubated at pH 7.4 (Fig. 3i). The nanoprobe was also applied for H2O2 imaging in inflamed cells (Fig. S14†). At physiological pH (∼7.4), RAW264.7 cells also exhibited negligible fluorescence even when treated with LPS or H2O2, further confirming that the nanoprobe could specifically image H2O2 in cancer cells in an acidic microenvironment.
To quantitatively examine that the GC–NABP nanoprobe could promote cellular uptake in an acidic pH environment, flow cytometric analysis was performed. The fluorescence intensity was found to be directly related to the amount of nanoprobe internalized. As shown in Fig. 3j, the nanoprobe had a greater uptake at pH 6.5 compared with that at pH 7.4. This result is consistent with the fluorescence imaging studies, confirming that the transition from a negative to positive surface charge indeed facilitated the cellular uptake of the nanoprobe.
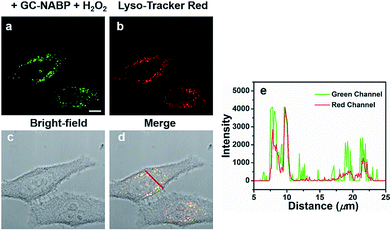
The subcellular localization of the GC–NABP nanoprobe was examined using LysoTracker Red as the co-localization reagent. As shown in Fig. 4, the green fluorescence of GC–NABP treated with H2O2 at physiological temperature (37 °C) overlapped well with the red fluorescence of LysoTracker Red, confirming that the nanoprobes entered the endosomes after cellular internalization. When the incubation temperature was decreased to 4 °C, at which endocytic processes were arrested, the amount of internalized nanoprobes was extremely low, as shown by the weak fluorescence (Fig. S15†). This result suggests that the cellular uptake of the GC–NABP nanoprobe involved an endocytosis pathway, which was energy dependent.
A comparison between TPM and OPM imaging performance of the nanoprobe in HepG2 cells was also demonstrated. As shown in Fig. S16,† compared with OPM, TPM displayed a high signal-to-noise ratio (fluorescence pixel intensity/background pixel intensity) and high resolution. The good biocompatibility, efficient cellular uptake and strong two-photon fluorescence reveal that the GC–NABP nanoprobe can be used as an excellent two-photon probe for targeted bioimaging of H2O2 at acidic pH.
Targeted imaging of hydrogen peroxide in tissues under acidic microenvironment
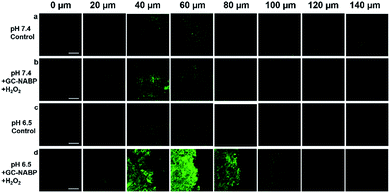
Another advantage of two-photon probes is the capability of imaging deep inside a tissue.49–52 For in vivo bioimaging applications, an exact knowledge about the maximum tissue penetration depth of the nanoprobe was required. Targeted imaging of H2O2 was also assessed in acidic tissues. TPM images of a slice incubated at pH 7.4 (Fig. 5b) revealed weak fluorescence, and negligible fluorescence was observed at depth of 100 μm, whereas strong fluorescence was observed for the slice after treatment at pH 6.5 and the penetration depth reached 120 μm (Fig. 5d). The results further confirmed the facilitated cellular uptake of the GC–NABP nanoprobe at tumorous pH and the enhanced visualization of H2O2 in tumor tissues.Targeted imaging of hydrogen peroxide in tumor-bearing living mouse model
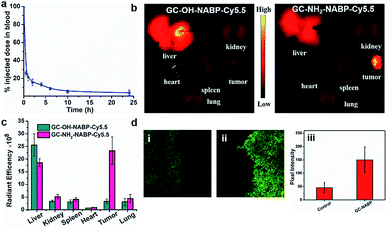
Before the investigation into the targeted imaging of H2O2 in a tumor-bearing living mouse model, we evaluated the blood clearance kinetics and tumor-targeting ability of the GC–NABP nanoprobe in living mice. We labelled GC–NABP with a near-infrared fluorescent dye, Cy5.5, to prepare GC–NH2–NABP–Cy5.5. GC–NABP–Cy5.5 had a similar diameter to the GC–NABP nanoprobe of about 100 nm, and retained the capability of surface charge conversion at acidic pH (Fig. S17†). The blood clearance kinetics of the nanoprobe was examined by intravenous injection of GC–NH2–NABP–Cy5.5 into healthy mice (1 mg mL−1 in 200 μL PBS buffer, n = 3). The concentration of the nanoprobe in the blood was determined using the Cy5.5 fluorescence intensity. As shown in Fig. 6a, the nanoprobe concentration in the blood decreased to 21.5% of the injected dose 1 h after injection and further decreased to 4.2% after 24 h. To demonstrate the effect of surface charge conversion of the nanoprobe on tumor accumulation (aside from the EPR effect), we prepared a control nanoparticle, GC–OH–NABP–Cy5.5, by blocking the pH-titratable amine groups in GC–NH2–NABP–Cy5.5. GC–OH–NABP–Cy5.5 had a similar size to GC–NH2–NABP–Cy5.5 (Fig. S17†). Due to the blocking of amine groups, GC–OH–NABP–Cy5.5 exhibited no surface charge dependence on pH. Fig. 6b shows the accumulation of GC–OH–NABP–Cy5.5 and GC–NH2–NABP–Cy5.5 in tumors and major organs. It was found that GC–NH2–NABP–Cy5.5 accumulated in tumor at a higher level than GC–OH–NABP–Cy5.5, suggesting that the surface charge conversion of the nanoprobe in acidic pH promoted tumor accumulation.Then, we applied the GC–NABP nanoprobe to tumor-targeted H2O2 imaging in living mice. The GC–NABP nanoprobe was intravenously injected into tumor-bearing mice. Due to the high autofluorescence of the emission at 560 nm, we harvested tumor tissues of mice 24 h post-injection for two-photon fluorescence imaging. As shown in Fig. 6d, tumor tissues from mice injected with the GC–NABP nanoprobe exhibited brighter fluorescence than the control group injected with PBS, suggesting the accumulation of the nanoprobe and targeted H2O2 imaging in tumor sites. The targeting ability of the nanoprobe might derive from the enhanced accumulation of the nanoprobe responding to the acidic tumor microenvironment. We expect the design strategy described herein could be extended to construct fluorescent nanoprobes for tumor-targeted imaging of other analytes in living biological systems.
Conclusions
In conclusion, a pH-responsive, two-photon fluorescent GC–NABP nanoprobe was successfully developed for tumor-targeted imaging of intracellular H2O2in vivo. Benefiting from the pH-titratable amino groups on GC, this water-soluble and biocompatible nanoprobe had the capability of targeting tumor sites, due to the response to acidic tumor microenvironment of surface charge change from negative to positive promoting cellular uptake. Subsequently, the high levels of H2O2 in tumor cells triggered the “turn on” fluorescence of the nanoprobe. GC–NABP displayed good sensitivity and selectivity to H2O2. The enhanced cellular uptake and targeted imaging of H2O2 in living cells and tissues under acidic environment were confirmed using flow cytometry and two-photon fluorescence imaging. The nanoprobe exhibited enhanced accumulation in tumor sites and achieved targeted imaging of H2O2 in a tumor-bearing mouse model. This reported nanoprobe might provide a potential tool to explore the complex role of H2O2 in tumor sites.Conflicts of interest
There are no conflicts to declare.Acknowledgements
This work was financially supported by the National Natural Science Foundation of China (21804068, 21890744).Notes and references
- C. C. Winterbourn, Nat. Chem. Biol., 2008, 4, 278–286 CrossRef CAS PubMed.
- S. G. Rhee, Science, 2006, 312, 1882–1883 CrossRef PubMed.
- T. Finke, Curr. Opin. Cell Biol., 2003, 15, 247–254 CrossRef.
- S. Kawanishi, Y. Hiraku, S. Pinlaor and N. Ma, Biol. Chem., 2006, 387, 365–372 CAS.
- G. Y. Liou and P. Storz, Free Radical Res., 2010, 44, 479–496 CrossRef CAS PubMed.
- D. Trachootham, J. Alexandre and P. Huang, Nat. Rev. Drug Discovery, 2009, 8, 579–591 CrossRef CAS PubMed.
- T. P. Szatrowski and C. F. Nathan, Cancer Res., 1991, 51, 794–798 CAS.
- Y. Cheng, J. Dai, C. Sun, R. Liu, T. Zhai, X. Lou and F. Xia, Angew. Chem., Int. Ed., 2018, 57, 3123–3127 CrossRef CAS PubMed.
- B. C. Dickinson, C. Huynh and C. J. Chang, J. Am. Chem. Soc., 2010, 132, 5906–5915 CrossRef CAS PubMed.
- Z. Miao, M. Ye, X. Ye, Y. Wang, H. Zhang, C. Li and Z. Liu, Chem. Sci., 2018, 9, 6035–6040 RSC.
- Z. Miao, H. Jiang, Z. Li, C. Zhong, W. Zhang and Z. Liu, Chem. Sci., 2017, 8, 4533–4538 RSC.
- M. Yang, J. Fan, J. Zhang, J. Du and X. Peng, Chem. Sci., 2018, 9, 6758–6764 RSC.
- W. Zhang, W. Liu, P. Li, F. Huang, H. Wang and B. Tang, Anal. Chem., 2015, 87, 9825–9828 CrossRef CAS PubMed.
- Y. Li, X. Xie, X. Yang, M. Li, X. Jiao, Y. Sun, X. Wang and B. Tang, Chem. Sci., 2017, 8, 4006–4011 RSC.
- D. Cheng, W. Xu, L. Yuan and X. B. Zhang, Anal. Chem., 2017, 89, 7693–7700 CrossRef CAS PubMed.
- Q. Xu, C. H. Heo, G. Kim, H. W. Lee, H. M. Kim and J. Yoon, Angew. Chem., Int. Ed., 2015, 54, 4890–4894 CrossRef CAS.
- H. W. Kim and B. R. Cho, Chem. Rev., 2015, 115, 5014–5055 CrossRef CAS PubMed.
- Y. L. Pak, S. J. Park, D. Wu, B. H. Cheon, H. M. Kim, J. Bouffard and J. Yoon, Angew. Chem., Int. Ed., 2018, 57, 1567–1571 CrossRef CAS PubMed.
- Y. L. Pak, S. J. Park, G. Song, Y. Yim, H. Kang, H. M. Kim, J. Bouffard and J. Yoon, Anal. Chem., 2018, 90, 12937–12943 CrossRef CAS PubMed.
- W. Zhang, P. Li, F. Yang, X. Hu, C. Sun, W. Zhang, D. Chen and B. Tang, J. Am. Chem. Soc., 2013, 135, 14956–14959 CrossRef CAS PubMed.
- X. Jiao, Y. Xiao, Y. Li, M. Liang, X. Xie, X. Wang and B. Tang, Anal. Chem., 2018, 90, 7510–7516 CrossRef CAS PubMed.
- B. Dong, X. Song, X. Kong, C. Wang, Y. Tang, Y. Liu and W. Lin, Adv. Mater., 2016, 28, 8755–8759 CrossRef CAS PubMed.
- C. Li, R. Pan, P. Li, Q. Guan, J. Ao, K. Wang, L. Xu, X. Liang, X. Jin, C. Zhang and X. Zhu, Anal. Chem., 2017, 89, 5966–5975 CrossRef CAS PubMed.
- X. L. Hao, Z. J. Guo, C. Zhang and A. M. Ren, Phys. Chem. Chem. Phys., 2019, 21, 281–291 RSC.
- N. Li, J. Huang, Q. Wang, Y. Gu and P. Wang, Sens. Actuators, B, 2018, 254, 411–416 CrossRef CAS.
- Q. Chen, C. Liang, X. Sun, J. Chen, Z. Yang, H. Zhao, L. Feng and Z. Liu, Proc. Natl. Acad. Sci. U. S. A., 2017, 14, 5343–5348 CrossRef PubMed.
- R. M. Zaguilan, E. A. Seftor, R. E. B. Seftor, Y. W. Chu, R. J. Gillies and M. J. C. Hendrix, Clin. Exp. Metastasis, 1996, 14, 176–186 CrossRef.
- R. J. Gillies, N. Raghunand, G. S. Karczmar and Z. M. Bhujwalla, J Magn Reson Imaging, 2002, 16, 430–450 CrossRef.
- P. Vaupel, F. Kallinowski and P. Okunieff, Cancer Res., 1989, 49, 6449–6465 CAS.
- R. K. Jain and T. Stylianopoulos, Nat. Rev. Clin. Oncol., 2010, 7, 653–664 CrossRef CAS.
- C. Guo, S. Xu, A. Arshad and L. Wang, Chem. Commun., 2018, 54, 9853–9856 RSC.
- S. Huang, S. Peng, Y. Li, J. Cui, H. Chen and L. Wang, Nano Res., 2015, 8, 1932–1943 CrossRef CAS.
- J. Xu, W. Han, Z. Cheng, P. Yang, H. Bi, D. Yang, N. Niu, F. He, S. Gai and J. Lin, Chem. Sci., 2018, 9, 3233–3234 RSC.
- X. Xu, J. Wu, Y. Liu, P. E. Saw, W. Tao, M. Yu, H. Zope, M. Si, A. Victorious, J. Rasmussen, D. Ayyash, O. C. Farokhzad and J. Shi, ACS Nano, 2017, 11, 2618–2627 CrossRef CAS PubMed.
- X. Xu, P. E. Saw, W. Tao, Y. Li, X. Ji, M. Yu, M. Mahmoudi, J. Rasmussen, D. Ayyash, Y. Zhou, O. C. Farokhzad and J. Shi, Nano Lett., 2017, 17, 4427–4435 CrossRef CAS PubMed.
- H. J. Li, J. Z. Du, J. Liu, X. J. Du, S. Shen, Y. H. Zhu, X. Wang, X. Ye, S. Nie and J. Wang, ACS Nano, 2016, 10, 6573–6761 Search PubMed.
- H. J. Li, J. Z. Du, X. J. Du, C. F. Xu, C. Y. Sun, H. X. Wang, Z. T. Cao, X. Z. Yang, Y. H. Zhu, S. Nie and J. Wang, Proc. Natl. Acad. Sci. U. S. A., 2016, 113, 4164–4169 CrossRef CAS PubMed.
- A. H. Ranneh, H. Takemoto, S. Sakuma, A. Awaad, T. Nomoto, Y. Mochida, M. Matsui, K. Tomoda, M. Naito and N. Nishiyama, Angew. Chem., Int. Ed., 2018, 130, 5151–5155 CrossRef.
- X. Bai, S. Xu and L. Wang, Anal. Chem., 2018, 90, 3270–3275 CrossRef CAS.
- L. Yan, S. H. Crayton, J. P. Thawani, A. Amirshaghaghi, A. Tsourkas and Z. Cheng, Small, 2015, 11, 4870–4874 CrossRef CAS.
- S. H. Crayton and A. Tsourkas, ACS Nano, 2011, 5, 9592–9601 CrossRef CAS PubMed.
- K. Nwe, C. H. Huang and A. Tsourkas, J. Med. Chem., 2013, 56, 7862–7869 CrossRef CAS PubMed.
- J. Y. Yhee, S. Jeon, H. Y. Yoon, M. K. Shim, H. Ko, J. Min, J. H. Na, H. Chang, H. Han, J. H. Kim, M. Suh, H. Lee, J. H. Park, K. Kim and I. C. Kwon, J. Controlled Release, 2017, 267, 223–231 CrossRef CAS PubMed.
- L. Meng, W. Huang, D. Wang, X. Huang, X. Zhu and D. Yan, Biomacromolecules, 2013, 14, 2601–2610 CrossRef CAS PubMed.
- A. R. Lippert, G. C. V. D. Bittner and C. J. Chang, Acc. Chem. Res., 2011, 44, 793–804 CrossRef CAS.
- C. G. Lux, S. Joshi-Barr, T. Nguyen, E. Mahmoud, E. Schopf, N. Fomina and A. Almutairi, J. Am. Chem. Soc., 2012, 134, 15758–15764 CrossRef.
- Z. Deng, Y. Qian, Y. Yu, G. Liu, J. Hu, G. Zhang and S. Liu, J. Am. Chem. Soc., 2016, 138, 10452–10466 CrossRef CAS.
- A. Shrestha and P. H. Park, Life Sci., 2016, 148, 71–79 CrossRef CAS.
- P. Wang, C. Zhang, H. W. Liu, M. Xiong, S. Y. Yin, Y. Yang, X. X. Hu, X. Yin, X. B. Zhang and W. H. Tan, Chem. Sci., 2017, 8, 8214–8220 RSC.
- P. Wang, F. Zhou, C. Zhang, S. Y. Yin, L. Teng, L. Chen, X. X. Hu, H. W. Liu, X. Yin and X. B. Zhang, Chem. Sci., 2018, 9, 8402–8408 RSC.
- C. Yang, X. Yin, S. Y. Huan, L. Chen, X. X. Hu, M. Y. Xiong, K. Chen and X. B. Zhang, Anal. Chem., 2018, 90, 3118–3123 CrossRef CAS.
- S. Xu, H. W. Liu, X. X. Hu, S. Y. Huan, J. Zhang, Y. C. Liu, L. Yuan, F. L. Qu, X. B. Zhang and W. Tan, Anal. Chem., 2017, 89, 7641–7648 CrossRef CAS.
Footnote |
| † Electronic supplementary information (ESI) available. See DOI: 10.1039/c9sc03781k |
| This journal is © The Royal Society of Chemistry 2019 |

