
 Open Access Article
 This Open Access Article is licensed under a Creative Commons Attribution-Non Commercial 3.0 Unported Licence
Fluoro-electrochemical microscopy reveals group specific differential susceptibility of phytoplankton towards oxidative damage†
Minjun
Yang
 a,
Christopher
Batchelor-McAuley
a,
Lifu
Chen
a,
Yanjun
Guo
a,
Qiong
Zhang
b,
Rosalind E. M.
Rickaby
b,
Heather A.
Bouman
b and
Richard G.
Compton
*a
a,
Christopher
Batchelor-McAuley
a,
Lifu
Chen
a,
Yanjun
Guo
a,
Qiong
Zhang
b,
Rosalind E. M.
Rickaby
b,
Heather A.
Bouman
b and
Richard G.
Compton
*a
aPhysical and Theoretical Chemistry Laboratory, Department of Chemistry, University of Oxford, South Parks Road, Oxford, OX1 3QZ, UK. E-mail: Richard.Compton@chem.ox.ac.uk
bDepartment of Earth Sciences, University of Oxford, South Parks Road, Oxford, OX1 3AN, UK
First published on 16th July 2019
Abstract
In the vicinity of an electrode creating a highly oxidising environment the fluorescence – arising from the presence of chlorophyll-a – of single cellular phytoplankton becomes inhibited. Even for phytoplankton that are very comparable in size (ca. 2–20 μm) the rate of this (electro)chemically induced fluorescence inhibition differs significantly between phytoplankton species; the fluorescence signal of the freshwater algae Stichococcus bacillaris turns off ∼70 times faster than that of the marine coccolithophore Emiliana huxleyi. The varying behaviour reflects the differing susceptibility of these globally important phytoplankton species towards extreme levels of radical induced oxidative stress, indicating the physical and chemical properties of the plankton cell wall and membrane are very different between species, and are important in determining their susceptibility. These results have potential implications for the analytical detection and characterisation of phytoplankton cells in the natural environment.
Introduction
The denomination phytoplankton is a broad catch-all term encompassing a range of single cellular microorganisms spanning twelve taxonomic divisions and includes both Eukaryotes and Bacteria. Over 5000 species of phytoplankton1 have been identified with sizes ranging from 1 μm to over 100 μm. However, all phytoplankton cells contain chlorophyll-a (chl-a) which absorbs light and is used for the conversion of dissolved inorganic carbon (e.g. CO2(aq)) to organic molecules such as carbohydrates, lipids and proteins.2 Although individual phytoplankton are microscopic in size, they are responsible for approximately half of the photosynthesis on Earth, and are the conduit through which energy enters aquatic ecosystems. There is currently active debate regarding the extent to which global phytoplankton biomass may have declined over the previous century;3,4 this has serious implications for the global marine ecosystem. Phytoplankton cells can achieve high densities in the natural environment that alter the colour of the surface ocean which can be viewed in satellite images.5 These images can be used to remotely measure the scale and density of a phytoplankton bloom.6–8Beyond the use of chl-a fluorescence to estimate phytoplankton biomass, the time variation of the cellular chl-a fluorescence intensity may also be used to yield insight into the photosynthetic performance of phytoplankton.9,10 Fast repetition rate fluorometry11 allows, amongst other parameters, the photochemical conversion efficiency and the photosystem II functional absorption cross section to be analysed. Such cell physiology measurements, in combination with the assessments of cell growth are a common route by which the effects of cellular oxidative stress are investigated.12 In terms of species identification and cell density estimation, both at sea and in the laboratory, flow cytometry is a primary technique;13 where the relationship between side scatter versus fluorescence intensity is used to identify the presence of different plankton species. This procedure is however not without limitations; problems arise when species have similar optical properties or when single species display a wide size range due to cell agglomeration and chain formation.14
Reflecting the fact that phytoplankton occur in a number of taxonomic divisions, their composition, shape and size varies widely between species. For example Emiliana huxleyi is a representative species of calcifying phytoplankton; such plankton produce plates of calcium carbonate inside their cells which are extruded onto their external cell walls. These calcifying plankton species play a critical role in the oceanic carbon cycle.15–18 Despite being energetically costly,19 it has been proposed that calcification offers coccolithophores physical protection, reduces UV damage, and potentially accelerates photosynthesis.20,21 In contrast, diatoms are encased in a siliceous skeleton and play a key role in the transport of carbon to the ocean's interior. The morphologically diverse green algae are cosmopolitan members of aquatic ecosystems and can be important contributors to primary production in productive marine and freshwater environments.
In clear water solar UV radiation penetrates to a depth of 10–20 m.22,23 The susceptibility of phytoplankton towards solar radiation damage has been previously reported, where the sensitivity of different species is often interpreted on an allometric (cell size) basis.24,25 Beyond direct radiation damage, UV light is also able to photolyse nitrate, nitrites and other chromophoric dissolved organic matter present in the ocean; these photoreactions are a major source of hydroxyl radicals in the marine environment.26 Furthermore, at the air–water interface the transfer of atmospheric hydroxyl radicals to the water has also been evidenced to be an important source of oxidising radicals.27 Once transferred or formed in the aqueous phase these highly reactive hydroxyl radicals will lead to the formation of other reactive species such as carbonate radicals. Highly oxidising and reactive species are potentially deleterious for aquatic life.28
Radical species can be formed not just photochemically but also electrochemically. Hydroxyl radicals can be generated on a large scale via a strong electric-field gas discharge (kV) to eliminate invasive marine species in ship's ballast water;29 microscopic marine species such as phytoplankton and bacteria were shown to be killed within tens of seconds.30–33 On a small scale, high potentials at carbon electrodes can oxidise water and/or the ions present in solution (“solvent breakdown”). Although at these high potentials the formation of oxygen from water is thermodynamically favourable, the process involves multiple steps; consequently, in the absence of a suitable oxygen evolving catalyst such as a metal oxide,34,35 significant quantities of reactive intermediates (such as hydroxyl radicals, OH˙) will be formed. At pH 7 the electrode potential for the one-electron oxidation of water to the hydroxyl radical is +2.07 V (vs. Saturated Calomel Electrode, SCE).36 Hence, in accordance with the Nernst equation and assuming reversibility of the electrode process, the formation of concentrations of hydroxyl radicals as high as millimolar may be favourable at around ∼1.9 V (vs. SCE). Notably, the direct one-electron oxidation of hydroxide occurs at significantly lower potentials of 1.3 V vs. SCE on gold electrodes.37
This article studies the interaction between phytoplankton and electrochemically formed highly oxidising species using fluorescence electrochemical microscopy. We primarily focus on the study of six phytoplankton in four different groups, namely a diatom (Halamphora coffeaeformis), a coccolithophore (Emiliana huxleyi), the eustigmatophyte Nannochloropsis oceanica and three fresh water green algae (Stichococcus bacillaris, Chlorella singularis and Chlorella volutis). Also investigated is a representative dinoflagellate (Scrippsiella trochoidea), however, study of this species was somewhat limited by its low cell density. The results evidence the widely different sensitivity of phytoplankton species towards strongly oxidising environments, and indicate that the differences reflect the different physical and chemical composition of the shells and outer membranes of the phytoplankton.
Results and discussion
All species selected for study in this work are comparable in size with length scales in the range of 2–20 μm. The plankton can be visualised under a fluorescence microscope (excitation wavelength of 475 ± 35 nm and the emission by-pass above >590 nm) due to their strong fluorescence response arising from the presence of chl-a in the cells. However, these species differ markedly in their cell structure, the diatom has a porous silicate shell, the coccolithophore can be found encased in a shell of calcium carbonate and the algae have cellulose based cell walls (see ESI† Section 1 for further information).This work starts by studying the response of the diatom H. coffeaeformis in a fluoro-electrochemical cell. Fig. 1 depicts a series of fluorescent microscope images for H. coffeaeformis. The bright features present in the optical field are the phytoplankton present either as individuals or in larger agglomerates. These diatoms are held in a thin layer cell (ca. 50 μm depth) which also contains a carbon fibre electrode (electrode radius = 3.5 μm). The cell also contains counter and reference electrodes. A schematic of the cell is shown in the ESI† Section 2 along with full experimental details. These carbon fibre electrodes are non-fluorescent and hence are not observable under the epi-fluorescent illumination conditions. In Fig. 1 the position of the carbon fibre wire is indicated by the blue line across the microscope image. Initially a potential of 0.0 V was initially applied to the electrode for 60 s and a series of microscope images recorded at 10 frames per second. At this potential (0.0 V) no Faradaic reactions occur at the carbon fibre electrode. After 60 seconds the applied potential is stepped to an oxidative potential of +2.3 V. Fig. 1 shows a series of images of the thin-layer cell taken at different times after the onset of the higher potential (the full Video can be found in ESI† Section 3). As can be seen from Fig. 1 the fluorescence response of H. coffeaeformis closest to the electrode are ‘switched off’ first and the fluorescence associated with the diatoms further away from the electrode progressively decrease with increasing time. First, a potential above approximately +1.4 V (see ESI† Section 4) needs to be applied to the electrode in order for the fluorescence of the phytoplankton to be affected over the timescale of the experiment (ca. tens of seconds). Second, no change in the fluorescence response of the diatoms was observed if a reductive potential was held on the electrode (studied down to −2.0 V). The following section serves to quantify the rate at which this electrochemically induced change in cellular fluorescence occurs.
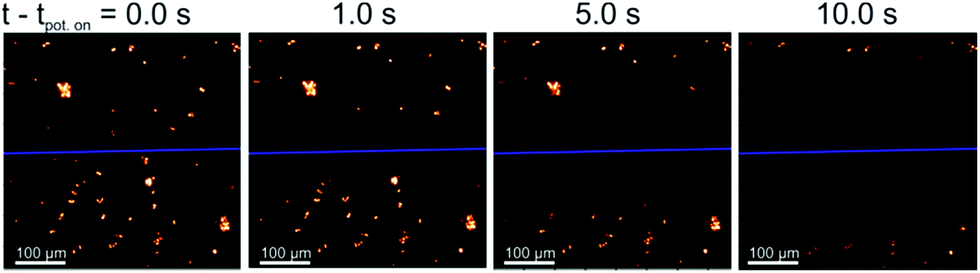 | ||
| Fig. 1 Optical images of the chl-a fluorescence of H. coffeaeformis (diatom, CCAP 1001/2) during the fluoro-electrochemical experiment, where tpot. on is the time which a potential step of 2.3 V (vs. pseudo Ag wire) was applied to the working electrode. λex = 475 ± 35 nm and λem > 590 nm. The blue line depicts the location of the carbon fibre electrode. A potential of 0 V (vs. pseudo Ag wire) was applied for t = 0–60 s, before the potential steps to 2.3 V for t = 60–90 s. | ||
The fluorescence response of individual phytoplankton were measured over the entire plankton cell via integration of the microscope image to obtain per plankton mean fluorescence intensities. The perpendicular distances between different plankton and the electrode were also measured and found to be in the range of 2 μm to 330 μm. Fig. 2 shows the integrated fluorescence intensity of five individual and representative H. coffeaeformis cells as a function of time, the fluorescence intensity has been normalised against its value recorded at t − tpot-on = 0 s and each trace in Fig. 2 is for a different diatom. The fluorescent transients depicted in Fig. 2 are for diatoms situated in the range of 10–250 μm away from the carbon electrode. As can be seen, the mean phytoplankton fluorescence intensity can be used to quantify the rate at which the electrode inhibits the chl-a fluorescence signal, for the diatoms their fluorescence intensity decreases dramatically over the course of the experiment.
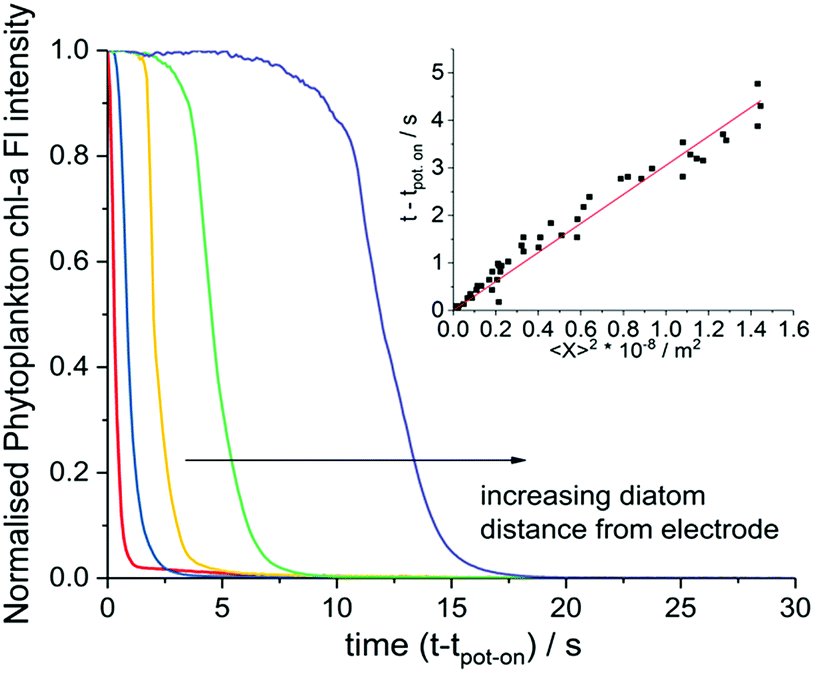 | ||
| Fig. 2 Normalised chl-a fluorescence intensity of individual H. coffeaeformis cells (diatom, CCAP 1001/2) located at different distances from the electrode during the fluoro-chronoamperometry experiment. The fluorescence intensity of the phytoplankton have been normalised relative to their intensity measured at the onset of the high overpotential application at t − tpot-on = 0.0 s. The algal cells are located at distance of approximately 10, 30, 60, 120 and 250 μm from the carbon electrode for the red, blue, yellow, green and purple lines respectively. Inlay shows a plot of the time taken for a diatom's chl-a fluorescence intensity to drop abnormally due to the potential step, versus the square of the measured perpendicular distance of the diatoms from the electrode. | ||
The inlay of Fig. 2 plots the time at which the phytoplankton fluorescence intensity decrease is initiated as plotted against the distance squared; a clear quasi–linear correlation is recorded; such that, the time taken for the diatom fluorescence to be ‘switched off’ correlates directly with the distance of the individual algal cells from the electrode. The results shown in the inlay of Fig. 2 come from three separate experiments highlighting the reproducibility of the system. Note at longer distances there is a further deviation away from this linearity, see ESI† Section 5 and 8 for further discussion and the data analysis method. From this set of experiments it is clear that the chemical products of the electro-oxidation process diffuse away from the electrode and increasingly inhibit the phytoplankton fluorescence at greater distance from the electrode with time.
An important question is; what is the identity of the electro-generated species causing the change in the phytoplankton fluorescence? Previous work in the literature has shown both in vivo and in vitro that strongly oxidising radical species, such as the hydroxyl radical, can cause the oxidative destruction of chl-a.38 In this work a number of small oxidising molecules can be produced at the electrode potentials used, including, oxygen (1.9–2.1 × 10⁻⁹ m2 s−1),39–42 chlorine (1.38 × 10⁻⁹ m2 s−1),43 hydrogen peroxide (1.43 × 10⁻⁹ m2 s−1),42 and hydroxyl radicals (1–3 × 10⁻⁹ m2 s−1);44,45 all of which have comparable diffusion coefficients. In order to try and identify the active species the in vivo chl-a fluorescence spectra of a H. coffeaeformis culture was studied in homogenous solution as a function of the chemical conditions (see ESI† Section 6). The fluorescence emission peak at 680 nm did not change significantly with the addition of either 0.1 M HCl(aq), H2O2 (33%) or 100 mM FeSO4(aq). However, addition of H2O2 (33%) together with 100 mM FeSO4(aq), (known as “Fenton's reagent”) led to a significant drop in emission intensity at 680 nm. The Fe2+ is well known to act as a catalyst for the breakdown of H2O2 to generate reactive oxygen radicals in situ46
| Fe2+ + H2O2 → Fe3+ + HO˙ + OH− | (1) |
| Fe3+ + H2O2 → Fe2+ + HOO˙ + H+ | (2) |
Although chlorine can also lead to the oxidative destruction of the chl-a phytoplankton fluorescence signal, work provided in ESI† Section 6 demonstrates how the electrochemical inhibition may also be driven to occur in the absence of solution phase chloride. As the prescence of chloride is not essential, it is therefore likely that oxidative radical species are the primary cause of the fluorescence inhibition. Furthermore, despite the fact that Fenton's reagent forms hydroxyl radicals, this species is highly reactive with a sub-micro second lifetime.44 Consequently, since the phytoplankton are situated away from the electrochemical interface it is possible that it is the generated products from hydroxyl radical reactions26 in the fluoro-electrochemical experiment that propagated away to react with the phytoplankton and are the primary cause of the observed fluorescence ‘switch off’. However the direct involvement of very low OH˙ concentration cannot be discounted and so in summary it can be concluded, at present, that OH˙ or products derived from it are responsible for the switch off.
Next, we turn to consider how other phytoplankton species are affected by the oxidation process. First, the fluoro-electrochemical experiment was conducted with a cell containing the diatom H. coffeaeformis (as used above), the coccolithophore E. huxleyi and the dinoflagellate S. trochoidea; see ESI† Section 3 for example experimental videos. Fig. 3 shows a plot of the normalised fluorescence intensity, for a representative individual H. coffeaeformis and E. huxleyi, approximately equidistant from the electrode (ca. 20 μm), plotted against time after onset of the oxidising potential. First, the H. coffeaeformis fluorescence (yellow line) starts to decrease only a second after the electrode potential has been switched to +2.3 V. Second, in contrast the fluorescence intensity of the E. huxleyi (red line) initially increases slightly but then shows a dramatic decrease in fluorescence intensity after 15 s of electrode potential being changed.
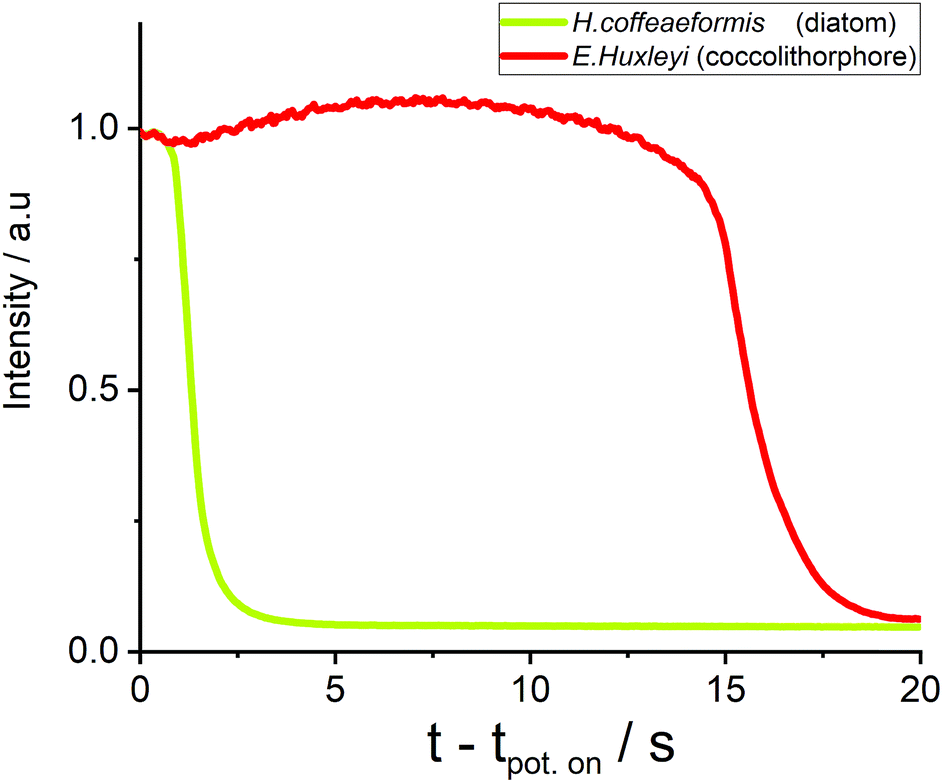 | ||
| Fig. 3 Chlorophyll-a fluorescence response of diatom (H. coffeaeformis, CCAP 1001/2, yellow line) and coccolithophore (E. huxleyi, RCC 174, red line) at equal distance 20 ± 1 μm away from the electrode. | ||
As shown in ESI† Section 7 this rapid drop in fluorescence intensity is a general feature of the E. huxleyi response towards the oxidative conditions. These two plankton are present in the same electrochemical experiment and hence the differing behaviour is not related to any variability in the electrochemical conditions. The rapid loss of fluorescence for the E. huxleyi after an initial delay most likely arises due to the cells outer structure being initially less permeable to the oxidative species followed by the sudden and rapid breaching of the shell, presumably caused by external chemical attack of the oxidative radical species. This conclusion is corroborated by the recorded microscope response of the S. trochoidea (see ESI† Section 3), this phytoplankter is relatively large compared to the others used in this study with a diameter of >20 μm. Consequently, with the use of 40X objective the internal structure of the plankton can be monitored; the experimental video (ESI† Section 3) shows that the major decrease in the phytoplankton fluorescence occurs after an abrupt change in the phytoplankton structure; which is likely associated with the rupturing of the cells external protection layer. These results are strongly suggestive that difference in behaviour of the species relates not to their size but due to their differing biomineral covering or outer membrane structures.
We turn to consider to what extent the sensitivity towards oxidative attack differs between phytoplankton groups. The fluoro-electrochemical experiment described above was undertaken with an additional four different species of phytoplankton. Fig. 4a plots the total collated results for the seven different phytoplankton species studied, here the onset of the fluorescence decrease as a function of time has been plotted against the phytoplankton distance from the electrode squared. Fig. 4a shows that, although for a given species there is a strong correlation between the distance between the electrode and the time at which the fluorescence inhibition onsets, there is a very wide difference in behaviour between the different species. For example on the time scale of this experiment, only ca. 24% of the E. huxleyi observed within the field of the microscope were affected by the oxidative potential and all of those affected were within 60 μm of the electrode. In contrast, the fluorescence signals of all of the S. bacillaris, within a distance of approximately 100 μm of the electrode, were inhibited within 2 seconds of the oxidising potential being applied to the electrode. Note, the dinoflagellate S. trochoidea was also studied within the electro-fluorescence cell. S. trochoidea are relatively large and present in solution at low cell densities. Hence, the imaging of only three individual S. trochoidea was achieved the results of which are presented in Fig. 4a black squares. For all of the species presented in Fig. 4a – excluding S. trochoidea, for which insufficient data could be acquired – the scatter plot for each species is quasi-linear; the 95% confidence interval of a line of best fit is overlaid on the data.
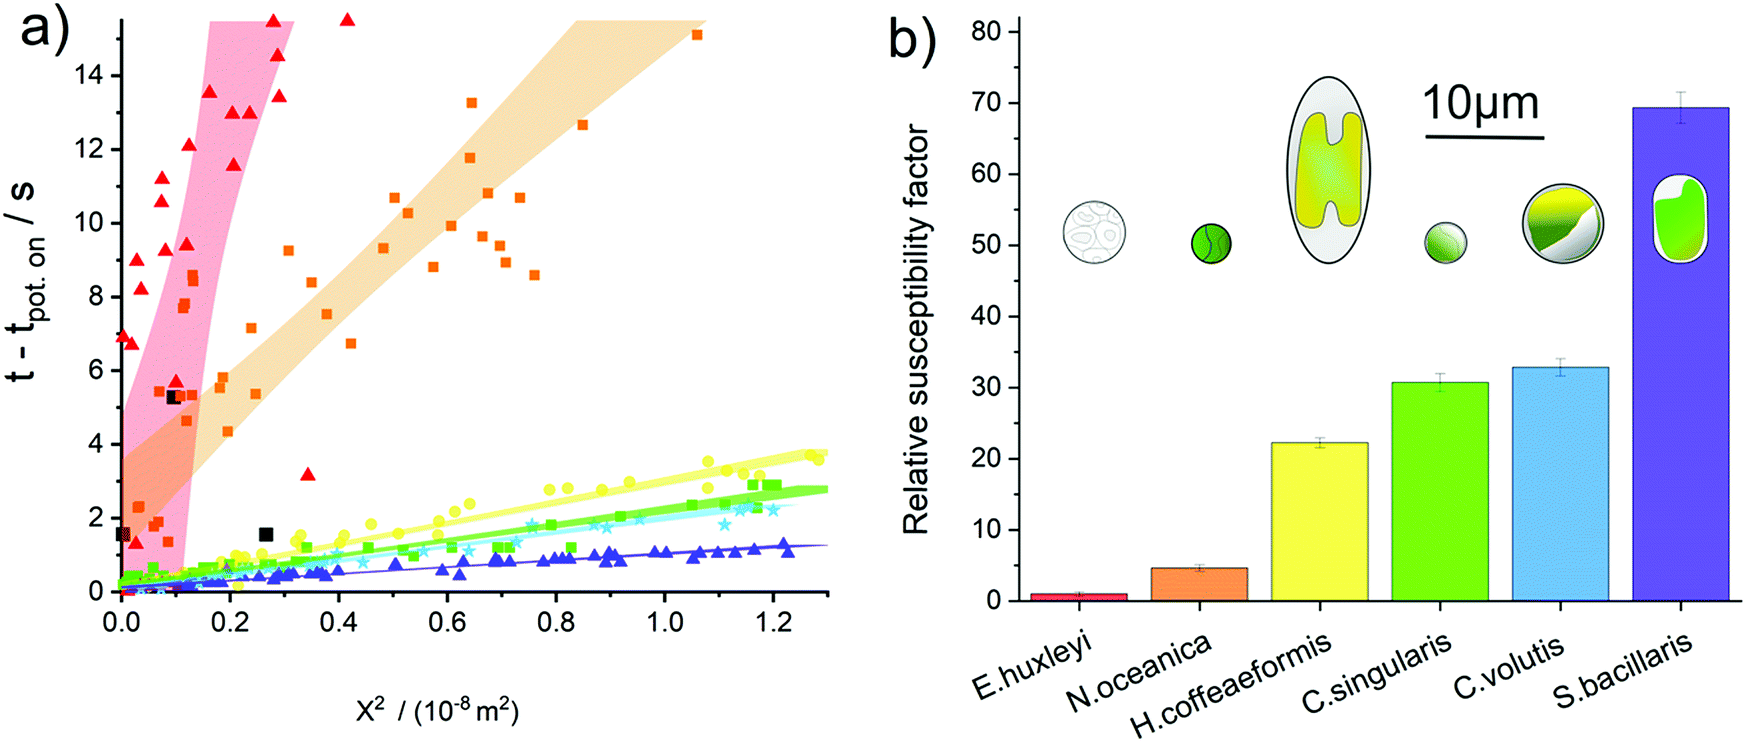 | ||
| Fig. 4 (a) A plot of time at which chl-a fluorescence decrease abnormally after application of an oxidising electrode potential versus square of the distance of the phytoplankton from the electrode. Red triangles – E. huxleyi; orange squares – N. oceanica; yellow circles – H. coffeaeformis; green squares – C. singularis; blue stars – C. volutis; magenta triangles – S. bacillaris and black squares – S. trochoidea. The highlighted areas depict the 95% confidence for the line of best fit as used in the calculation of the susceptibility factor, note the line of best fit has not been forced through the origin. (b) plots the relative susceptibility factor for each species towards oxidative radical attack, normalised to E. huxleyi. Also shown on this plot are cartoons representing the size and shape of the plankton involved, this demonstrates that there is no clear correlation between the plankton susceptibility and its morphology or size. | ||
This linearity in the plot of the square of the distance versus time predominantly reflects the fact that the reactive species created at the electrode need to diffuse away from the interface prior to reacting with and damaging the phytoplankton. For a molecule freely diffusing in solution, the mean square distance travelled 〈X2〉 in one dimension is equal to:47
| 〈X2〉 ≈ 2Dt | (3) |
Conclusions
In this work the chl-a fluorescence of phytoplankton was investigated using a fluoro-electrochemical cell. The phytoplankton were found to be highly sensitive to electrochemically oxidising but not reductive conditions. The in situ electrochemically generated radical species irreversibly inhibit the phytoplankton fluorescence. This inhibition rate is evidenced to reflect neither the size nor the shape of the phytoplankton but most likely relates to the physical and chemical properties of the shell and outer membrane of the phytoplankton; the rate determining step is the chemical destruction of the outer cellular structure, once the radicals enter the cell the chl-a fluorescence is rapidly extinguished. Profoundly, the rate at which the fluorescence is inhibited varies between species by almost two orders of magnitude. Beyond, possible biological implications of the differing susceptibility of different plankton group towards extreme oxidative stress, on a pragmatic level the ability to differentiate between phytoplankton on the basis of their oxidative susceptibility has potential application in high-throughput methods for phytoplankton identification and bloom monitoring.Conflicts of interest
There are no conflicts to declare.Acknowledgements
This research was partially funded by St. John's College Oxford. This project has also received funding from the European Research Council (ERC) under the European Union's Horizon 2020 research and innovation programme (APPELS project, grant agreement 681746).Notes and references
- A. Sournia, M. J. Chrdtiennot-Dinet and M. Ricard, J. Plankton Res., 1991, 13, 1093–1099 CrossRef.
- J. R. Reinfelder, Annual Review of Marine Science, 2011, 3, 291–315 CrossRef.
- D. G. Boyce, M. R. Lewis and B. Worm, Nature, 2010, 466, 591 CrossRef CAS.
- D. G. Boyce, M. Dowd, M. R. Lewis and B. Worm, Prog. Oceanogr., 2014, 122, 163–173 CrossRef.
- H. Claustre and S. Maritorena, Science, 2003, 302, 1514–1515 CrossRef CAS.
- D. Blondeau-Patissier, J. F. Gower, A. G. Dekker, S. R. Phinn and V. E. Brando, Prog. Oceanogr., 2014, 123, 123–144 CrossRef.
- B. B. Barnes, C. Hu, B. A. Schaeffer, Z. Lee, D. A. Palandro and J. C. Lehrter, Remote Sensing of Environment, 2013, 134, 377–391 CrossRef.
- A. Nair, S. Sathyendranath, T. Platt, J. Morales, V. Stuart, M.-H. Forget, E. Devred and H. Bouman, Remote Sensing of Environment, 2008, 112, 3366–3375 CrossRef.
- A. D. Jassby and T. Platt, Limnol. Oceanogr., 1976, 21, 540–547 CrossRef CAS.
- M. A. Marcoval, V. E. Villafane and E. W. Helbling, J. Photochem. Photobiol., B, 2007, 89, 78–87 CrossRef CAS.
- M. Y. Gorbunov, Z. S. Kolber and P. G. Falkowski, Photosynth. Res., 1999, 62, 141–153 CrossRef CAS.
- V. Randhawa, M. Thakkar and L. Wei, Aquat. Toxicol., 2013, 142, 230–238 CrossRef.
- J. L. Collier, J. Phycol., 2000, 36, 628–644 CrossRef.
- R. Jonker, R. Groben, G. Tarran, L. Medlin, M. Wilkins, L. García, L. Zabala and L. Boddy, Sci. Mar., 2000, 64, 225–234 CrossRef.
- U. Riebesell, I. Zondervan, B. Rost, P. D. Tortell, R. E. Zeebe and F. M. Morel, Nature, 2000, 407, 364 CrossRef CAS.
- D. A. Wolf-Gladrow, U. Riebesell, S. Burkhardt and J. Bijma, Tellus B, 1999, 51, 461–476 CrossRef.
- J. C. Orr, V. J. Fabry, O. Aumont, L. Bopp, S. C. Doney, R. A. Feely, A. Gnanadesikan, N. Gruber, A. Ishida and F. Joos, Nature, 2005, 437, 681 CrossRef CAS PubMed.
- J. C. Steinmetz, in Coccolithophores, Cambridge University Press, Cambridge, 1994, pp. 179–197 Search PubMed.
- T. Anning, N. Nimer, M. Merrett and C. Brownlee, Journal of Marine Systems, 1996, 9, 45–56 CrossRef.
- F. M. Monteiro, L. T. Bach, C. Brownlee, P. Bown, R. E. Rickaby, A. J. Poulton, T. Tyrrell, L. Beaufort, S. Dutkiewicz and S. Gibbs, Sci. Adv., 2016, 2, e1501822 CrossRef.
- U. Riebesell, J. Oceanogr., 2004, 60, 719–729 CrossRef CAS.
- E. M. Fleischmann, Limnol. Oceanogr., 1989, 34, 1623–1629 CrossRef.
- J. T. O. Kirk, Light and Photosynthesis in Aquatic Ecosystems, Cambridge University Press, 1994 Search PubMed.
- N. Marbà, C. M. Duarte and S. Agustí, Proc. Natl. Acad. Sci. U. S. A., 2007, 104, 15777–15780 CrossRef.
- M. Llabrés and S. Agustí, Limnol. Oceanogr., 2006, 51, 21–29 CrossRef.
- S. Gligorovski, R. Strekowski, S. Barbati and D. Vione, Chem. Rev., 2015, 115, 13051–13092 CrossRef CAS PubMed.
- M. Llabrés, J. Dachs and S. Agustí, Photochem. Photobiol., 2012, 88, 1473–1479 CrossRef.
- K. Mopper and X. Zhou, Science, 1990, 250, 661–664 CrossRef CAS.
- M. Bai, Z. Zhang, N. Zhang, Y. Tian, C. Chen and X. Meng, Plasma Chem. Plasma Process., 2012, 32, 693–702 CrossRef CAS.
- M. Bai, Z. Zhang, X. Xue, X. Yang, L. Hua and D. Fan, Plasma Chem. Plasma Process., 2010, 30, 831–840 CrossRef CAS.
- Y. Zhang, M. Bai, C. Chen, X. Meng, Y. Tian, N. Zhang and Z. Yu, Plasma Chem. Plasma Process., 2013, 33, 751–763 CrossRef CAS.
- Z. Zhang, M. Bai, M. Bai, B. Yang and X. Bai, IEEE Trans. Plasma Sci., 2006, 34, 2618–2623 CAS.
- Z. Zhitao, B. Mindong, Y. Bo, B. Mindi and B. Xiyao, Plasma Sci. Technol., 2005, 7, 3025 CrossRef.
- Y. Matsumoto and E. Sato, Mater. Chem. Phys., 1986, 14, 397–426 CrossRef CAS.
- J. Rossmeisl, Z.-W. Qu, H. Zhu, G.-J. Kroes and J. K. Nørskov, J. Electroanal. Chem., 2007, 607, 83–89 CrossRef CAS.
- A. Hickling and S. Hill, Trans. Faraday Soc., 1950, 46, 557–559 RSC.
- M. E. Abdelsalam, G. Denuault, M. A. Baldo and S. Daniele, J. Electroanal. Chem., 1998, 449, 5–7 CrossRef CAS.
- J. R. Harbour and J. R. Bolton, Photochem. Photobiol., 1978, 28, 231–234 CrossRef CAS.
- J. Jordan, E. Ackerman and R. L. Berger, J. Am. Chem. Soc., 1956, 78, 2979–2983 CrossRef CAS.
- R. E. Davis, G. L. Horvath and C. W. Tobias, Electrochim. Acta, 1967, 12, 287–297 CrossRef CAS.
- D. M. Himmelblau, Chem. Rev., 1964, 64, 527–550 CrossRef CAS.
- S. A. M. van Stroe-Biezen, F. M. Everaerts, L. J. J. Janssen and R. A. Tacken, Anal. Chim. Acta, 1993, 273, 553–560 CrossRef CAS.
- A. Tang and O. C. Sandall, J. Chem. Eng. Data, 1985, 30, 189–191 CrossRef CAS.
- G. V. Buxton, C. L. Greenstock, W. P. Helman and A. B. Ross, J. Phys. Chem. Ref. Data, 1988, 17, 513–886 CrossRef CAS.
- D. T. Kallikragas, A. Y. Plugatyr and I. M. Svishchev, J. Chem. Eng. Data, 2014, 59, 1964–1969 CrossRef CAS.
- H. J. H. Fenton, J. Chem. Soc., Trans., 1894, 65, 899–910 RSC.
- A. Einstein, Ann. Phys., 1905, 322, 549–560 CrossRef.
Footnote |
| † Electronic supplementary information (ESI) available. See DOI: 10.1039/c9sc02699a |
| This journal is © The Royal Society of Chemistry 2019 |