 Open Access Article
Electronic transitions of molecules: vibrating Lewis structures
Yu
Liu
a,
Philip
Kilby
b,
Terry J.
Frankcombe
c and
Timothy W.
Schmidt
 *a
*a
aARC Centre of Excellence in Exciton Science, School of Chemistry, UNSW Sydney, NSW 2052, Australia. E-mail: timothy.schmidt@unsw.edu.au; Tel: +61 439 386 109
bData 61, Locked Bag 8001, Canberra, ACT 2601, Australia
cSchool of Science, UNSW Canberra, ACT 2600, Australia
First published on 11th June 2019
Abstract
Since the conception of the electron pair bond, Lewis structures have been used to illustrate the electronic structure of a molecule in its ground state. But, for excited states, most descriptions rely on the concept of molecular orbitals. In this work we demonstrate a simple and intuitive description of electronic resonances in terms of localized electron vibrations. By partitioning the 3N-dimensional space of a many-electron wavefunction into hyper-regions related by permutation symmetry, chemical structures naturally result which correspond closely to Lewis structures, with identifiable single and double bonds, and lone pairs. Here we demonstrate how this picture of electronic structure develops upon the admixture of electronic wavefunctions, in the spirit of coherent electronic transitions. We show that π–π* transitions correspond to double-bonding electrons oscillating along the bond axis, and n–π* transitions reveal lone-pairs vibrating out of plane. In butadiene and hexatriene, the double-bond oscillations combine with in- and out-of-phase combinations, revealing the correspondence between electronic transitions and molecular normal mode vibrations. This analysis allows electronic excitations to be described by building upon ground state electronic structures, without the need for molecular orbitals.
1 Introduction
The chemist's picture of electronic structure is highly adaptable. For depicting ground state structures, it is usual to draw one or more Lewis structures, where valence electrons are assigned to bonds, or lone pairs.1 The theoretical foundation of this picture is accounted for by valence bond theory, which is therefore more intuitive than the molecular orbital theory approach.2 However, the understanding of excited states of molecules is almost always within the framework of excitations of electrons within molecular orbitals (MOs). The MO approach is particularly prevalent in the description of conjugated systems, where the delocalized electronic orbitals are separated by their symmetry in π and σ representations.3For accurate calculations of excited states, for reasons of computational simplicity one is left with no choice but to take an approach based on molecular orbitals. However, as is well known, the calculated wavefunctions are invariant to the choice of orbitals, providing they span the same Hilbert space. Also, interpretations of electronic structure based on orbitals alone ignore the effect of (anti)symmetry: In many cases the S1 and T1 states are largely described by the same orbital occupancy, but have entirely different wavefunctions. Furthermore, interpreting the excited-state wavefunction can be problematic when the transition is described by a multitude of single and double (or higher) excitations from the reference wavefunction.4
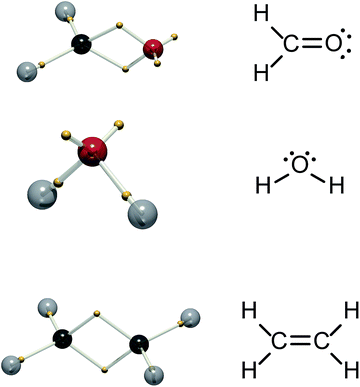
It is desirable to arrive at a simpler view of excited states based on accurately calculated and correctly antisymmetrised wavefunctions, ideally providing insight in an intuition-free manner. Recently, we reported a partitioning of the 3N-dimensional ground-state wavefunction into “tiles”.5 The equivalent tiles, which do not overlap, are themselves 3N-dimensional objects and are related by permutation of like-spin electrons. Each tile contains all the information of the entire wavefunction, since other tiles are merely repeats related by the interchange of electrons of the same spin: Tiles are positive or negative depending on the sign of the permutation. We and others demonstrated that if the boundaries between like-signed tiles are defined by a Voronoi diagram, with sites given by the centre-of-mass of the tile, the tiles reproduce Lewis structures of molecules and the double-quartet structures of Linnett.5–10 Further, by following the tiles as a function of a reaction coordinate, one obtains electron movements akin to the “curly arrows” beloved of organic chemists.11 Our procedure to obtain these structures is designated dynamic Voronoi Metropolis sampling (DVMS). Fig. 1 shows calculated DVMS structures for some simple molecules: only one spin is shown, since they are both equivalent in these closed-shell species. The DVMS structures exhibit core electrons, single-bonding electrons, double “banana”-bonding electrons and non-bonding lone-pairs, corresponding closely to the Lewis structures.9,10
The ground-state electronic wavefunction only contains nodes engendered by the antisymmetry required to satisfy Fermi–Dirac statistics. The tiles themselves are nodeless. Excited-state wavefunctions also obey Fermi–Dirac statistics, and thus will also exhibit tiling. However, they will exhibit more nodes, and/or different nodes to the ground state.12,13 The excited-state wavefunction can thus also be explored by the DVMS procedure, but with nodes within the tiles.
In this work, we present an approach to describing molecular electronic transitions inspired by the time-dependence of coherent electronic transitions. If the time-dependent Schrödinger equation is solved for a molecule subject to an oscillating electric field, the electronic wavefunction, originally in the ground state, will evolve such that after the perturbation it can be described by a sum over electronic states. If the angular frequency, ω, of the oscillating electric field is well matched to the energy difference between the ground and excited state (resonance condition, ħω ≈ Δε), then the resulting wavefunction will be an admixture of the ground and the excited state. This mixed state is time-dependent, and exhibits “quantum beats”.
Here we show that, within the ground state tile, the average electron positions can be plotted as a function of phase, ωt, for a wavefunction mixed between the ground and excited state of interest. The resulting electron motions reveal the connection between classical vibrational motion and electronic spectroscopy.
2 Methods
2.1 Formalism
Energy eigenstates are “stationary” in that the observables are time-independent. However, a state that is written as an admixture of one or more energy eigenstates evolves in time, exhibiting “quantum beats”. In order to maximize the magnitude of the quantum beats, we calculated the trajectory of the electron density for a maximally mixed wavefunction, | (1) |
The centroid of the tile (a 3N vector ![[x with combining macron]](https://www.rsc.org/images/entities/b_char_0078_0304.gif) ) evolves as
) evolves as
 | (2) |
 | (3) |
![[x with combining macron]](https://www.rsc.org/images/entities/b_char_0078_0304.gif) i and
i and ![[x with combining macron]](https://www.rsc.org/images/entities/b_char_0078_0304.gif) f are the position expectation values of Ψi and Ψf over the tile and
f are the position expectation values of Ψi and Ψf over the tile and  . The centroid thus oscillates about the average density centroids of the two states. The amplitude of this oscillation, xfi, may be partitioned in an analogous way to the DVMS centroid positions, as
 | (4) |
 | (5) |
As such, the oscillation direction and amplitude is directly related to the polarization and strength of the electronic transition.
2.2 Wavefunctions
All electronic wavefunctions were calculated using the FIREFLY program,14 which is largely based on the GAMESS package.15 Unless where stated, the 6-31G(d) basis was used. Ground and excited state wavefunctions were calculated at the CAS-CI level using ground state RHF orbitals, except in the case of ethylene.3 Results and discussion
The first excited state of ethylene, C2H4, has been the subject of controversy. The so-called V state is somewhat difficult to calculate, with large scale calculations settling on a vertical excitation energy of 7.88 eV, and a spatial extent with respect to the molecular plane of 〈ΨV|x2|ΨV〉 ≈ 18 − 20a02. Wu and co-workers obtained a vertical excitation energy of 8.01 eV and a spatial extent of 〈x2〉 = 19.14a02 with a compact valence bond wavefunction and a triple zeta basis set which included diffuse functions.16 Here we similarly adopt a polarized basis set with diffuse functions, and an active space of four orbitals spanning the symmetries of the carbon–carbon σ, π, π*, and σ* orbitals in the D2h point group. Calculated excited-state energies and second moments are given in Table 1 for the experimental geometry from ref. 16, exploring the effect of the treatment of electron correlation. CASSCF/TZV(2d,f;p)+ wavefunctions with a (4,4) active space were used for the DVMS analysis as an efficient means of accessing a wavefunction of comparable accuracy to the BOVB-5/aug-cc-pVTZ results of ref. 16.| N state | V state | T vert (eV) | |||
|---|---|---|---|---|---|
| E | 〈x2〉 | E | 〈x2〉 | ||
| a Units of hartree. b Units of a02, x is out-of-plane. c Ref. 16. | |||||
| TZV(2d,f;p) + RHF | −78.063860 | 12.06 | |||
| (2,2) CASSCF | −78.091437 | 11.71 | −77.782646 | 22.42 | 8.40 |
| (4,4) CASSCF | −78.117512 | 11.63 | −77.802123 | 19.96 | 8.58 |
| (4,4) MRPT2 | −78.391455 | — | −78.092863 | — | 8.12 |
| aug-cc-pVTZ BOVB-5c | −78.111200 | 11.64 | −77.816658 | 19.14 | 8.01 |
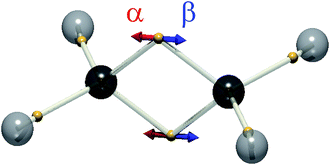
While we cannot say how the position of a particular electron evolves (they are all equivalent), DVMS allows us to inspect how the average position of each electron evolves in time from the perspective of a single wavefunction tile. In DVMS, the σ–π description of the double bond is replaced by a “banana bond” picture,17 with one electron of each spin lying above and below the bond axis (Fig. 1). Fig. 2 (left) depicts the trajectory of the tile centroid of ethylene as a function of phase, ωt. The α (up-spin) and β (down-spin) electrons have identical average positions, so only one spin-set is shown. Upon admixture of the N and V wavefunctions (S0 and S1 states), all four electron positions (2α and 2β) of the double bond execute oscillatory motion along the C![[double bond, length as m-dash]](https://www.rsc.org/images/entities/char_e001.gif) C axis. The core and C–H σ-bonding electrons are not significantly affected by the electronic transition, as intuitively expected. The excitation traditionally depicted π–π* corresponds to the “banana-bonding” electrons vibrating along the bond axis.
C axis. The core and C–H σ-bonding electrons are not significantly affected by the electronic transition, as intuitively expected. The excitation traditionally depicted π–π* corresponds to the “banana-bonding” electrons vibrating along the bond axis.
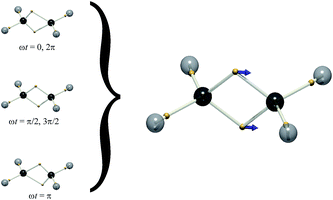 | ||
Fig. 2 Left: The DVMS tile centroid of ethylene as a function of phase, ωt (eqn (3)). The wavefunction is mixed between the ground ‘N’ state and excited ‘V’ state (eqn (1)). Only one spin-set is shown, since both spins move identically. Right: The electron positions for the mid-point of the vibration (gold spheres), ![[x with combining macron]](https://www.rsc.org/images/entities/b_char_0078_0304.gif) = ( = (![[x with combining macron]](https://www.rsc.org/images/entities/b_char_0078_0304.gif) i + i + ![[x with combining macron]](https://www.rsc.org/images/entities/b_char_0078_0304.gif) f)/2, and the displacement vector xfi (blue arrows). f)/2, and the displacement vector xfi (blue arrows). | ||
Since the motion of the centroid is described by an oscillation (eqn (3)), it may be illustrated by vectors indicating the motions of particular positions ({rj}, eqn (4)), as is routine for vibrational normal modes of molecules. This depiction is shown on the right of Fig. 2, succinctly representing the correlated motion of the banana-bonding electrons in the C![[double bond, length as m-dash]](https://www.rsc.org/images/entities/char_e001.gif) C bond in the N–V transition. With this connection made, it is interesting to explore how other vibrational modes might correspond to different excited states.
C bond in the N–V transition. With this connection made, it is interesting to explore how other vibrational modes might correspond to different excited states.
In the MO picture, the singlet and triplet states derived from the same π–π* excitation are crudely described by the same determinants, but with a change of sign:
 | (6) |
This is the case for many, if not most, chromophores. So, where the excited singlet (Fig. 2) has the α and β electrons vibrating in-phase, the (mS = 0) triplet state has the α and β electrons vibrating out-of-phase, thereby exhibiting no electronic transition dipole moment. The DVMS structure and displacement vector for the forbidden T1 ← S0 transition are shown in Fig. 3.
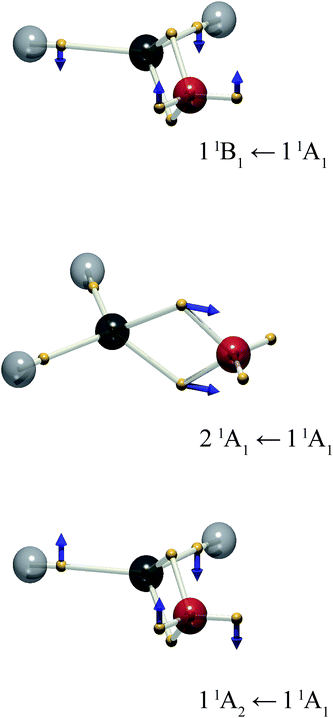
The present treatment may be extended to other chromophores. Formaldehyde is isoelectronic with ethylene, but exhibits a richer electronic spectrum on account of the involvement of the non-bonding, “lone pair” electrons. There are three low-lying excited states: π–π*, and two n–π* states.18 From the standpoint of the MO approach, the latter two can be considered excitations from symmetry-adapted combinations of lone pairs giving rise to a1 → b1 and b2 → b1 transitions to 1B1 and 1A2 excited states respectively. The latter is of considerable photophysical interest.19 The DVMS picture is shown in Fig. 4.
Rotation about the z-axis of formaldehyde transforms as the a2 representation in the C2v point group. Since the ground state is 1A1, the transition moment to the 11A2 state also transforms as a2 and the transition is electric-dipole forbidden, but magnetic-dipole allowed. The rotation of charge is evident in Fig. 4: the lone-pair electrons rotate out of plane. Surprisingly, at this level of theory ((6,4) CAS-CI) there is also considerable out-of-plane motion of the C–H bonding electrons.
The 21A1 ← 11A1 transition is analogous to the π–π* transition of ethylene, where the double-bonding electrons oscillate along the molecular symmetry axis. Finally, the 11B1 ← 11A1 transition is represented by oscillation of the lone-pair (and C–H bonding) electrons out of plane.
trans-Butadiene is normally drawn with two conjugated double bonds, and its DVMS structure bears this out. Like for ethylene, accurate calculations for excited states of trans-butadiene require attention to correlation and basis set.20–23 The present wavefunctions were calculated at the (4,4) CAS-CI/6-31G(d) level, and we do not expect accurate energies or state-ordering. However, for ethylene, the qualitative nature of the excitation was not found to be sensitive to the level of theory.
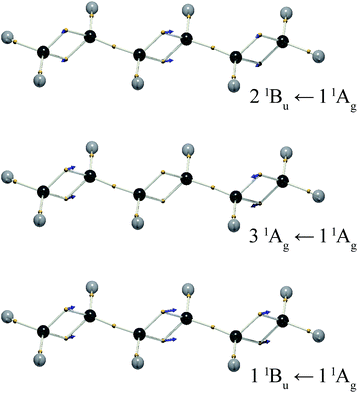
The two lowest excited states are 11Bu and 21Ag (C2h point group). The 21Ag state of trans-butadiene is dark, being described by two triplet configurations, one on each double bond.24–26 We do not investigate this state here, since it is not amenable to a treatment rooted in time-dependent quantum mechanics. The lowest bright excited state is 11Bu.
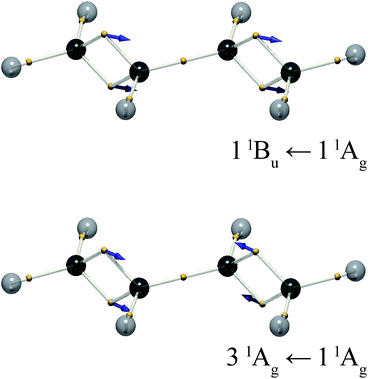
The DVMS picture of the electron vibration arising from the 11Bu wavefunction mixed with the 11Ag ground state is shown in Fig. 5. Here, eight electrons, four from each double bond, oscillate along the C![[double bond, length as m-dash]](https://www.rsc.org/images/entities/char_e001.gif) C bonds, all in-phase. Since the individual C
C bonds, all in-phase. Since the individual C![[double bond, length as m-dash]](https://www.rsc.org/images/entities/char_e001.gif) C bond transition dipoles add, the 11Bu ← 11Ag transition is seen to be strongly allowed.
C bond transition dipoles add, the 11Bu ← 11Ag transition is seen to be strongly allowed.
The question naturally beckons as to whether there is an excitation described by the out-of-phase excitation of the two double bonds. In trans-butadiene, such a transition would be forbidden, since the transition dipoles of the two double bonds cancel.
At the present level of theory this transition was found to be the 31Ag ← 11Ag transition. The corresponding electron vibration is illustrated in Fig. 5. It stands to reason that this state would lie higher in energy than the bright state, since its opposing dipoles lie end-to-end, analogous to a molecular exciton (J-aggregate).27 This is not the 21Ag ← 11Ag transition, as one might expect, because the 21Ag state is the dark triplet-pair state mentioned above. The exact nature of the 21Ag state is a subject of ongoing investigation.22,28
Like in trans-butadiene, the lowest excited state of trans,trans-hexatriene is described as a dark, doubly excited triplet pair.29 The next lowest-energy states calculated are 11Bu, 21Ag and 21Bu. The electron vibrations corresponding to excitations to these states from mixing CAS-CI wavefunctions are illustrated in Fig. 6. The lowest-energy bright state is 11Bu, and the electron vibration is the in-phase combination of double-bond oscillations. The length of the displacement vector xfi is larger for the central double bond, compared to the outer bonds.
The excitation to the 31Ag state is dipole forbidden, and the displacement vector shows the outer double bonds vibrating out-of-phase, such that the local dipoles cancel. The excitation to the 21Bu state is symmetry allowed, but the displacement vectors partially cancel. The vibration of the central bond is out of phase with those of the outer bonds.
The three states calculated for hexatriene are in keeping with the analogy between molecular vibrational modes and electronic transitions. Further, the magnitudes of the vectors are as intuitively expected. The out-of-phase vibration of the outer bonds for the transition to the 31Ag state necessitates a zero component for the central bond. The outer bonds make a correspondingly smaller contribution to the 1Bu states.
Extending the analogy of coupled oscillators to longer polyenes, it is expected they all exhibit a 1Bu state where the double-bonds oscillate in-phase, giving rise to a large transition dipole. As polyenes increase in length, the dipole–dipole coupling of each double-bond oscillation will lower the frequency of the resonance. The naturally occuring β-carotene has 11 conjugated double bonds, and a strong transition at 2.6 eV. For the polyenes, the 1Bu band converges to an energy near 2 eV for long chains (n ≳ 20).30
This picture of electronic transitions in conjugated systems can be extended to cyclic systems. Cyclic polyenes require special attention owing to the emergence of resonance structures. Indeed, in a forthcoming publication we will demonstrate that the most appropriate description of benzene is a superposition of Kekulé structures where α and β electrons are correlated: They occupy alternate Kekulé structures. In this picture, the in-phase vibration of the double bonds generates a cyclic motion of charge and therefore no net dipole. This corresponds to the transition to the 1B1u (S2) state. Transitions to the bright degenerate E1u states (S3) are described by vectors which have magnitudes given by cos![[thin space (1/6-em)]](https://www.rsc.org/images/entities/char_2009.gif) θ and sin
θ and sin![[thin space (1/6-em)]](https://www.rsc.org/images/entities/char_2009.gif) θ, where θ is the angle describing the position of the double bond on the ring. The S1 ← S0 transition is forbidden: The S1 state of benzene is related to S0 by a change in relative phase of the comprising (staggered-spin) Kekulé structures, and as such the tile centroids are unmoved.
θ, where θ is the angle describing the position of the double bond on the ring. The S1 ← S0 transition is forbidden: The S1 state of benzene is related to S0 by a change in relative phase of the comprising (staggered-spin) Kekulé structures, and as such the tile centroids are unmoved.
4 Conclusions
Using the dynamic Voronoi Metropolis sampling procedure (DVMS), we defined wavefunction tiles for a range of chromophores and showed that the centroids corresponded closely with the canonical Lewis structures. We investigated the centroid of the electron density in the tile for time-dependent wavefunctions mixed between the ground and various excited states and found that the centroid oscillates with an amplitude proportional to the transition dipole moment. For polyenes, where the DVMS describes the structure as isolated double “banana bonds”, it was found that transitions to various excited states may be described as the in- and out-of-phase vibrations of the individual double bonds. The most intense transition is characterized by an in-phase vibration of the double bonds. We anticipate that this method will allow a variety of electronic transitions to be interpreted in terms of electrodynamically-induced vibrations of the ground state electronic structure. Because this viewpoint does not require the invocation of molecular orbitals, it allows the essence of electronic spectroscopy to be described outside this paradigm.Conflicts of interest
There are no conflicts to declare.Acknowledgements
This work was supported by the Australian Research Council (Centre of Excellence in Exciton Science CE170100026).References
- G. N. Lewis, J. Am. Chem. Soc., 1916, 38, 4 Search PubMed.
- P. C. Hiberty and B. Braïda, Angew. Chem., Int. Ed., 2018, 57, 5994–6002 CrossRef CAS PubMed.
- E. Hückel, Z. Phys., 1931, 70, 204–286 CrossRef.
- G. D. O'Connor, G. V. G. Woodhouse, T. P. Troy and T. W. Schmidt, Mol. Phys., 2015, 113, 2138–2147 CrossRef.
- Y. Liu, T. J. Frankcombe and T. W. Schmidt, Phys. Chem. Chem. Phys., 2016, 18, 13385–13394 RSC.
- T. W. Schmidt, J. Mol. Struct.: THEOCHEM, 2004, 672, 191–200 CrossRef CAS.
- A. Lüchow and R. Petz, J. Comput. Chem., 2011, 32, 2619–2626 CrossRef PubMed.
- A. Lüchow and R. Petz, in Advances in Quantum Monte Carlo, ed. S. Tanaka, S. M. Rothstein and W. A. Lester Jr, American Chemical Society, 2012, vol. 1094, ch. 6, pp. 65–75 Search PubMed.
- J. W. Linnett, J. Am. Chem. Soc., 1961, 83, 2643–2653 CrossRef CAS.
- J. W. Linnett, The Electronic Structure of Molecules. A New Approach, Methuen & Co., Ltd., London, 1964 Search PubMed.
- Y. Liu, P. Kilby, T. J. Frankcombe and T. W. Schmidt, Nat. Commun., 2018, 9, 1436 CrossRef PubMed.
- P.-F. Loos and D. Bressanini, J. Chem. Phys., 2015, 142, 214112 CrossRef PubMed.
- D. Bressanini and P. J. Reynolds, Phys. Rev. E, 2011, 84, 046705 CrossRef PubMed.
- A. A. Granovsky, Firefly version 8.0.0, http://classic.chem.msu.su/gran/firefly/index.html Search PubMed.
- M. W. Schmidt, K. K. Baldridge, J. A. Boatz, S. T. Elbert, M. S. Gordon, J. H. Jensen, S. Koseki, N. Matsunaga, K. A. Nguyen, S. Su, T. L. Windus, M. Dupuis and J. A. Montgomery, J. Comput. Chem., 1993, 14, 1347–1363 CrossRef CAS.
- W. Wu, H. Zhang, B. Braïda, S. Shaik and P. C. Hiberty, Theor. Chem. Acc., 2014, 133, 1441 Search PubMed.
- L. Pauling, J. Am. Chem. Soc., 1931, 53, 1367–1400 CrossRef CAS.
- D. C. Moule and A. D. Walsh, Chem. Rev., 1975, 75, 67–84 CrossRef CAS.
- H. M. Yin, S. H. Kable, X. Zhang and J. M. Bowman, Science, 2006, 311, 1443–1446 CrossRef CAS PubMed.
- L. Serrano-Andrés, M. Merchán, I. Nebot-Gil, R. Lindh and B. O. Roos, J. Chem. Phys., 1993, 98, 3151–3162 CrossRef.
- M. A. Watson and G. K.-L. Chan, J. Chem. Theory Comput., 2012, 8, 4013–4018 CrossRef CAS PubMed.
- Y. Shu and D. G. Truhlar, J. Am. Chem. Soc., 2017, 139, 13770–13778 CrossRef CAS PubMed.
- E. J. Taffet and G. D. Scholes, Chem. Phys., 2018, 515, 757–776 CrossRef CAS.
- K. Schulten and M. Karplus, Chem. Phys. Lett., 1972, 14, 305–309 CrossRef CAS.
- T. H. Dunning, R. P. Hosteny and I. Shavitt, J. Am. Chem. Soc., 1973, 95, 5067–5068 CrossRef CAS.
- R. P. Hosteny, T. H. Dunning, R. R. Gilman, A. Pipano and I. Shavitt, J. Chem. Phys., 1975, 62, 4764–4779 CrossRef CAS.
- M. Kasha, H. R. Rawls and M. A. El-bayoumi, Pure Appl. Chem., 1965, 371–592 CAS.
- G. M. J. Barca, A. T. B. Gilbert and P. M. W. Gill, J. Chem. Theory Comput., 2018, 14, 9–13 CrossRef CAS PubMed.
- C. Woywod, W. C. Livingood and J. H. Frederick, J. Chem. Phys., 2000, 112, 613–625 CrossRef CAS.
- C. Sutton, Y. Yang, D. Zhang and W. Yang, J. Phys. Chem. Lett., 2018, 9, 4029–4036 CrossRef CAS PubMed.
| This journal is © The Royal Society of Chemistry 2019 |

