
 Open Access Article
 This Open Access Article is licensed under a Creative Commons Attribution-Non Commercial 3.0 Unported Licence
Stable and tunable plasmon resonance of molybdenum oxide nanosheets from the ultraviolet to the near-infrared region for ultrasensitive surface-enhanced Raman analysis†
Jinhu
Wang
a,
Yinhua
Yang
b,
Hua
Li
b,
Jun
Gao
c,
Ping
He
c,
Liang
Bian
d,
Faqin
Dong
d and
Yi
He
 *a
*a
aState Key Laboratory of Environment-friendly Energy Materials, Sichuan Co-Innovation Center for New Energetic Materials, Southwest University of Science and Technology, Mianyang 621010, P. R. China. E-mail: yhe2014@126.com
bMaterials Characterization & Preparation Center, Southern University of Science and Technology, Shenzhen 518055, China
cSchool of Materials Science and Engineering, Southwest University of Science and Technology, Mianyang, 621010, P. R. China
dKey Laboratory of Solid Waste Treatment and Resource Recycle, Ministry of Education, State Key Laboratory Cultivation Base for Nonmetal Composites and Functional Materials, Southwest University of Science and Technology, Mianyang 621010, Sichuan, China
First published on 23rd May 2019
Abstract
Preparation of color-tunable and stable plasmonic MoO3 nanomaterials remains challenging, due to the lack of an effective preparation strategy and surface protection in heavily doped MoO3. Herein, we report a facile and reliable method for synthesis of oxygen-deficient MoO3 (MoO3−x) nanosheets using dopamine as the reducing agent and precursor for the formation of a polydopamine (PDA) surface coating. The PDA-coated MoO3−x nanosheets show stable and tunable localized surface plasmon resonance (LSPR) from the ultraviolet to the near-infrared region (361–809 nm) via altering the pH value of the medium, accompanying the generation of multicolor nanosheet dispersions, such as deep blue, faint bluish, orange, yellow and black. Importantly, the resulting PDA-coated MoO3−x nanosheets are quite stable even in the presence of oxidants, and they can be used as an ultrasensitive surface-enhanced Raman scattering (SERS) substrate. The limit of detection for rhodamine 6G (R6G) dye is down to 0.3 fM concentration, and the corresponding Raman enhancement factor reaches 1 × 10¹⁰. The coupling of charge transfer between R6G and PDA-coated MoO3−x nanosheets and molecular resonances may be responsible for the strong SERS effect.
Introduction
Plasmonic nanomaterials with distinct localized surface plasmon resonance (LSPR) features have been widely studied in the past decade owing to their promising applications in chemical sensing, catalysis, molecular imaging, optical waveguides, color displays, CO2 reduction, and N2 fixation.1–8 Conventional plasmonic nanomaterials are based on noble metals because they have stable properties and high carrier density.9,10 Additionally, the LSPR of noble metals is tunable from the visible to the near-infrared range through shape, size, and composition control.11 On the other hand, the LSPR property is also discovered in doped metal oxide semiconductor nanocrystals such as tin oxide, molybdenum oxide (MoO3), cadmium oxide, titanium dioxide, tungsten oxide, and zinc oxide.12–26As an important semiconductor material, MoO3 shows strong LSPR absorption after introduction of oxygen vacancies, aliovalent ions, and hydrogen ions,27 which induces a notable color change. Although there are some methods for preparation of plasmonic MoO3 nanomaterials, including MoO3−x, H1.68MoO3, H0.9MoO3 and H0.3MoO3,16,28–30 most of them involve harsh reaction conditions (high temperature and pressure). Generally, the reported plasmonic MoO3 nanomaterials have blue color, and other colors are rarely obtained because of the lack of valid approaches to regulate their LSPRs. Moreover, the resulting plasmonic MoO3 nanomaterials are quite unstable, which are sensitive to oxidants and can be easily oxidized,18,28,31,32 leading to the disappearance of LSPR as the charge carrier density after oxidation is below the threshold to provide LSPR. Therefore, development of mild, facile, and reliable methods for preparation of stable plasmonic MoO3 nanomaterials with tunable color and LSPR properties is an urgent demand.
Here we report a facile and reliable strategy for the synthesis of oxygen-deficient MoO3 (MoO3−x) nanosheets using the dopamine serving as both the reductant and precursor for the formation of a polydopamine (PDA) surface coating (Scheme 1). The resulting PDA-coated MoO3−x nanosheets afford strong LSPR absorption, and their LSPR peaks are tuned from the ultraviolet to the near-infrared region (361–809 nm) by altering the pH value of the medium, accompanying the production of variable colors (deep blue, faint bluish, orange, yellow and black). In addition, the stability of MoO3−x nanosheets is studied in the presence of several oxidants. Furthermore, the plasmonic MoO3−x nanosheets are employed as ultrasensitive surface-enhanced Raman scattering (SERS) substrates at femtomolar levels as well.
 | ||
| Scheme 1 Schematic illustration of the formation of multicolor PDA-coated MoO3−x nanosheets with tunable plasmon resonance. | ||
Results and discussion
Structure analysis of PDA-coated MoO3−x nanosheets
The PDA-coated MoO3−x nanosheets are synthesized by a redox reaction between MoO3 nanosheets and dopamine. Fig. 1a shows the transmission electron microscopy (TEM) image of MoO3−x nanosheets, revealing a sheet morphology, and some large MoO3−x nanosheets have a wrinkled surface, which has also been observed in other two-dimensional nanomaterials such as graphene oxide.33 From the high-resolution transmission electron microscopy (HRTEM) image of MoO3−x nanosheets (Fig. 1b), it can be found that the nanosheets possess a double-layer structure, which corresponds to a dark MoO3−x core and a PDA coating with a lower contrast surrounding the core. Conversely, there is no double-layer structure in pristine MoO3 nanosheets (Fig. S1†). To identify the elemental compositions of nanosheets and distribution of various elements, scanning transmission electron microscopy (STEM) and energy dispersive spectroscopy (EDS) mapping are conducted as shown in Fig. 1c. The resulting STEM image gives information regarding the generation of PDA-coated MoO3−x nanosheets with the presence of a PDA shell. The EDS mapping confirms that Mo, O, and N elements are uniformly distributed throughout the nanosheets, in which the N element originates from the PDA molecule.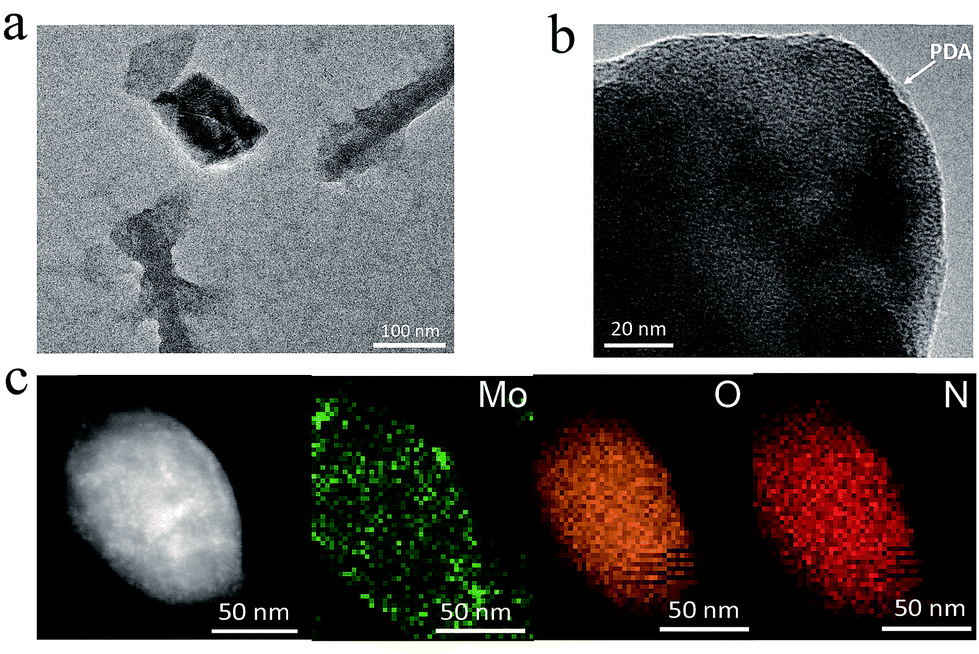 | ||
| Fig. 1 Two-dimensional morphology of PDA-coated MoO3−x nanosheets. (a) TEM, (b) HRTEM, and (c) STEM images and EDS elemental mapping profiles of PDA-coated MoO3−x nanosheets. | ||
Characteristic infrared absorption bands of PDA-coated MoO3−x nanosheets are shown in Fig. 2a, which are similar to that of pure PDA that is prepared by auto-oxidation of dopamine at pH 8.5 and distinctly different from that of dopamine (Fig. S2 and S3†), confirming the presence of PDA on the surface of MoO3−x nanosheets. The three absorption bands located at 3375 cm−1, 2916 cm−1, and 1734 cm−1 are attributed to the N–H, C–H, and C![[double bond, length as m-dash]](https://www.rsc.org/images/entities/char_e001.gif) O stretching vibrations of PDA. The peaks appearing at 1628 cm−1, 1478 cm−1, and 1247 cm−1 are ascribed to the benzene skeleton vibration of PDA. Also, the characteristic peaks of MoO3−x at 956 cm−1 (Mo–O stretching) and 870 cm−1 (Mo–O–Mo bridge stretching) are observed (Fig. 2a and S4†). The amount of PDA in the nanosheets is measured to be 7.3% by thermogravimetric analysis (TGA) as illustrated in Fig. S5.† The surface composition of PDA-coated MoO3−x nanosheets is investigated using X-ray photoelectron spectra (XPS). The XPS signals of Mo, C, N and O elements are obtained (Fig. 2b), and the high-resolution spectra of the C 1s in Fig. 2c can be fitted with four peaks, which are assigned to C–H, C–N, C–C, and C–O species that demonstrate the presence of PDA (Fig. 2c).
O stretching vibrations of PDA. The peaks appearing at 1628 cm−1, 1478 cm−1, and 1247 cm−1 are ascribed to the benzene skeleton vibration of PDA. Also, the characteristic peaks of MoO3−x at 956 cm−1 (Mo–O stretching) and 870 cm−1 (Mo–O–Mo bridge stretching) are observed (Fig. 2a and S4†). The amount of PDA in the nanosheets is measured to be 7.3% by thermogravimetric analysis (TGA) as illustrated in Fig. S5.† The surface composition of PDA-coated MoO3−x nanosheets is investigated using X-ray photoelectron spectra (XPS). The XPS signals of Mo, C, N and O elements are obtained (Fig. 2b), and the high-resolution spectra of the C 1s in Fig. 2c can be fitted with four peaks, which are assigned to C–H, C–N, C–C, and C–O species that demonstrate the presence of PDA (Fig. 2c).
 | ||
| Fig. 2 Characterization of PDA-coated MoO3−x nanosheets. (a) FT-IR spectrum and (b) survey XPS spectra of PDA-coated MoO3−x nanosheets. (c) High-resolution XPS of C 1s of PDA and (d) Mo 3d of PDA-coated MoO3−x nanosheets. (e) XRD patterns and (f) EPR spectra of MoO3 and PDA-coated MoO3−x nanosheets. | ||
In addition, the oxidation state of Mo is characterized by XPS as well. In contrast to the XPS spectra of MoO3 (Fig. S6†), the PDA-coated MoO3−x nanosheets include a certain amount of Mo5+ (Fig. 2d), suggesting that the Mo6+ is partially reduced to yield Mo5+, accompanying the removal of oxygen atoms with the assistance of hydrogen ions for the generation of water and oxygen vacancies. The crystal structure of blue PDA-coated MoO3−x nanosheets is further studied. From the X-ray powder diffraction (XRD) patterns in Fig. 2e it can be seen that both MoO3−x and MoO3 nanosheets display a broad peak in the range of 15–35°, which can be indexed to the (040) plane of a-MoO3 (JCPDS no. 05-0508). Compared with MoO3 nanosheets, the peak position of blue PDA-coated MoO3−x nanosheets moves to a lower angle, implying the expansion of the van der Waals gap in the oxygen-deficient MoO3−x nanosheets. The existence of oxygen vacancies leaves unpaired electrons on the surface of MoO3−x nanosheets, which are capable of being resolved by electron paramagnetic resonance (EPR) spectra. As indicated in Fig. 2f, no direct EPR signal is found in the MoO3 nanosheets, while the PDA-coated MoO3−x nanosheets exhibit a strong EPR signal (g = 1.94), which provides direct evidence for the existence of unsaturated Mo species and oxygen vacancies.
Tunable LSPR of MoO3−x nanosheets from the ultraviolet to the near-infrared region
The optical properties of the PDA-coated MoO3−x nanosheets are examined by UV-Vis-NIR spectroscopy. Fig. 3a shows the UV-Vis-NIR spectra and the corresponding photographs of MoO3 nanosheet and PDA-coated MoO3−x nanosheet dispersions. The MoO3 nanosheet dispersion is colorless, and it does not exhibit any absorption band in the wavelength region from 400 nm to 900 nm. However, the blue PDA-coated MoO3−x nanosheet dispersion has an absorption peak at 809 nm. The red shift of the observed peak takes place when the solvent refractive index is increased, and a linear relationship between absorption peaks and solvent refractive index is achieved (Fig. 3b and S7†), testifying that this absorption peak is attributed to the LSPR.34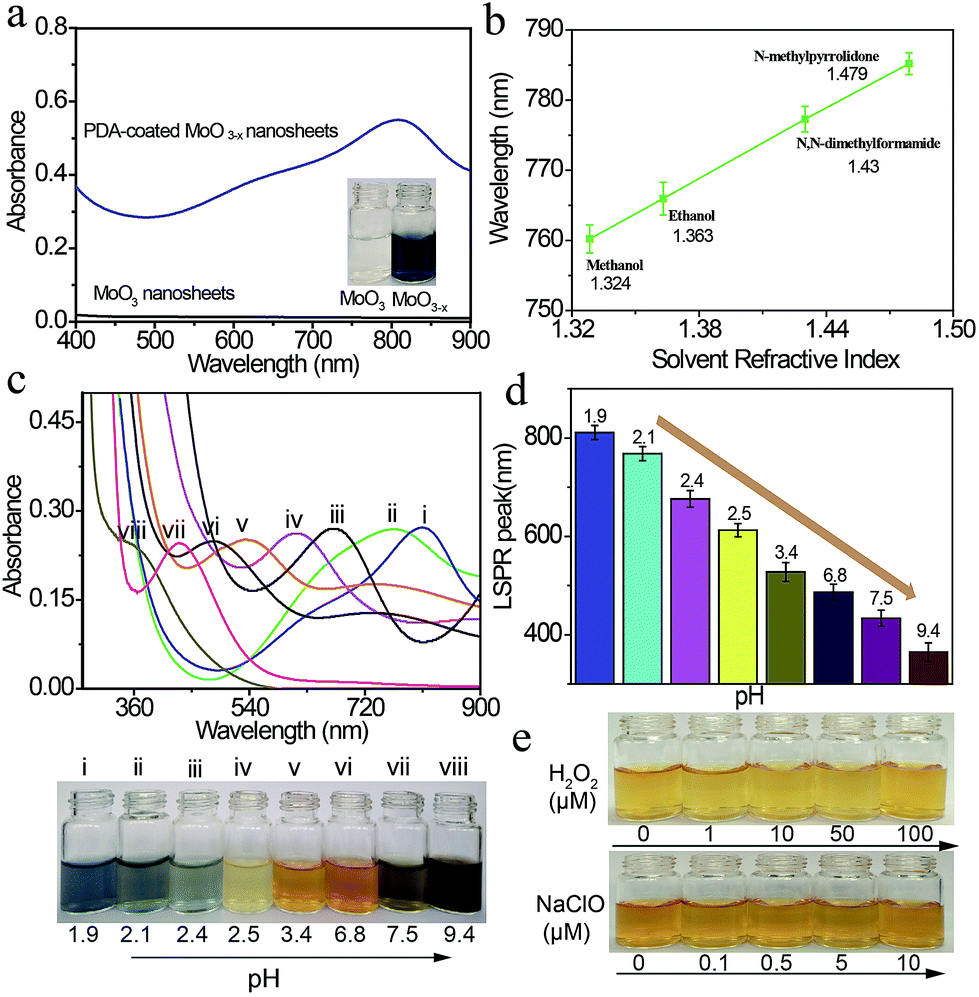 | ||
| Fig. 3 Tunability of the plasmon resonance of PDA-coated MoO3−x nanosheets. (a) UV-Vis-NIR spectra of MoO3 and PDA-coated MoO3−x nanosheet dispersions. (b) LSPR peaks of the MoO3−x nanosheet dispersion as a function of the solvent refractive index. (c and d) Dependence of UV-Vis-NIR spectra, and the corresponding photographs and LSPR peaks on the pH value of the reaction solution. (e) Photographs of a yellow MoO3−x nanosheet dispersion in the absence and presence of H2O2 and NaClO with different concentrations. | ||
The LSPR absorption band of PDA-coated MoO3−x nanosheets can be readily tuned by altering the pH values of the reaction solution. The reduction capacity of dopamine increases with the increase of the pH value (Fig. S8†), which can induce the formation of more oxygen vacancies and therefore results in higher free-electron densities. As depicted in Fig. 3c and d, the LSPR peak of PDA-coated MoO3−x nanosheets undergoes a gradual blue shift from the NIR to the UV region (809 nm to 361 nm) as the pH value increases from 1.9 to 9.4. Correspondingly, the percentage concentration of Mo5+ determined by XPS increases from 42.86% to 59.94% (Fig. S9†), and there is no phase change when the LSPR peak of PDA-coated MoO3−x shifts from 809 nm to 361 nm that is supported by TEM, XRD and ESR (Fig. S10–S12†). Interestingly, the blue shift of the LSPR peak creates a series of multicolor dispersions, including deep blue, faint bluish, orange, yellow and black. The LSPR peak shift spans as much as 448 nm, which has not been realized in reported plasmonic doped metal oxide nanomaterials and challenges traditional noble metal nanocrystals as well. The blue shift is due to the higher free-electron densities based on the Drude model,16 and the highest charge carrier density is determined to be 1.32 × 1021 cm−3 in the yellow MoO3−x nanosheets (Fig. S13†). The chemical stability of the plasmonic PDA-coated MoO3−x nanosheets is also evaluated. Because the oxygen vacancies have great affinity for oxygen molecules, the MoO3−x nanosheets without a surface coating are trivially easy to be oxidized, causing the disappearance of LSPR thanks to the decrease of free-electron densities. The MoO3−x nanosheets prepared using other reducing agents such as sodium borohydride, ascorbic acid and glutathione become colorless in the presence of oxidants (H2O2 and NaClO), revealing that they are not stable (Fig. S14 and S15†). In contrast, the color of the PDA-coated MoO3−x nanosheet dispersion still remains even if a high concentration of H2O2 and NaClO is introduced as shown in Fig. 3e, affirming the strong resistance of PDA-coated MoO3−x nanosheets to oxidation. This good stability is ascribable to the PDA surface coating that prevents the contact between MoO3−x and oxidation reagents and consumes oxidation species because of the existence of reducing hydroxyl groups in the molecular structure of PDA.
SERS properties of MoO3−x nanosheets and the enhancement mechanism
Next, in order to explore the sensing application of PDA-coated MoO3−x nanosheets, the SERS performance of MoO3−x nanosheets is estimated by using R6G as a model analyte. The R6G solution (10−7 M) is mixed with blue PDA-coated MoO3−x nanosheets and dried in air. Fig. 4a shows the Raman spectra of R6G on glass and blue MoO3−x nanosheet substrates. Under 514.5 nm laser light excitation, the four prominent characteristic scattering peaks of R6G at 612 cm−1 (R1), 773 cm−1 (R2), 1363 cm−1 (R3), and 1652 cm−1 (R4) can be discerned clearly on the blue MoO3−x nanosheet substrate, whereas no detectable Raman signal is obtained on the glass substrate. These results illustrate that the blue PDA-coated MoO3−x nanosheets are able to greatly enhance the Raman signal. To estimate the sensitivity of the SERS-active MoO3−x nanosheets, a set of R6G solutions with varying concentrations down to 1 fM are prepared and tested as shown in Fig. 4b. The R2 fingerprint Raman band of R6G is still detectable at an ultralow concentration of 1 fM. The corresponding calibration curve for detection of R6G in the range of 10 μM to 1 fM is plotted as shown in Fig. 4c. The limit of detection is calculated to be 0.3 fM based on 3σ/slope (σ is the standard deviation of the blank, and the slope can be obtained from the calibration curve). This sensitivity is eight orders of magnitude superior to that of the MoO2 and MoSxOy-based SERS substrates for detection of R6G,35,36 and it is comparable to or better than that of noble metal nanomaterial-based SERS substrates.37 What's more, the Raman enhancement factor (EF) reaches 1 × 10¹⁰ at an R6G concentration of 10 pM. Meanwhile, several time-dependent consecutive peaks of R6G are also collected as shown in Fig. S16.† It can be seen that the characteristic peak of R6G (R2) at 1 fM is clearly visible after irradiation with a laser for 1.5 min, proving the acceptable reproducibility. | ||
| Fig. 4 SERS effects on the MoO3−x nanosheets. (a) Raman spectra of R6G (10−7 M) on the glass and blue MoO3−x nanosheet substrates. (b) SERS spectra of R6G adsorbed on the surface of blue MoO3−x nanosheets with different concentrations in the range of 1 fM to 10 μM. (c) The calibration curve for detection of R6G. (d) Comparison of the SERS effects of yellow and blue MoO3−x nanosheets. (e) UV-Vis-NIR spectra of the blue MoO3 nanosheet dispersion and R6G solution. (f) Energy-level diagram and charge transfer transitions. μex and μmol denote the electron excitation and molecular transition. μPICT denotes the charge transfer transitions. | ||
To understand the SERS mechanism, we compare the enhancement performance of yellow and blue PDA-coated MoO3−x nanosheets (Fig. 4d). The results show that the yellow MoO3−x nanosheets with high charge carrier density cannot boost the Raman signal. Likewise, the LSPR peak of blue PDA-coated MoO3−x nanosheets does not overlap the absorption spectrum of R6G well as shown in Fig. 4e. On the basis of these results, the LSPR-induced electromagnetic enhancement mechanism is excluded. Alternatively, it has been reported that the chemical mechanism owing to the charge transfer between the SERS substrate and probe molecules is responsible for the semiconductor SERS effect.35,38,39 The two vibronically coupled lines at 612 cm−1 and 773 cm−1 are highly enhanced as depicted in Fig. 4a, suggesting that the charge transfer is a key factor for the SERS effect. More importantly, the energy levels of blue PDA-coated MoO3−x nanosheets are determined by an electrochemical method using ferrocene as an internal standard (Fig. S17 and S18†). The calculated valence band (VB) and conduction band (CB) are −5.86 eV and −2.54 eV, respectively (Fig. 4f). Simultaneously, the lowest unoccupied molecular orbital (LUMO) and highest occupied molecular orbital (HOMO) levels of R6G are −3.4 eV and −5.7 eV.35 Consequently, there are two types of possible photo-induced charge transfer (PICT) processes from the VB to the LUMO at 2.46 eV and from the HOMO to the CB at 3.16 eV (Fig. 4f). The charge-transfer transition between the VB and the LUMO is near the laser light wavelength (514.5 nm, 2.41 eV), which triggers charge transfer resonances. Apart from the charge transfer resonances, the molecular resonance at 514.5 nm laser light excitation overlaps the absorption cross section of R6G as well. In general, the charge transfer resonance is supposed to be greatly enhanced as it coupled with molecular resonance.38 Accordingly, the strong SERS effect of PDA-coated MoO3−x nanosheets may originate from the coupling of charge transfer and molecular resonances.
Conclusions
In summary, we have developed a simple and reliable synthetic approach for preparation of plasmonic PDA-coated MoO3−x nanosheets. The LSPR peak of the PDA-coated MoO3−x nanosheets is controlled from 809 nm to 361 nm by changing the pH values of the reaction system. It is found that the formation of a PDA coating on the surface of MoO3−x nanosheets is critical for the stability of the plasmonic properties. Remarkably, the present MoO3−x nanosheets serve as a high-performance SERS substrate, which can be used for detection of Raman dyes at an fM level, and the EF value is as high as 1 × 10¹⁰. The outstanding SERS effect of PDA-coated MoO3−x nanosheets may arise from the coupling of charge transfer and molecular resonances. The current work is the first example of well-defined LSPR-tunable MoO3−x nanosheets from the NIR to the UV region. The strategy and results offer a new avenue for preparation of plasmonic MoO3−x nanosheets with good stability which have vast application prospects, including ultrasensitive detection, catalysis, light harvesting, and imaging.Experimental section
Materials
MoO3−x powers were purchased from Chron Chemicals. Dopamine, rhodamine 6G, ascorbic acid, ferrocene, sodium sulfide, glutathione, N,N-dimethylformamide, N-methylpyrrolidone, sodium hydroxide, and hydrochloric acid were obtained from Aladdin Chemical Reagent Co. Ltd. Ethanol, methanol, isopropanol, ethylene glycol, and other chemicals were purchased from Sinopharm Chemical Reagent Co. Ltd.Synthesis of MoO3 nanosheets
The MoO3−x nanosheets are synthesized by a reported method with a slight modification.18,40 Briefly, 0.4 g MoO3−x powder is ground for 1 h. Then, the resulting powder is dispersed in an ethanol/deionized (DI) water mixture (26.4 mL ethanol and 23.6 mL deionized water) by ultra-sonication for 2 h (100 W), followed by centrifugation at 8000 rpm for 30 min at atmospheric temperature. The supernatant containing two-dimensional MoO3−x nanosheets (3 mg mL−1) is collected.Synthesis of multicolor plasmonic MoO3−x nanosheets
The blue MoO3−x nanosheets are firstly synthesized. In a typical synthesis, 0.8 mL dopamine solution (4 mg mL−1) is added to 4 mL MoO3−x nanosheet dispersion (3 mg mL−1). Next, 0.6 mL 3 M HCl solution is injected into the above mixture and heated for 8 h in a water bath at 95 °C. For the synthesis of plasmonic MoO3−x nanosheets with other colors, different volumes of NaOH solution (1 mM) are used to adjust the pH values of the blue MoO3−x nanosheet dispersion. The MoO3−x nanosheet dispersions with different LSPR peaks at 809 nm, 768 nm, 674 nm, 613 nm, 534 nm, 485 nm, 432 nm, and 361 nm can be obtained using different pH values, during which different colors are produced.Characterization
TEM and HRTEM were carried out on a FEI TECNAI G2 F20 microscope. XRD patterns were obtained on a D/MAX-IIIA X-ray diffractometer. UV-Vis-NIR absorption spectra were collected using a Shimadzu UV-1800 spectrometer. XPS was performed with an ESCALAB 250 photoelectron spectrometer. EPR spectra were obtained using a Bruker I200 spectrometer. The electrochemical measurements were performed using a CHI660C workstation. Fourier transform infrared spectra (FTIR) were obtained on a TENSOR spectrometer. TGA was performed on a TA Discovery thermal analysis system.Surface-enhanced Raman scattering tests
To examine the Raman enhancement effect of MoO3−x nanosheets, R6G is dissolved in DI water as the model molecule to prepare a series of standard R6G solutions with concentrations ranging from 1 fM to 10 μM. The MoO3−x nanosheet dispersion (0.57 mg mL−1) is mixed with the standard R6G solutions for 30 min and dried at room temperature. Subsequently, Raman spectra are collected, and the excitation wavelength of the laser is 514.5 nm. The average density of R6G on the surface is calculated to be 3 × 10¹⁶ molecules per cm2.Conflicts of interest
The authors declare no conflict of interest.Acknowledgements
We gratefully acknowledge the financial support from the National Natural Science Foundation of China (Grant No. 2170513, 441872039, and 41831285) and Longshan Academic Talent Research Supporting Program of SWUST (Grant No. 18LZX204 and 17LZX449).Notes and references
- J. R. Mejia-Salazar and O. N. Oliveira Jr, Chem. Rev., 2018, 118, 10617–10625 CrossRef CAS.
- P. Christopher, H. Xin and S. Linic, Nat. Chem., 2011, 3, 467–472 CrossRef CAS.
- Y. Fang, W. Wang, X. Wo, Y. Luo, S. Yin, Y. Wang, X. Shan and N. Tao, J. Am. Chem. Soc., 2014, 136, 12584–12587 CrossRef CAS PubMed.
- R. F. Oulton, V. J. Sorger, D. A. Genov, D. F. P. Pile and X. Zhang, Nat. Photonics, 2008, 2, 496–500 CrossRef CAS.
- Y. He, B. Xu, W. Li and H. Yu, J. Agric. Food Chem., 2015, 63, 2930–2934 CrossRef CAS PubMed.
- J. Yang, Y. Guo, W. Lu, R. Jiang and J. Wang, Adv. Mater., 2018, 30, 1802227 CrossRef PubMed.
- J. Olson, A. Manjavacas, L. Liu, W. S. Chang, B. Foerster, N. S. King, M. W. Knight, P. Nordlander, N. J. Halas and S. Link, Proc. Natl. Acad. Sci. U. S. A., 2014, 111, 14348–14353 CrossRef CAS PubMed.
- K. Kumar, H. Duan, R. S. Hegde, S. C. W. Koh, J. N. Wei and J. K. W. Yang, Nat. Nanotechnol., 2012, 7, 557–561 CrossRef CAS PubMed.
- A. Liu, G. Wang, F. Wang and Y. Zhang, Coord. Chem. Rev., 2017, 336, 28–42 CrossRef CAS.
- H. Chen, L. Shao, Q. Li and J. Wang, Chem. Soc. Rev., 2013, 42, 2679–2724 RSC.
- L. Zhang, K. Xia, Z. Lu, G. Li, J. Chen, Y. Deng, S. Li, F. Zhou and N. He, Chem. Mater., 2014, 26, 1794–1798 CrossRef CAS.
- X. Liu, H. Kang, H. Yuan, J. Park, S. J. Kim, Y. Cui, H. Y. Hwang and M. L. Brongersma, Nat. Nanotechnol., 2017, 12, 866 CrossRef CAS PubMed.
- P. Guo, R. D. Schaller, J. B. Ketterson and R. P. H. Chang, Nat. Photonics, 2016, 10, 267 CrossRef CAS.
- Y. Yang, Y. Yang, S. Chen, Q. Lu, L. Song, Y. Wei and X. Wang, Nat. Commun., 2017, 8, 1559 CrossRef PubMed.
- M. Kanehara, H. Koike, T. Yoshinaga and T. Teranishi, J. Am. Chem. Soc., 2009, 131, 17736–17737 CrossRef CAS PubMed.
- H. Cheng, M. Wen, X. Ma, Y. Kuwahara, K. Mori, Y. Dai, B. Huang and H. Yamashita, J. Am. Chem. Soc., 2016, 138, 9316–9324 CrossRef CAS PubMed.
- W. Huang, J. Wang, J. Du, Y. Deng and Y. He, Microchim. Acta, 2019, 186, 79 CrossRef PubMed.
- M. Li, X. Huang and H. Yu, Mater. Sci. Eng., C, 2019, 101, 614–618 CrossRef CAS.
- Y. Yue and Y. He, Anal. Sci., 2019, 35, 159–163 CrossRef CAS PubMed.
- J. Du, M. Zhao, W. Huang, Y. Deng and Y. He, Anal. Bioanal. Chem., 2018, 410, 4519–4526 CrossRef CAS PubMed.
- Y. Yang, K. Kelley, E. Sachet, S. Campione, T. S. Luk, J. P. Maria, M. B. Sinclair and I. Brener, Nat. Photonics, 2017, 11, 390 CrossRef CAS.
- E. Sachet, C. T. Shelton, J. S. Harris, B. E. Gaddy, D. L. Irving, S. Curtarolo, B. F. Donovan, P. E. Hopkins, P. A. Sharma, A. L. Sharma, J. Ihlefeld, S. Franzen and J. P. Maria, Nat. Mater., 2015, 14, 414–420 CrossRef CAS.
- T. R. Gordon, M. Cargnello, T. Paik, F. Mangolini, R. T. Weber, P. Fornasiero and C. B. Murray, J. Am. Chem. Soc., 2012, 134, 6751–6761 CrossRef CAS PubMed.
- K. Manthiram and A. P. Alivisatos, J. Am. Chem. Soc., 2012, 134, 3995–3998 CrossRef CAS PubMed.
- C. N. Valdez, A. M. Schimpf, D. R. Gamelin and J. M. Mayer, J. Am. Chem. Soc., 2016, 138, 1377–1385 CrossRef CAS.
- X. Zhang, M. He, P. He, C. Li, H. Liu, X. Zhang and Y. Ma, Appl. Surf. Sci., 2018, 433, 419–427 CrossRef CAS.
- M. M. Y. A. Alsaif, K. Latham, M. R. Field, D. D. Yao, N. V. Medhekar, G. A. Beane, R. B. Kaner, S. P. Russo, J. Z. Ou and K. Kalantar-zadeh, Adv. Mater., 2014, 26, 3931–3937 CrossRef CAS.
- H. Cheng, X. Qian, Y. Kuwahara, K. Mori and H. Yamashita, Adv. Mater., 2015, 27, 4616–4621 CrossRef CAS PubMed.
- H. S. Kim, J. B. Cook, H. Lin, J. S. Ko, S. H. Tolbert, V. Ozolins and B. Dunn, Nat. Mater., 2017, 16, 454 CrossRef CAS PubMed.
- W. Liu, Q. Xu, W. Cui, C. Zhu and Y. Qi, Angew. Chem., Int. Ed., 2017, 56, 1600–1604 CrossRef CAS PubMed.
- B. Y. Zhang, A. Zavabeti, A. F. Chrimes, F. Haque, L. A. O'Dell, H. Khan, N. Syed, R. Datta, Y. Wang, A. S. R. Chesman, T. Daeneke, K. Kalantar-zadeh and J. Z. Ou, Adv. Funct. Mater., 2018, 28, 1706006 CrossRef.
- G. Song, J. Hao, C. Liang, T. Liu, M. Gao, L. Cheng, J. Hu and Z. Liu, Angew. Chem., Int. Ed., 2016, 55, 2122–2126 CrossRef CAS.
- O. C. Compton, S. Kim, C. Pierre, J. M. Torkelson and S. T. Nguyen, Adv. Mater., 2010, 22, 4759–4763 CrossRef CAS PubMed.
- S. H. Lee, H. Nishi and T. Tatsuma, Chem. Commun., 2017, 53, 12680–12683 RSC.
- Z. Zheng, S. Cong, W. Gong, J. Xuan, G. Li, W. Lu, F. Geng and Z. Zhao, Nat. Commun., 2017, 8, 1993 CrossRef PubMed.
- Q. Zhang, X. Li, W. Yi, W. Li, H. Bai, J. Liu and G. Xi, Anal. Chem., 2017, 89, 11765–11771 CrossRef CAS PubMed.
- D. K. Lim, K. S. Jeon, J. H. Hwang, H. Kim, S. Kwon, Y. D. Suh and J. M. Nam, Nat. Nanotechnol., 2011, 6, 452–460 CrossRef CAS PubMed.
- L. Tao, K. Chen, Z. Chen, C. Cong, C. Qiu, J. Chen, X. Wang, H. Chen, T. Yu, W. Xie, S. Deng and J. Xu, J. Am. Chem. Soc., 2018, 140, 8696–8704 CrossRef CAS PubMed.
- Q. Zhang, X. Li, Q. Ma, Q. Zhang, H. Bai, W. Yi, J. Liu, J. Han and G. Xi, Nat. Commun., 2017, 8, 14903 CrossRef.
- M. M. Y. A. Alsaif, K. Latham, M. R. Field, D. D. Yao, N. V. Medehkar, G. A. Beane, R. B. Kaner, S. P. Russo, J. Z. Ou and K. Kalantar-zadeh, Adv. Mater., 2014, 26, 3931–3937 CrossRef CAS PubMed.
Footnote |
| † Electronic supplementary information (ESI) available. See DOI: 10.1039/c9sc02202c |
| This journal is © The Royal Society of Chemistry 2019 |