
 Open Access Article
 This Open Access Article is licensed under a Creative Commons Attribution-Non Commercial 3.0 Unported Licence
Establishing lignin structure-upgradeability relationships using quantitative 1H–13C heteronuclear single quantum coherence nuclear magnetic resonance (HSQC-NMR) spectroscopy†
Masoud
Talebi Amiri
 ,
Stefania
Bertella
,
Ydna M.
Questell-Santiago
and
Jeremy S.
Luterbacher
*
,
Stefania
Bertella
,
Ydna M.
Questell-Santiago
and
Jeremy S.
Luterbacher
*
Laboratory of Sustainable and Catalytic Processing, Institute of Chemical Sciences and Engineering, École polytechnique fédérale de Lausanne (EPFL), CH-1015 Lausanne, Switzerland. E-mail: jeremy.luterbacher@epfl.ch
First published on 15th July 2019
Abstract
Lignin depolymerization could provide an attractive renewable aromatic feedstock for the chemical industry. Past studies have suggested that lignin structural features such as ether content are correlated to lignin's upgradeability. An obstacle to the development of a conclusive causal relationship between lignin structure and upgradeability has been the difficulty to quantitatively measure lignin structural features. Here, we demonstrated that a modified HSQC-NMR method known as HSQC0 can accurately quantify lignin functionalities in extracted lignin using several synthetic polymer models. We then prepared a range of isolated lignin samples with a wide range of ether contents (6–46%). By using a simple ether cleavage model, we were able to predict final depolymerization yields very accurately (<4% error), conclusively demonstrating the direct causal relationship between ether content and lignin activity. The accuracy of this model suggests that, unlike in native lignin, ether linkages no longer appear to be randomly distributed in isolated lignin.
Introduction
Lignin, along with cellulose and hemicellulose, is one of the three main components of lignocellulosic biomass. It is a complex polymer formed by phenyl propanoid subunits and is the largest natural source of aromatic molecules. As such, lignin represents a promising feedstock for the production of renewable chemicals.The main avenue for producing aromatic building blocks from lignin is to cleave lignin's interunit ether linkages (Fig. 1, in blue) to produce phenyl-propanoid monomers. So far, breaking its interunit carbon–carbon (C–C) linkages (Fig. 1, in orange) has proven much more challenging.1,2 In this context, several studies have proposed calculations for estimating theoretical lignin monomer yields based on cleavage of these ether bonds, which are typically on the order of 45–55% for hardwoods and 20–30% for softwoods.3–5 Treating unmodified wood in the presence of a heterogeneous catalyst, hydrogen, or a hydrogen-donating solvent leads to yields that are within this range (i.e., near or at so-called theoretical yields).3,6–8 Many pretreatment or pulp and paper processes have been developed to isolate lignin, due to its negative effects on biological conversion of polysaccharides and undesirable properties in paper manufacturing.9 These extraction techniques usually cause significant alterations to lignin's chemical structure, which make its upgrading and characterization more difficult.1 Specifically, during lignin extraction, a common chemical transformation involves lignin's principle β-O-4 linkages, which rapidly dehydrates at the α-position leading to a benzylic carbocation intermediate that rapidly condenses with negatively charged positions within lignin to form additional interunit C–C linkages. As a result, yields from isolated lignin are typically significantly lower than those obtained from isolated lignin (<10–20%).1,2,5 Such alterations also create more complexity in the chemical structure of lignin, which makes its characterization more challenging than that of native lignin. Recently, our group has developed a process for lignin extraction in the presence of aldehydes, which rapidly react with the diol structure present in lignin's β-O-4 linkages to form acetals.5,10 This reaction prevents dehydration and subsequent condensation of lignin. As a result, we have produced isolated lignin that can be depolymerized by hydrogenolysis to monomers at near-theoretical yields (45–50%).5,10
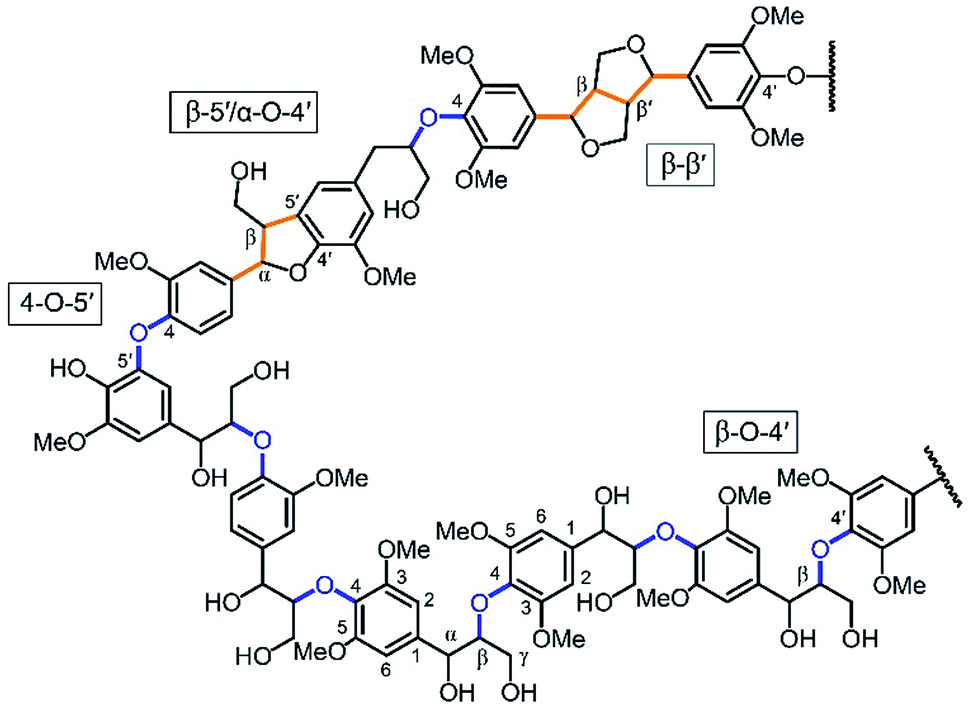 | ||
| Fig. 1 Model structure of a hardwood lignin with interunit ether linkages shown in blue and C–C linkages shown in orange. Lignin units correspond to the phenyl propanoid structures between these linkages. | ||
Because of the apparent correlation between lignin ether linkage content and its subsequent upgradeability, several groups have studied this relationship. Notably, many studies, beginning with Yan et al., have used the ether content (sometimes estimated using NMR techniques) to calculate the so-called “theoretical yield” of monomers.3,5–7 Hodge et al. further developed the relationship between ether linkage and depolymerization yields and proposed that the ether content could be used to predict monomer yields after depolymerization for extracted lignin.4 Structural features of lignin such as the content of β-O-4 linkages or OH-groups are important indicators of the extracted lignin's reactivity. However, because of the aforementioned issues with elucidating the structure of extracted lignin, the yields obtained from the extracted lignin were fairly low (<20%) and the correlation developed between yields and β-O-4 could be inaccurate, with some errors beyond 20%.
Measuring ether content by nuclear magnetic resonance (NMR) is often considered the most accurate method for determining the ether content in biomass. However, for quantitative methods like 1-D 13C, overlapping peaks within lignin and between lignin and carbohydrates is a significant issue.11 Two-dimensional 1H–13C Heteronuclear Single Quantum Coherence Nuclear Magnetic Resonance Spectroscopy (2D-HSQC NMR) is used most frequently to assess the ether content because it avoids the issue of overlapping peaks.12 However, this method is usually used comparatively between samples rather than to yield quantitative information, because the cross-peaks are not exactly proportional to the concentration of chemical groups in the sample. This lack of quantitative data is due to the errors caused by resonance offsets, different T2 relaxation between different parts of the biopolymer, imperfect pulses, homonuclear coupling, and coupling constant deviations.13,14 These errors for both 1-D and 2-D NMR have prevented the development of a truly quantitative method to determine ether content in lignin samples as well as conclusively linking lignin structural features with subsequent depolymerization yields.
A recently developed method for quantitative NMR analysis of metabolites can be used for simultaneous identification and quantification of structures in oligomeric mixtures by repetition of a pulse sequence between the first 1H excitation pulse and the acquisition point.15 Errors due to different relaxation times are eliminated by extrapolation to a zero-relaxation time (HSQC0) for a series of spectra, acquired with different repetition times. The most accurate of these methods is known as gradient-selective HSQC0, which provides more accurate quantitative results by reducing the T1 noise which can affect the peak intensities at low concentrations.16 The T1 noise, which generally has higher intensity compared to the normal thermal noise, is a ridge of noise around the large peaks in parallel to the F1 axis and is specific to 2D NMR spectra.
In this work, we used gradient-selective HSQC0 on isolated lignin samples to quantitatively determine their structural features and conclusively link them to monomer yields and distributions measured by GC-FID obtained after hydrogenolysis (Fig. 2). By isolating lignin in the presence and absence of aldehydes, we were able to analyze lignins with a wide range of ether contents, including lignin with near-native ether contents.
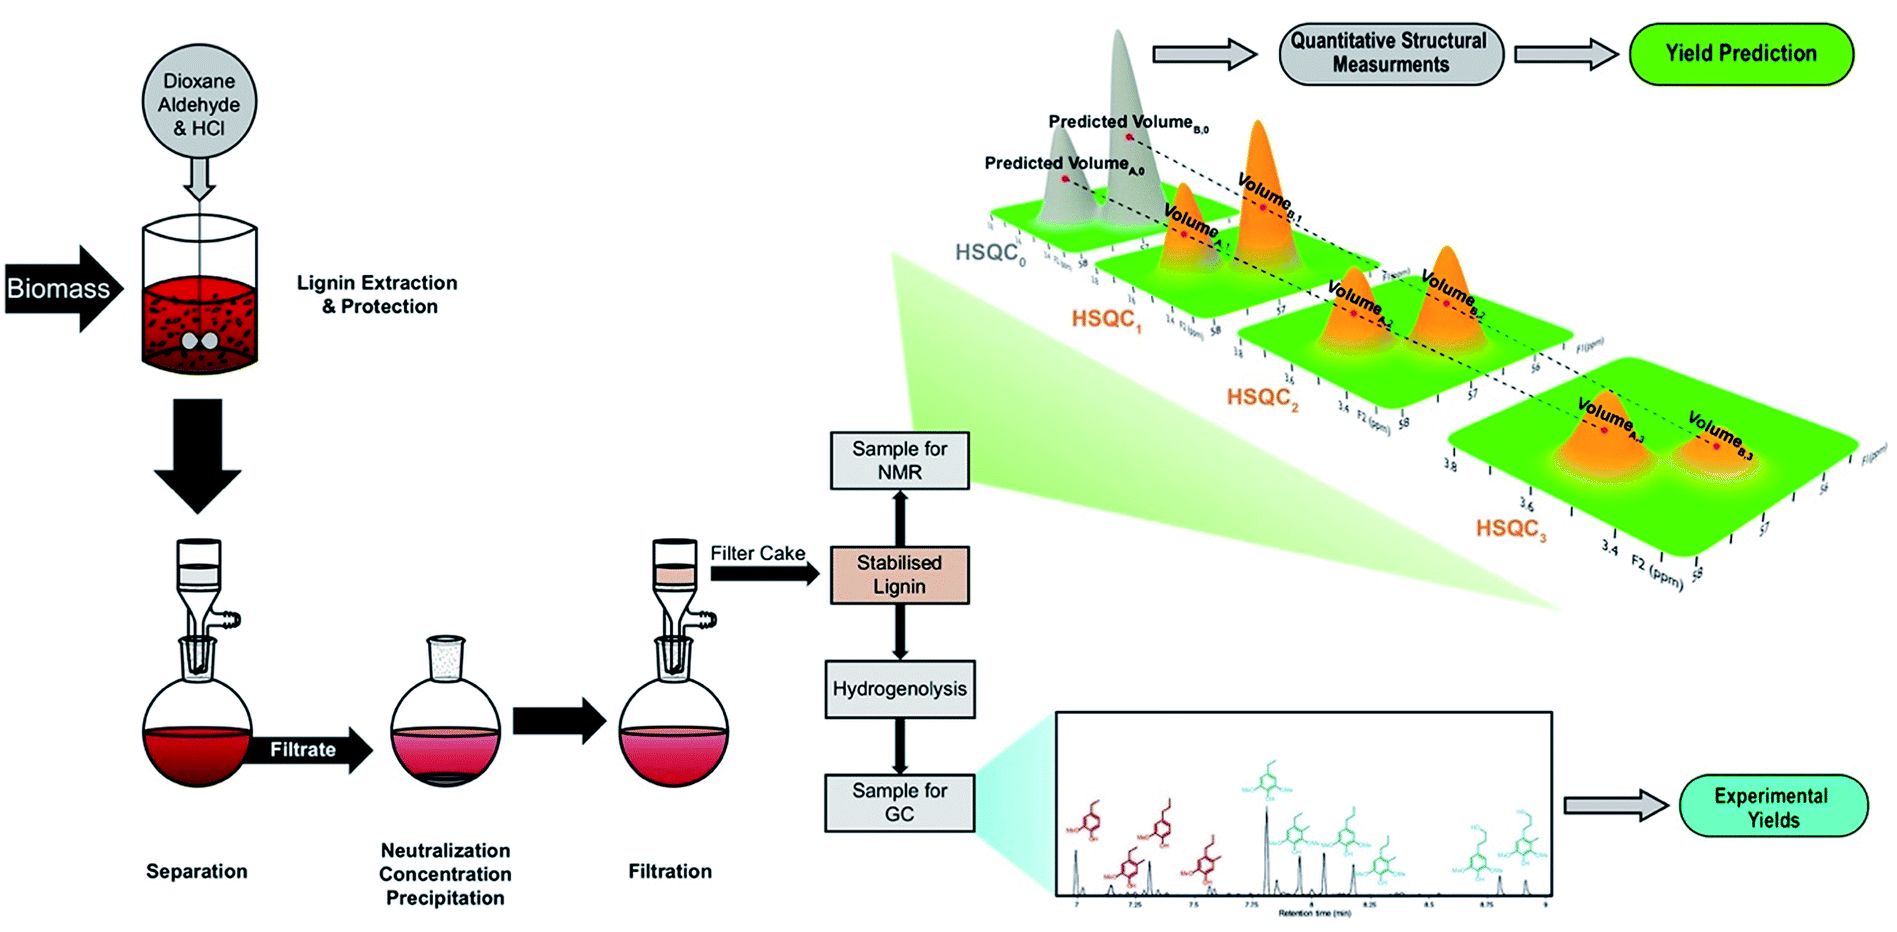 | ||
| Fig. 2 Experimental sequence including preparation of aldehyde-stabilized lignin samples, prediction of monomer yields by HSQC NMR, and the validation of results with experimental yields. | ||
Results and discussion
To check the validity of this HSQC0 for oligomeric lignin samples, we started by synthesizing a series of polymeric model compounds with different composition of monolignols, but only connected through β-O-4 linkages. The synthesis was performed following a slightly modified procedure from Kishimoto et al.17,18 Three polymers were synthesized: G and S refer to homopolymers containing only guaiacyl (Fig. 3a) or syringyl (Fig. 3b) units, respectively, and GS refers to a random copolymer containing 70 mol% of syringyl and 30 mol% of guaiacyl units (Fig. 3c), which mimics the average composition of lignin in hardwood. The well-defined structure of the synthetic polymers was confirmed by 1D and 2D NMR, Gel Permeation Chromatography (GPC) and MALDI (Matrix-Assisted Laser Desorption/Ionization). The full synthetic procedure and characterization is described in detail in the ESI (see Section S2.1 of the ESI†).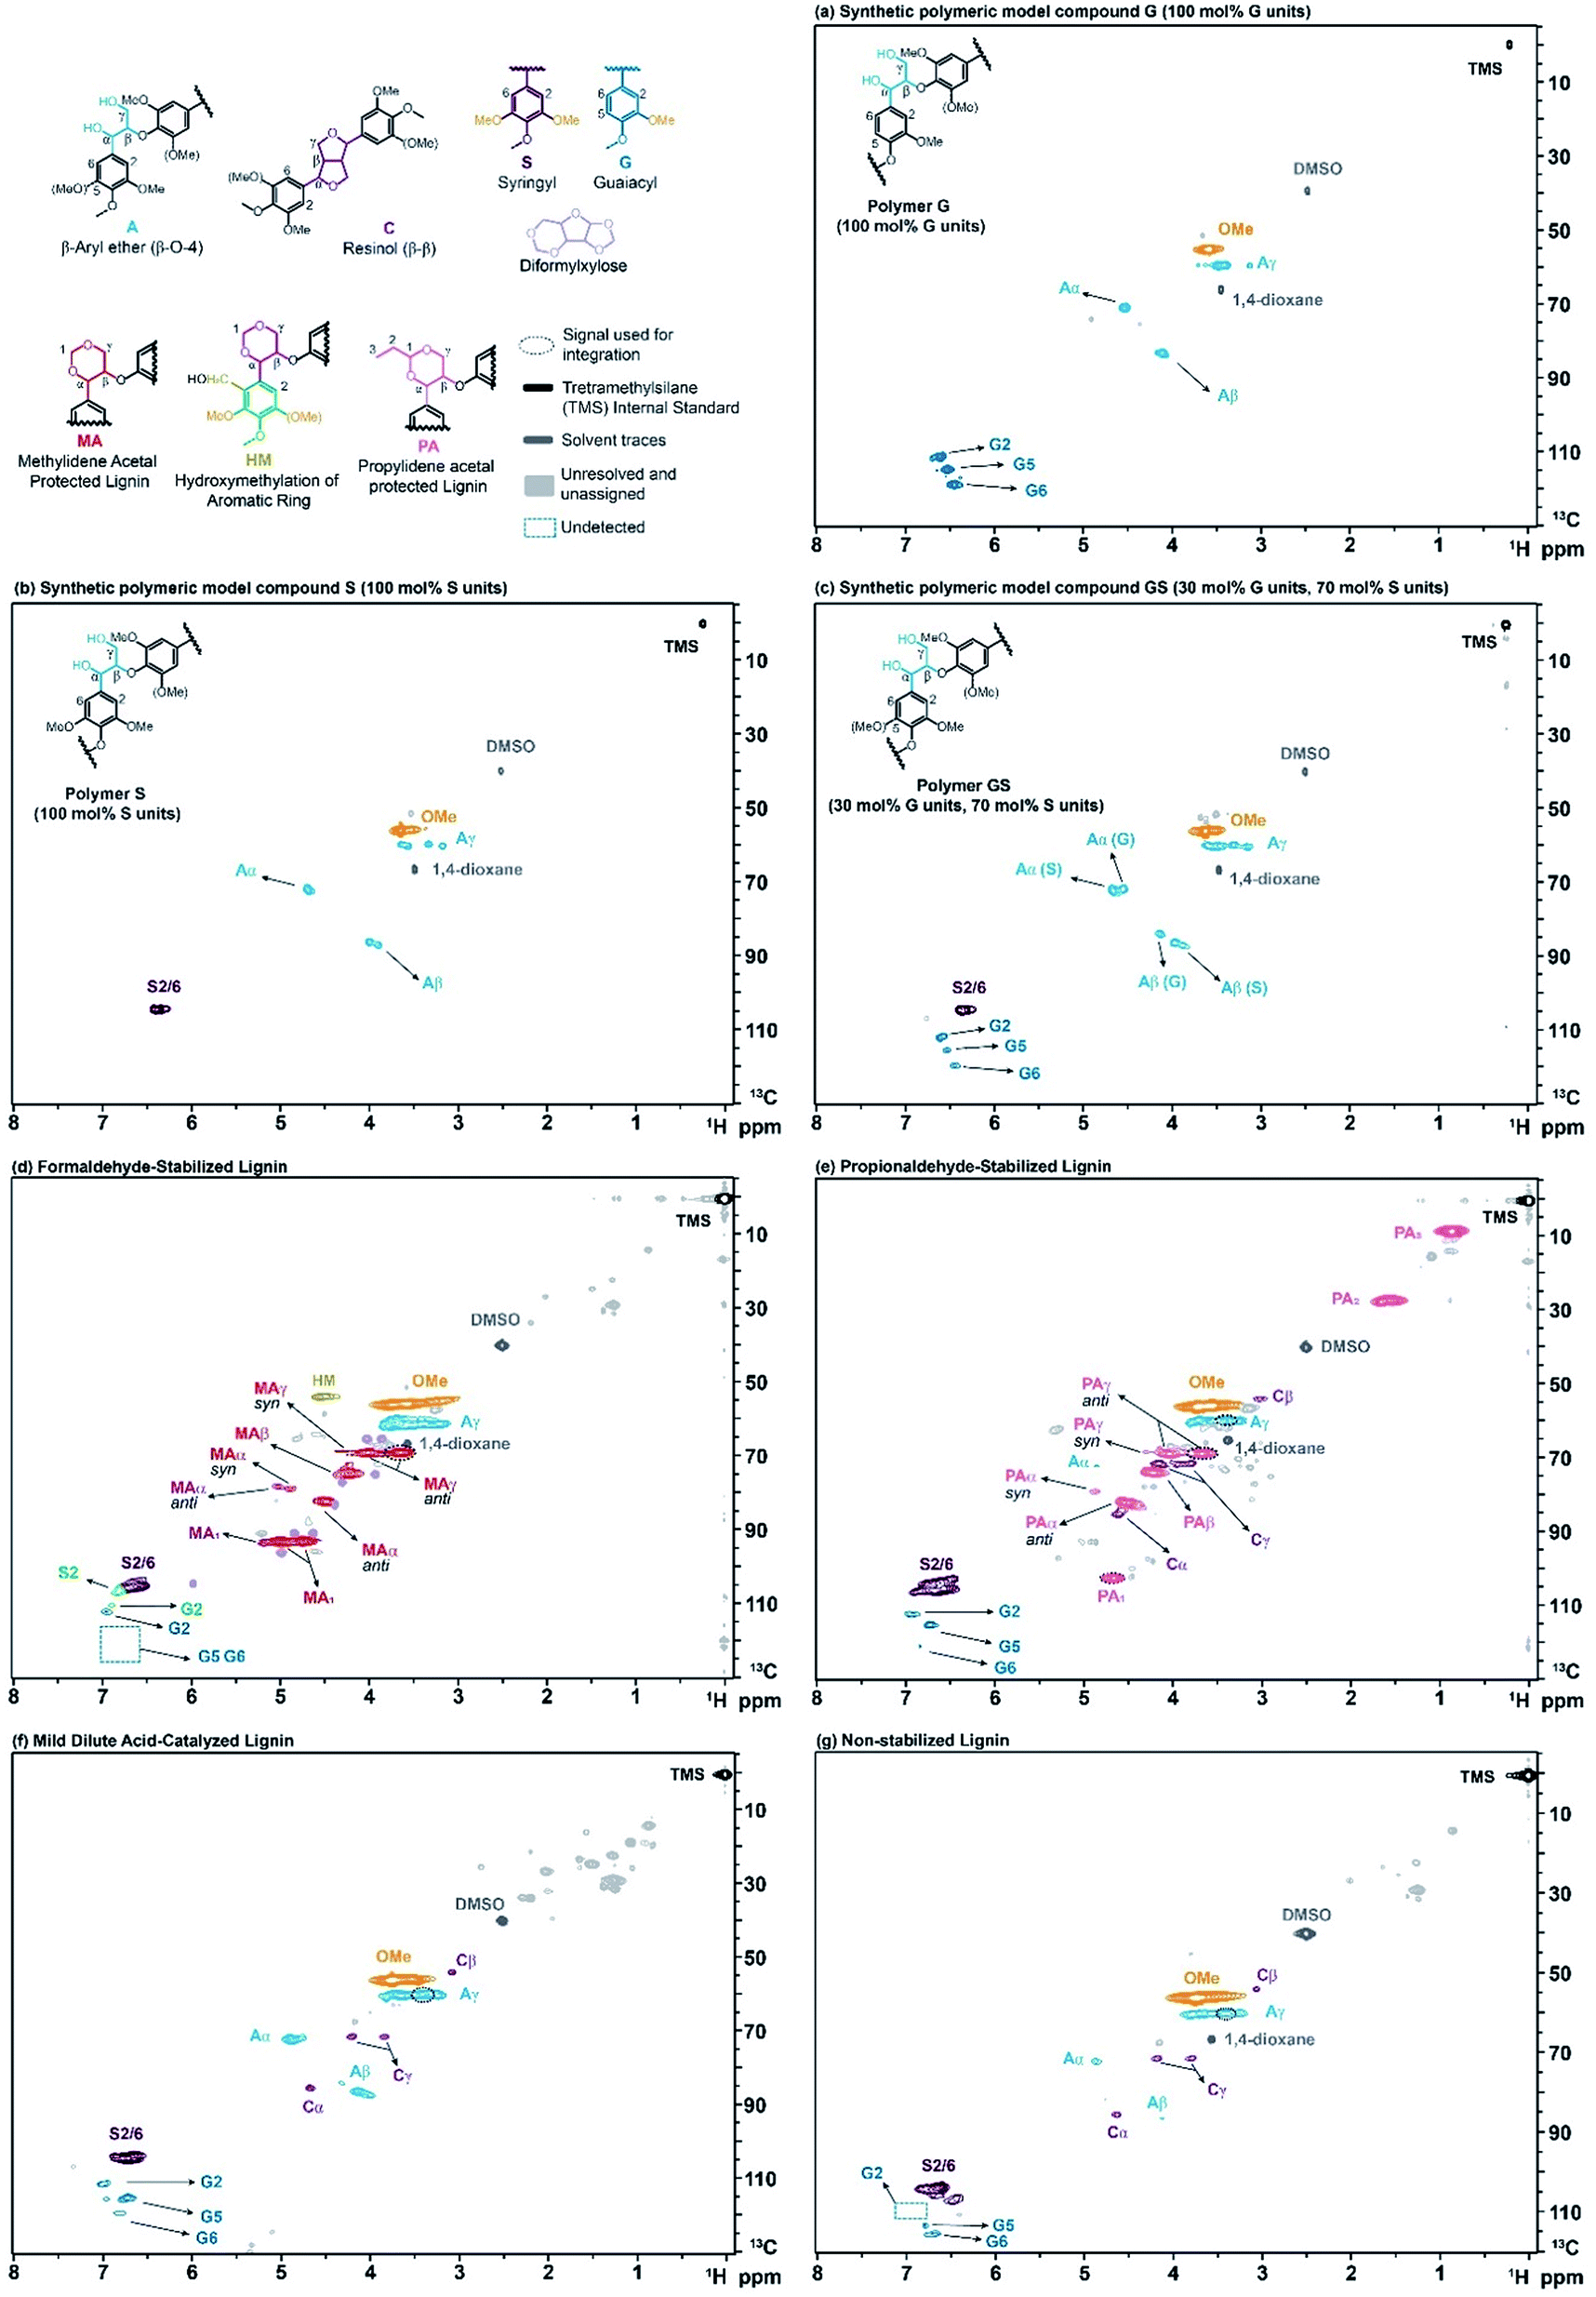 | ||
| Fig. 3 2D-HSQC NMR spectra of model compounds and isolated lignins. (a) Polymeric model compound G (100 mol% G units), (b) polymeric model compound S (100 mol% S units), (c) polymeric model compound GS (30 mol% G units, 70 mol% S units), (d) formaldehyde-stabilized lignin (sample SF3 in Table S3 of the ESI†) (e) propionaldehyde-stabilized lignin (sample SP6 in Table S3 of the ESI†) (f) mild dilute acid-catalyzed lignin (sample SA8 in Table S3 of the ESI†) (g) organosolv (non-stabilized) lignin (sample SU10 in Table S3 of the ESI†). The “signal used for integration” refers to the groups that include more than one peak but due to technical reasons only one of them is used for integration (see Sections S3.2.5 and S3.2.7 of the ESI†). | ||
To further study the effectiveness of the method, we produced a number of lignin samples with a wide range of ether contents. We isolated lignin using several extraction techniques described elsewhere, including: formaldehyde-stabilized,19 propionaldehyde-stabilized,19 mild dilute acid-catalyzed (MDAC),20 and organosolv (non-stabilized) lignin. A detailed description of these various isolation methods is provided in the ESI (see Section S2.2 of the ESI†). Briefly, formaldehyde- and propionaldehyde-stabilized lignins are prepared by extraction in dioxane![[thin space (1/6-em)]](https://www.rsc.org/images/entities/char_2009.gif) :water solutions (typically 8.5:1) with HCl and the aldehyde. The aldehyde rapidly reacts with the diol structure on the β-O-4 linkage to form either methylidene acetal structures (in formaldehyde-stabilized lignin, Fig. 3d) or propylidene acetal structures (in propionaldehyde-stabilized lignin, Fig. 3e). The presence of formaldehyde can also lead to the addition of hydroxymethyl groups to lignin's aromatic ring (Fig. 3d). Because the acetal prevents degradation, lignin can be almost completely extracted (>90 wt%)10 while preserving its ether linkage structure, leading to very clean 2-D-HSQC spectra (Fig. 3d and e). Mild dilute acid-catalyzed lignin extraction uses a similar solvent system (9:1 dioxane:water) but about half the acid concentration, no aldehyde and shorter extraction times (45 min vs. 3 h). This method leads to lignin with significant remaining ether linkages (Fig. 3f) but typically can only extract small fractions of the native lignin (<20 wt%). As the extraction times are extended, more lignin is recovered but the lignin's ether linkage content drops rapidly due to condensation.10 Finally, lignin can be extracted under similar conditions as for aldehyde-stabilized lignins but without aldehyde addition. These conditions again lead to near-complete extraction of the lignin, but the absence of a protection group resulted in significant condensation and, thus, much lower ether signals in the 2-D NMR spectrum (Fig. 3g).
:water solutions (typically 8.5:1) with HCl and the aldehyde. The aldehyde rapidly reacts with the diol structure on the β-O-4 linkage to form either methylidene acetal structures (in formaldehyde-stabilized lignin, Fig. 3d) or propylidene acetal structures (in propionaldehyde-stabilized lignin, Fig. 3e). The presence of formaldehyde can also lead to the addition of hydroxymethyl groups to lignin's aromatic ring (Fig. 3d). Because the acetal prevents degradation, lignin can be almost completely extracted (>90 wt%)10 while preserving its ether linkage structure, leading to very clean 2-D-HSQC spectra (Fig. 3d and e). Mild dilute acid-catalyzed lignin extraction uses a similar solvent system (9:1 dioxane:water) but about half the acid concentration, no aldehyde and shorter extraction times (45 min vs. 3 h). This method leads to lignin with significant remaining ether linkages (Fig. 3f) but typically can only extract small fractions of the native lignin (<20 wt%). As the extraction times are extended, more lignin is recovered but the lignin's ether linkage content drops rapidly due to condensation.10 Finally, lignin can be extracted under similar conditions as for aldehyde-stabilized lignins but without aldehyde addition. These conditions again lead to near-complete extraction of the lignin, but the absence of a protection group resulted in significant condensation and, thus, much lower ether signals in the 2-D NMR spectrum (Fig. 3g).
Gradient-selective HSQC0 was performed by taking three HSQCi spectra (i = 1, 2, 3) (similar to those in Fig. 3), representing different T2 relaxation times, integrating the volumes of the cross-peak correlations of interest, and calculating a hypothetical cross-peak volume for zero relaxation time using a logarithmic extrapolation (see Fig. 2 for a depiction of this process and eqn (S3†)). The extrapolation is shown for formaldehyde-stabilized lignin in Fig. 4. The extrapolated cross-peak volumes were directly proportional to the number of moles of each chemical group in the sample. The added accuracy brought by extrapolation is well illustrated by the interpolated volumes for the three carbons found in the β-O-4 linkage (Cα, Cβ, and Cγ) (Fig. 4). Indeed, the number of moles of Cα, Cβ, and Cγ must be equivalent because they are all part of the same chemical functionality and have the same number of C–H bonds (Cγ has two C–H bonds but only one peak of the doublet is considered during integration to eliminate the effect of the T1 noise; see Section S3.2.5 of the ESI†). Therefore, their volume should have the same value. However, in HSQC1, HSQC2 and HSQC3, the measured volumes showed deviations, even when viewed in the log scale, which illustrates the accuracy issues of HSQC NMR (Fig. 4). In comparison, the extrapolated values led to almost no deviation between volumes for these three signals, which is what is expected based on the lignin's chemical structure. The extrapolated cross-peak volume for the formyl group's carbon (MA1 in Fig. 4) leads to a higher projected value because the effective number of C–H bonds contributing to the volume is twice that of the aforementioned chemical groups.
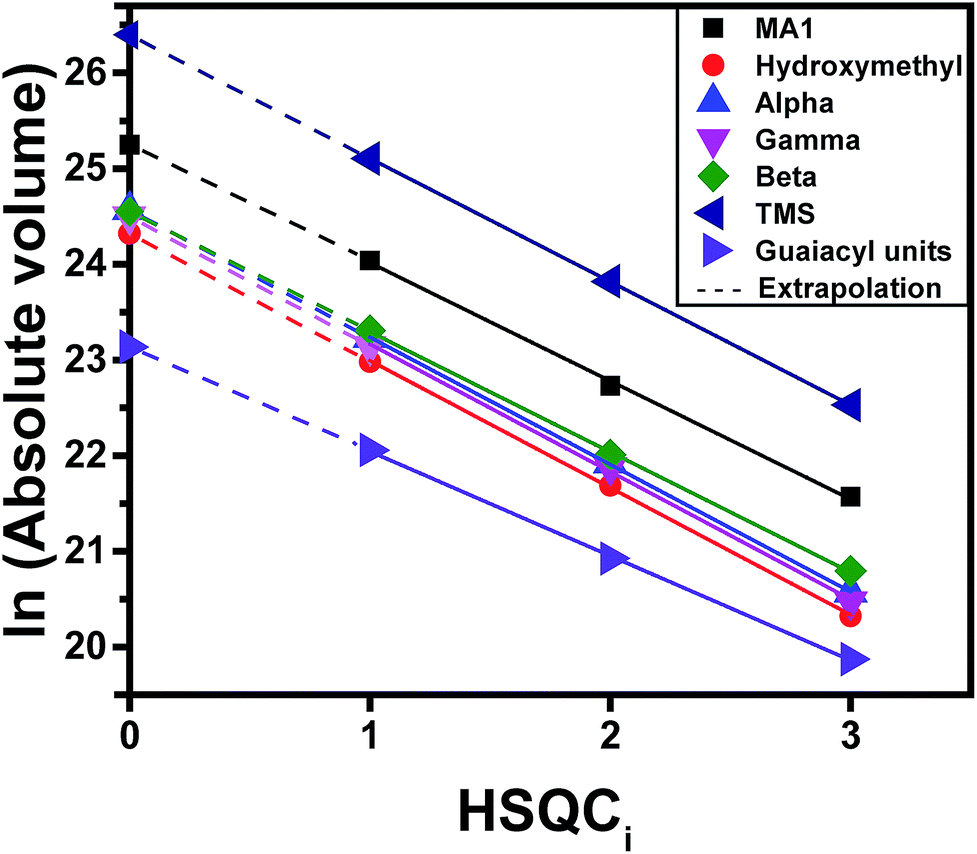 | ||
| Fig. 4 Extrapolation of 2D HSQCi (i = 1, 2, 3) integrated peak volumes (Vi), to find V0 values. This plot corresponds to the formaldehyde-stabilized lignin shown in Fig. 3d. The extrapolation for syringyl units is not shown in this figure, as it is not calculated directly from the integration of the peak due to the overlapping of the peaks. However, the amount of syringyl units are calculated based on the total amount of monomers and guaiacyl units which is explained in Section S3.2.4 (eqn S8 to S10 of the ESI†) and for the case of hydroxymethylation in Section S3.2.6 (eqn S12 to S18 of the ESI†). | ||
To further validate this quantification, we measured the amount of each chemical functionality on the three synthetic polymers by HSQC0 NMR (Table 1). Knowing that Cα, Cβ, and Cγ are part of the β-O-4 linkage, we can calculate the total number of β-O-4 linkages in the sample from the average of the amount of these three carbons. The result (within 5% of what was expected in all three cases along with the accurate measurement of the S/G ratio in GS) validates the effectiveness of this method for quantification of chemical functionalities in lignin-like oligomers.
| Chemical functionality | Polymer G | Polymer S | Polymer GS | ||||||
|---|---|---|---|---|---|---|---|---|---|
| Sample (mmol) | Measurement (mmol) | Error % | Sample (mmol) | Measurement (mmol) | Error % | Sample (mmol) | Measurement (mmol) | Error % | |
| α | 0.259 | 0.257 | −0.7 | 0.233 | 0.245 | 5.5 | 0.240 | 0.236 | −1.4 |
| β | 0.259 | 0.247 | −4.4 | 0.233 | 0.230 | −1.2 | 0.240 | 0.217 | −9.5 |
| γ | 0.259 | 0.293 | 13.4 | 0.233 | 0.240 | 3.1 | 0.240 | 0.234 | −2.4 |
| Guaiacyl | 0.259 | 0.261 | 0.6 | 0 | NA | NA | 0.072 | 0.072 | 0.0 |
| Syringyl | 0 | NA | NA | 0.233 | 0.235 | 1.2 | 0.168 | 0.157 | −6.4 |
| Average (α, β, γ) | 0.259 | 0.266 | 2.8 | 0.233 | 0.238 | 2.5 | 0.240 | 0.229 | −4.5 |
Based on the successful characterization of the synthetic polymeric models, we used this method to quantify protected and unprotected ether bonds as well as the number of resinol (C–C) linkages in extracted lignin samples. We then assumed that each mole of either protected (nprotected) or unprotected ether bond (nunprotected) would be broken during hydrogenolysis to form one mole of monomers, and used this assumption to calculate a predicted total number of moles of monomers (ntotal monomers) and the resulting monomer yield after hydrogenolysis (eqn (1)).
| ntotal monomers = nprotected + nunprotected | (1) |
| nprotected = average(nprotected,α, nprotected,β, nprotected,γ, nprotection group) | (2) |
These protected ether bonds correspond to the structures of MA and PA in the case of formaldehyde-stabilized and propionaldehyde-stabilized respectively (see Fig. 3 and Sections S3.2.6 and S3.2.7 of the ESI† for identification of the peaks). The number of moles of unprotected ether bonds (nunprotected lignin) correspond to the quantity of β-aryl ether structures (see structure in Fig. 3) and are again calculated using an average of their constituents:
| nunprotected lignin = average(nunprotected,α, nunprotected,β, nunprotected,γ) | (3) |
Furthermore, the quantification of the syringyl and guaiacyl units (along with their hydroxymethylated form in the case of formaldehyde-stabilized lignin) was used to predict the expected monomer distribution. In doing so, we assumed that all these units were equally distributed throughout the oligomers and were equally likely to be connected to ether or C–C linkages. The detailed equations used for the prediction of monomers yield and their distribution are given in Section S3.2.4 of the ESI.†
The assumption that the total number of monomers after hydrogenolysis can be predicted by the number of β-O-4 bonds assumes that these ether bonds (either protected or unprotected) are almost only found in oligomers that are largely free of C–C linkages. In addition, this assumption also requires that these oligomers must be long enough to ignore end effects (because an oligomer with n linkages that are only β-O-4 linkages should yield n + 1 monomers). As detailed by Hodge et al.,4 if an oligomer contains m monolignol units with randomly distributed ether and C–C linkages, one has to consider that each monomer that is produced had to have been surrounded by two ether linkages, which leads to the following correlation for monomer yield prediction:
 | (4) |
The β-O-4 content and monomers yield given above are molar ratios and m is the number of monolignols in a given chain of lignin polymer (chain length). For large m, this formula becomes:
| Monomers yield (mol%) ≈ (β-O-4 content)2 | (5) |
Because native lignin is often assumed to have a large chain length and randomly distributed ether and C–C linkages, the aforementioned theoretical monomer yield for lignin based on ether bond cleavage is often calculated based on eqn (5), and seems to accurately predict yields that are achievable from native lignin.3,5–7 These equations assume that native lignin oligomers are linear, which is in line with recent structural studies of native lignin.21
All these models may result in similar predictions for lignins with low monomer yields and short chain lengths. However, significant differences between prediction accuracies are observed for highly upgradable lignin samples (Fig. 5). The model based on the simpler assumption that one β-O-4 linkage produces one monomer after hydrogenolysis showed excellent agreement with experimental results (within 3%) (Fig. 5 and 6). The more complex model that assumes randomly distributed C–C and ether linkages within all oligomers (eqn (4)) performed far worse compared to experiments, regardless of the chain length that was chosen (Fig. 5). This comparison suggests that, for extracted lignin, β-O-4 and C–C linkages are not randomly distributed. In fact, our results point to the presence of oligomers that are largely formed with just β-O-4 linkages and oligomers that are condensed and contain almost only C–C linkages. In contrast, the accurate predictions of maximum hydrogenolysis yield from native lignin based on ether linkage content in past studies using eqn (5) suggests that linkages are randomly distributed in native lignin. Together, these observations suggest that lignin units that are linked by at least one interunit C–C linkage are likelier to condense during extraction compared to lignin units, which would favor the formation of separate groups of condensed oligomers and oligomers containing mostly β-O-4 linkages. Characterizing and quantifying condensed lignin is extremely challenging by 2D-HSQC NMR due to the many possible structures that can be produced and the absence of C–H bonds on certain condensed functionalities. Therefore, conclusions based on ether linkages and the resulting product yields and distributions offer a useful alternative to the difficult characterization of lignin oligomeric structures.
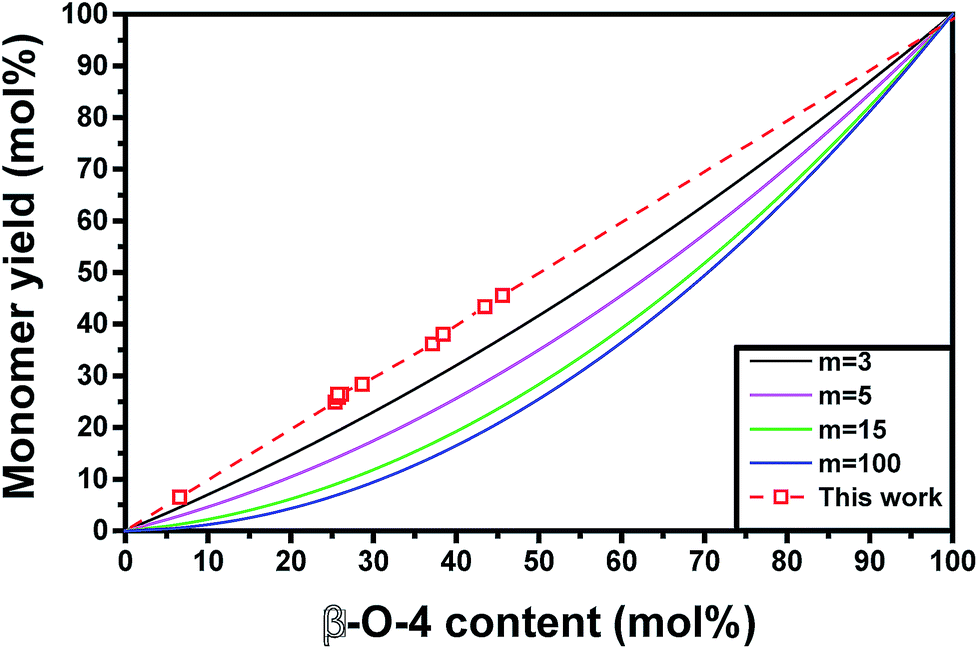 | ||
| Fig. 5 Comparison of different monomer yield models based on extracted lignin. The model used in this work is based on eqn (1) and assumes non-random ether linkage distribution, whereas the other models (for varying chain length with m monolignols) are based on a model featuring randomly distributed ether and C–C linkages proposed by Hodge et al.4 and are given by eqn (4). | ||
 | ||
| Fig. 6 Predicted yields versus experimental yields. The yields are in moles per moles of lignin unit. | ||
As previously mentioned, a chain consisting of only β-O-4 linkages with n linkages should result in n + 1 monomers, while our model neglects these end effects and assumes the production of just n monomers. Past measurements by gel permeation chromatography had shown that formaldehyde-stabilized lignin had an approximate average chain length of about m = 15 units and we measured a similar distribution for propionaldehyde-stabilized lignin (Fig. S5†).5 Therefore, in such a case, the model presented in eqn (1) should underestimate the monomer yield by about 7%. The fact that this systematic error does not occur could be explained by the fact that the hydrogenolysis yield of the ether linkages is a bit lower than 100%, which could be partially compensating the underestimation.
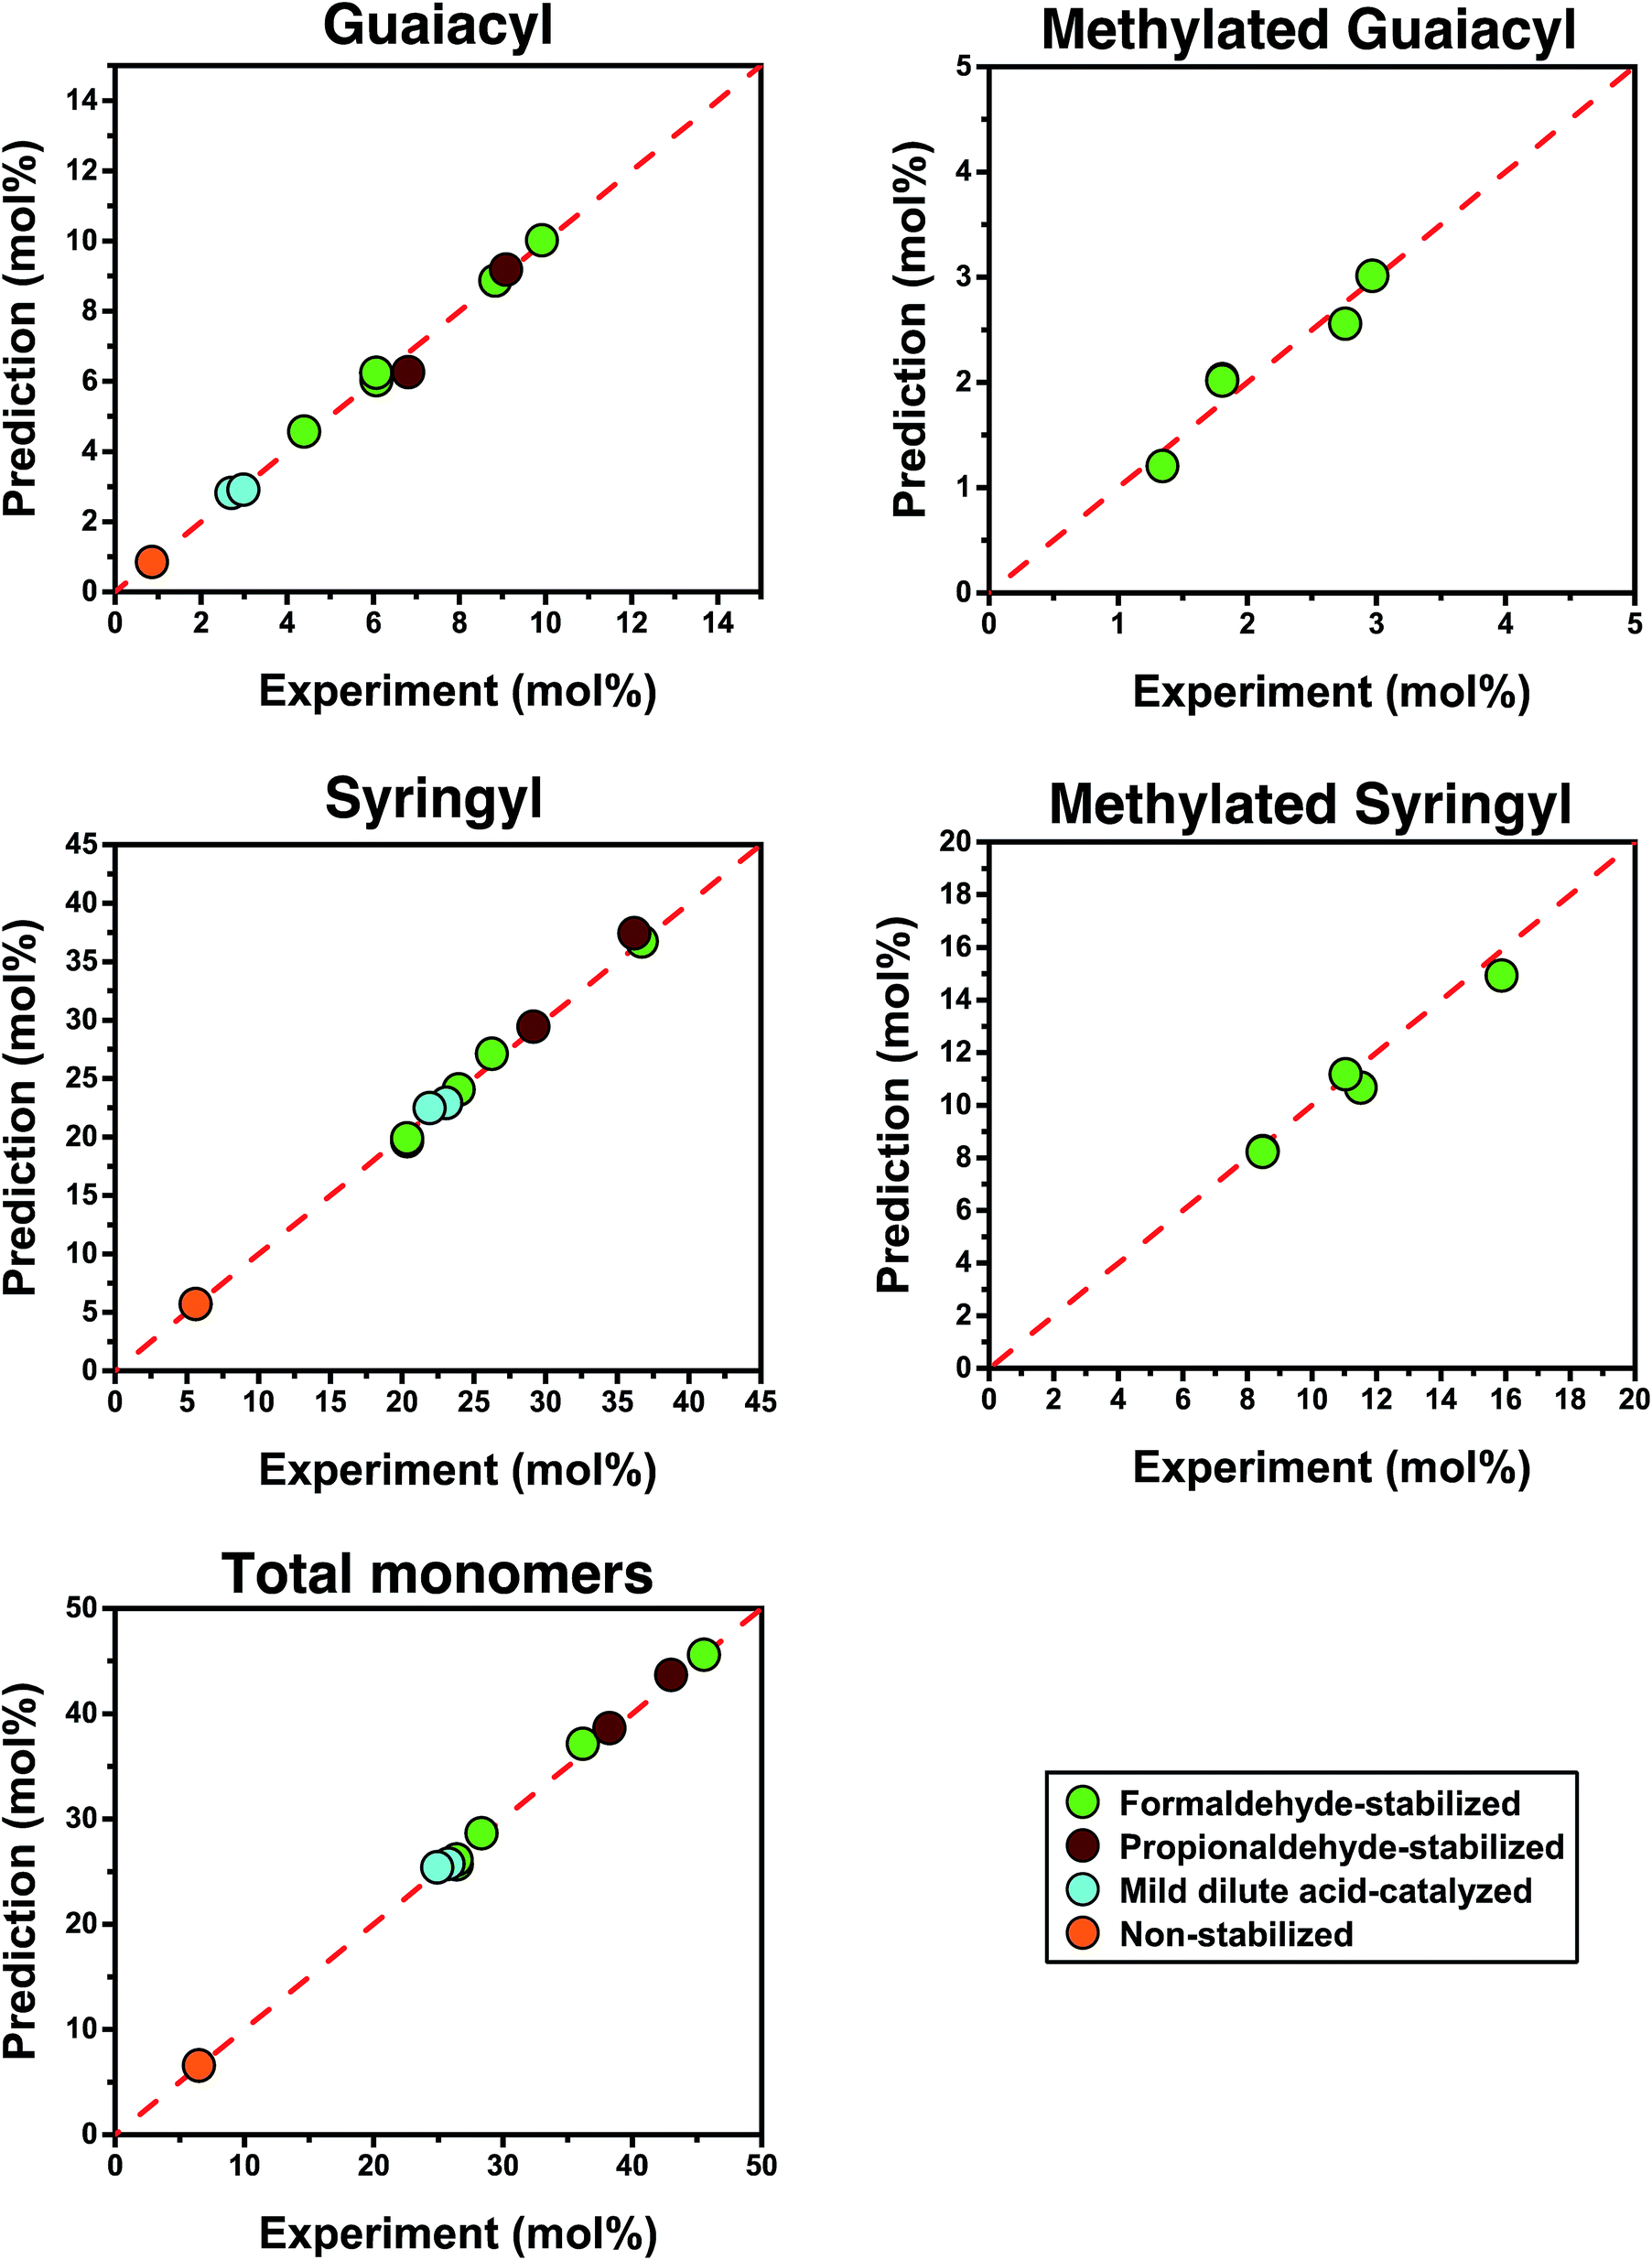
We also used our model to predict the distribution of individual monomers (Fig. 6). In doing so, we observed a trend where the groups that were present in smaller quantities led to more deviations between their predictions and experimental values, presumably due to error in the cross-peak integration and, to a lesser extent, quantification after hydrogenolysis. The predicted quantities of syringyl monomers, which were most abundant, showed similar accuracy to the total monomer quantities (<4% deviation). In comparison, the predicted quantities of methylated units based on the quantity of hydroxymethylated units detected in the HSQC spectrum showed larger deviations (<8%), probably because they were 3 times less prominent than syringyl units. Nevertheless, all predictions remained accurate across a wide range of monomer yields (6% to 46%) for both stabilized and non-stabilized isolated lignins. When applying this method to lignin samples with very high degrees of condensation such as Klason or Kraft lignin, we achieved varying results (see Section S3.2.5 in the ESI†). For Klason lignin, we did not detect any monomers after hydrogenolysis, which was in line with what was expected. For Kraft lignin, we obtained a yield of <1% after hydrogenolysis but could not accurately measure ether linkages by NMR, which might indicate the limitations of this method for lignin that has undergone severe structural modifications. Nevertheless, these predictions have demonstrated that the structure of lignin is a key determining factor controlling its ability to be depolymerized.
Conclusions
HSQC0 NMR very accurately quantified the chemical functionalities on synthetic lignin polymeric models. By using this method to characterize several lignin samples isolated from hardwood, we were able to very accurately predict lignin depolymerization yields based on its 2-D HSQC NMR spectra. In this way, we are providing a non-destructive method for characterizing lignin's upgradeability that remains accurate over a wide range of ether contents. The very clear relationship between structure and upgradeability could further guide the development of new structure-function relationships for lignin and, as demonstrated here, provide insights into the distribution of functionalities along the lignin polymer.Conflicts of interest
There are no conflicts to declare.Acknowledgements
This work was supported by the Swiss National Science Foundation through grants PYAPP2_154281 and CRSII5_180258, by the Swiss Competence Center for Energy Research: Biomass for a Swiss Energy Future through the Swiss Commission for Technology and Innovation grant KTI.2014.0116, and by EPFL. The authors thank J. Ralph (UW Madison) for the suggestion to explore the use of HSQC0, J. Morisod (EPFL) for his help with gel permeation chromatography, A. Bornet for his help performing NMR experiments and W. Lan (EPFL) for providing initial acidolysis lignin samples and for NMR suggestions. Finally, we thank M. Studer from Bern University of Applied Sciences (Switzerland) for providing various wood samples.Notes and references
- W. Schutyser, T. Renders, S. V. den Bosch, S.-F. Koelewijn, G. T. Beckham and B. F. Sels, Chem. Soc. Rev., 2018, 47, 852–908 RSC.
- L. Shuai, M. Talebi Amiri and J. S. Luterbacher, Current Opinion in Green and Sustainable Chemistry, 2016, 2, 59–63 CrossRef.
- N. Yan, C. Zhao, P. J. Dyson, C. Wang, L. Liu and Y. Kou, ChemSusChem, 2008, 1, 626–629 CrossRef CAS PubMed.
- T. Phongpreecha, N. C. Hool, R. J. Stoklosa, A. S. Klett, C. E. Foster, A. Bhalla, D. Holmes, M. C. Thies and D. B. Hodge, Green Chem., 2017, 19, 5131–5143 RSC.
- L. Shuai, M. T. Amiri, Y. M. Questell-Santiago, F. Héroguel, Y. Li, H. Kim, R. Meilan, C. Chapple, J. Ralph and J. S. Luterbacher, Science, 2016, 354, 329–333 CrossRef CAS PubMed.
- S. V. den Bosch, W. Schutyser, R. Vanholme, T. Driessen, S.-F. Koelewijn, T. Renders, B. D. Meester, W. J. J. Huijgen, W. Dehaen, C. M. Courtin, B. Lagrain, W. Boerjan and B. F. Sels, Energy Environ. Sci., 2015, 8, 1748–1763 RSC.
- M. V. Galkin and J. S. M. Samec, ChemSusChem, 2014, 7, 2154–2158 CrossRef CAS PubMed.
- Z. Sun, G. Bottari, A. Afanasenko, M. C. A. Stuart, P. J. Deuss, B. Fridrich and K. Barta, Nat. Catal., 2018, 1, 82 CrossRef CAS.
- R. Singh, A. Shukla, S. Tiwari and M. Srivastava, Renewable Sustainable Energy Rev., 2014, 32, 713–728 CrossRef CAS.
- W. Lan, M. T. Amiri, C. M. Hunston and J. S. Luterbacher, Angew. Chem., 2018, 130, 1370–1374 CrossRef.
- L. Zhang and G. Gellerstedt, Magn. Reson. Chem., 2007, 45, 37–45 CrossRef CAS PubMed.
- C. Heitner, D. Dimmel, J. Schmidt, D. Dimmel and J. Schmidt, Lignin and Lignans: Advances in Chemistry, CRC Press, 2016 Search PubMed.
- G. Gellerstedt and G. Henriksson, in Monomers, Polymers and Composites from Renewable Resources, ed. M. N. Belgacem and A. Gandini, Elsevier, Amsterdam, 2008, pp. 201–224 Search PubMed.
- J.-L. Wen, S.-L. Sun, B.-L. Xue and R.-C. Sun, Materials, 2013, 6, 359–391 CrossRef CAS PubMed.
- K. Hu, W. M. Westler and J. L. Markley, J. Am. Chem. Soc., 2011, 133, 1662–1665 CrossRef CAS PubMed.
- K. Hu, J. J. Ellinger, R. A. Chylla and J. L. Markley, Anal. Chem., 2011, 83, 9352–9360 CrossRef CAS PubMed.
- T. Kishimoto, Y. Uraki and M. Ubukata, Org. Biomol. Chem., 2008, 6, 2982–2987 RSC.
- T. Kishimoto, Y. Uraki and M. Ubukata, J. Wood Chem. Technol., 2008, 28, 97–105 CrossRef CAS.
- M. T. Amiri, G. R. Dick, Y. M. Questell-Santiago and J. S. Luterbacher, Nat. Protoc., 2019, 14, 921 CrossRef PubMed.
- A. Das, A. Rahimi, A. Ulbrich, M. Alherech, A. H. Motagamwala, A. Bhalla, L. da Costa Sousa, V. Balan, J. A. Dumesic, E. L. Hegg, B. E. Dale, J. Ralph, J. J. Coon and S. S. Stahl, ACS Sustainable Chem. Eng., 2018, 6, 3367–3374 CrossRef CAS.
- C. Crestini, F. Melone, M. Sette and R. Saladino, Biomacromolecules, 2011, 12, 3928–3935 CrossRef CAS PubMed.
Footnote |
| † Electronic supplementary information (ESI) available. See DOI: 10.1039/c9sc02088h |
| This journal is © The Royal Society of Chemistry 2019 |