 Open Access Article
Deciphering and quantifying linear light upconversion in molecular erbium complexes†
Bahman
Golesorkhi
,
Alexandre
Fürstenberg
 ,
Homayoun
Nozary
and
Claude
Piguet
 *
*
Department of Inorganic and Analytical Chemistry, University of Geneva, 30 Quai E. Ansermet, CH-1211 Geneva 4, Switzerland. E-mail: Claude.Piguet@unige.ch
First published on 6th June 2019
Abstract
Single-center light upconversion corresponds to the piling up of low-energy photons via successive linear absorptions: a phenomenon commonly observed in lanthanide-doped low-phonon ionic solids or nanoparticles. Its ultimate miniaturization in molecular complexes opens challenging perspectives in terms of improved reproducibility, chemical control and optical programming. However, high-energy vibrations inherent in coordination complexes severely limit the efficiency of successive excited-state absorptions (ESAs) responsible for the gain in photon energy. By carefully wrapping three polyaromatic ligand strands around trivalent erbium, we managed to induce low-power room temperature near-infrared (λexc = 801 nm or 966 nm) to visible green (λem = 522 nm and 545 nm) light upconversion within mononuclear coordination complexes [Er(Lk)3]3+ operating either in the solid state or in non-deuterated solution. The calculated upconversion quantum yields set the zero-level of an elemental erbium-centered molecular ESA mechanism, a value which favorably compares with cooperative upconversion (CU) previously implemented in sophisticated multisite Yb2Tb supramolecular assemblies. The various dependences of the upconverted emission on the incident excitation power imply different mechanisms, which can be tuned by molecular design.
Introduction
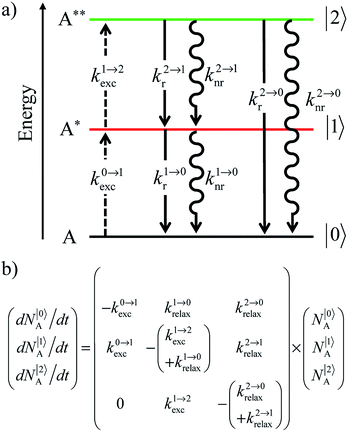
In optics, the common degradation of energy considers the conversion of high-energy photons into photons of lower energy (downshifting) together with heat dissipation. The reverse situation, in which low-energy photons are transformed into higher energy ones (up-conversion), was envisioned early on as a consequence of the non-linear dependence of the refractive index on the applied electric field,1 and theoretically predicted by Goeppert-Mayer in 1931.2 However, the so-called non-linear optical (NLO) response of matter is so inefficient that its experimental illustration for second-harmonic generation (in quartz)3 and for two-photon excitation fluorescence (in Eu2+-doped materials)4 was delayed until the first ruby laser providing a strong and coherent incident beam became available in 1960.5 Beyond symmetry rules, there is no specific limitation for implementing NLO responses in matter and both macroscopic solids and (bio)molecules are prone to work as non-linear optical activators as long as huge incident power intensities in the 105–1010 W cm−2 range are used.6 In parallel with NLO investigations, Bloembergen,7 rapidly followed by Auzel,8 realized that open-shell centers possessing ladder-like series of intermediate excited states with small radiative rate constants (kr), as found for trivalent lanthanides, Ln3+, could be used as relays for successive linear excitations. When such ions are dispersed into low-phonon solids, the non-radiative relaxation pathways (knr) are also minimized to such an extent that linear excitation (kexc) becomes competitive with relaxation (krelax = kr + knr) and intermediate excited states can efficiently absorb additional photons to reach higher-energy excited levels. The latter sequential piling up of several photons on a single activator (Excited-State Absorption = ESA) exploits linear optics and results in the conversion of low energy infrared photons into visible photons, a phenomenon referred to as upconversion (Scheme 1).9 The use of more efficient linear optics combined with the sequential, rather than simultaneous (in NLO), nature of the excitation negates the need for excessively high incident intensities, and upconversion can be achieved using excitation powers that are 5–10 orders of magnitude lower than those required for NLO. A further gain in efficiency of up to two orders of magnitude9a can be generated by the use of optimized peripheral sensitizers for absorbing photons prior to the stepwise transfer of the accumulated energy onto the activator (energy transfer upconversion = ETU). Under these conditions, upconversion quantum yields as large as 4–12% have been implemented in multi-centered mixed lanthanide-doped oxides or fluorides.10 These encouraging achievements make a multitude of challenging applications possible which intend on (i) reducing the spectral mismatch for solar cell technology,9 (ii) designing near-infrared addressable luminescent bioprobes where the biological tissues are transparent11 and (iii) optimizing wave guides,12 security inks,13 lasers and display devices,14 and this despite the weak absorption cross sections of f–f transitions in lanthanides (in the order of σ ≈ 10−20 cm2)15 or of d–d transitions in transition metals (in the order of σ ≈ 10−19 cm2).16Attempts to reduce the size of upconverting solids toward the nanometric scale for being compatible with high-technology hybrid materials and with their incorporation into biological organisms drastically suffer from surface quenching and difficult reproducibilities.11,17 Maximum upconversion quantum yields within the 0.1–0.5% range have been obtained for optimized nanoparticles after surface passivation18 and/or coupling to a surface plasmon for increasing both absorption cross sections and radiative decays.19 Because the intensity of the upconverted light  reflects the population density of the second excited state N|2〉, its magnitude drastically depends on the lifetime of the intermediate excited state
  Solving the matrix equation depicted in Scheme 1b for trivalent erbium incorporated into long-lived doped solids (for instance τ|1〉 = ms in Gd2O2S) under steady-state excitation using reasonable incident pump power (1–10 W cm−2) predicts mole fractions of 2 × 10⁻³ ≤ N|2〉 ≤ 5 × 10⁻³ for the double excited state A**.20 Similar calculations performed for typical short-lived molecular erbium-based complexes possessing high-energy C–H, C–C and C–N oscillators (for instance τ|1〉 = 2.8 μs in a [GaErL3] helix) do not exceed N|2〉 ≤ 10−11.20 It is thus not so surprising that single-centered linear upconversion was originally thought to be undetectable in molecular lanthanide complexes,21 and huge incident power intensities around 109 W cm−2 produced by modern pulsed femtosecond lasers were required to induce faint upconverted signals for [Ln(2,6-dipicolinate)3]3−, [Ln(EDTA)]− (Ln = Nd, Tm, Er),22 and [Tm(DMSO)x]3+ in solution.23 These discouraging results, combined with the approximate 0.1 W cm−2 power density of terrestrial solar irradiance,9c,d paved the way for the exclusive consideration of non-coherent upconversion based on triplet–triplet annihilation (TTA) as the only viable route for performing reliable and workable linear upconversion in molecules.24 However, if the latter annihilation process occurs between two discrete triplet-state entities, their formation requires energy diffusion through multiple chromophores and cannot really be considered as a (uni)molecular process.25 Let us therefore return to the challenge of implementing single-centered upconversion in a molecule where (i) the strong coupling with undesirable high-energy oscillators (mainly O–H and C–H vibrations) limits intermediate excited-state lifetimes and (ii) the small lanthanide absorption cross section σi→j provides minor excitation rate constants
  (eqn (1); λP is the pump wavelength, P is the incident pump intensity, h is the Planck constant and c is the speed of light in a vacuum).26
 | (1) |
The decorrelation between light absorption, performed by specific sensitizers, and light-upconversion occurring on an optimized lanthanide activator in multicenter molecular aggregates using the ETU mechanism proved to be less challenging and some protected Er(III)-activators combined with optimized peripheral Yb(III)-sensitizers in multi-doped metal–organic frameworks or coordination polymers displayed weak upconverted green Er(4S3/2 → 4I15/2) and red Er(4F9/2 → 4I15/2) signals upon intense Yb(2F5/2←2F5/2) excitation.27 Encouraged by these preliminary data collected on infinite macroscopic solids, an Er(III) activator was flanked by a couple of Cr(III) sensitizers in a molecular triple helix [CrErCrL3]9+ to give the first molecular-based green upconversion process induced by reasonable power pump intensities (Fig. 1a).28 This success was rapidly confirmed for two other molecular sensitizer/activator pairs obtained by host–guest associations in organic solvents ([IR-806][Er(L)4] in Fig. 1b)29 or in water ([(LEr)F(LEr)]+ in Fig. 1c).30 None of these ETU processes were characterized by quantum yield measurements because of the very faint upconverted signals. In two recent publications,31 Charbonnière and co-workers reported on two novel aqueous-phase assemblies made of a central Tb(III) activator surrounded by two or more Yb(III) sensitizers ([Tb(YbL)2] in Fig. 1d and e). Surprisingly, these (supra)molecular entities exhibit detectable near-infrared to green upconversion, for which only cooperative energy transfers may explain the feeding of the high-energy Tb(5D4) level (Fig. 1d and e). Though some aspects of the theoretical modeling of the latter cooperative upconversion (CU) mechanism are rather analogous to ETU, its efficiency is usually much weaker because it involves quasi-virtual pair levels between which transitions have to be described by higher-order perturbations.9a Despite this limitation, Charbonnière and co-workers were able to estimate a quantum yield of Φup = 1.4 × 10⁻⁸ for the complex depicted in Fig. 2e (deuterated water, room temperature).31b Boosted by these remarkable results, we reasoned that ultimate miniaturization using a single-site excited-state mechanism (ESA) implemented in a trivalent erbium complex should become an obvious target for setting a zero-level for the quantification of molecular upconversion. Taking advantage of the rare dual visible (Er(4S3/2 → 4I15/2) at 542 nm, green) and near-infrared (Er(4I13/2 → 4I15/2) at 1520 nm) downshifted emissions observed upon UV excitation of the triple-helical [Er(L1)3]3+ complex (Fig. 2a), a chromophore which closely mirrors the activator unit in the triple helix [CrErCrL3]9+ (Fig. 1a),32 we recently discovered that some weak upconverted green signals could be generated upon direct near-infrared excitation of the erbium center in this system.33 Building on these preliminary data, we report here on the quantification and detailed mechanism rationalizing the rare single-site upconversion occurring in [Er(L1)3]3+. Comparison with related optical processes implemented in analogous, but stepwise deprotected [Er(Lk)3]3+ (Lk = L2–L4), mononuclear triple helices offers an opportunity for establishing some preliminary rules for implementing single-center erbium upconversion in molecular complexes (Fig. 2).
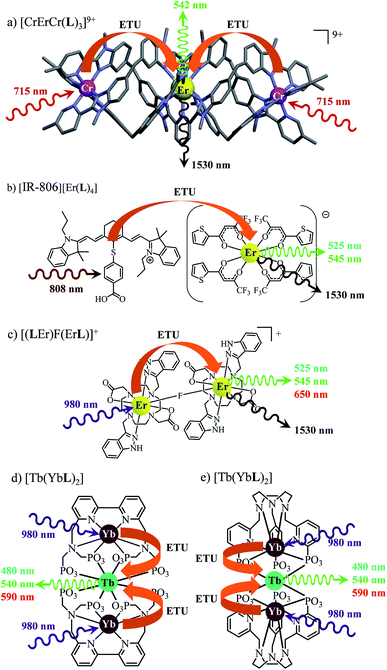 | ||
| Fig. 1 Erbium-based coordination complexes exhibiting linear upconversion processes following the ETU mechanism. The X-ray crystal structure is shown for (a) [CrErCr(L)3](CF3SO3)9 (ref. 28a) and chemical structures deduced from spectroscopic data recorded in solution are depicted for (b) [IR-806][Er(L)4],29 (c) [(LEr)F(LEr)]+ (ref. 30) and (d) and (e) [Tb(YbL)2].31 | ||
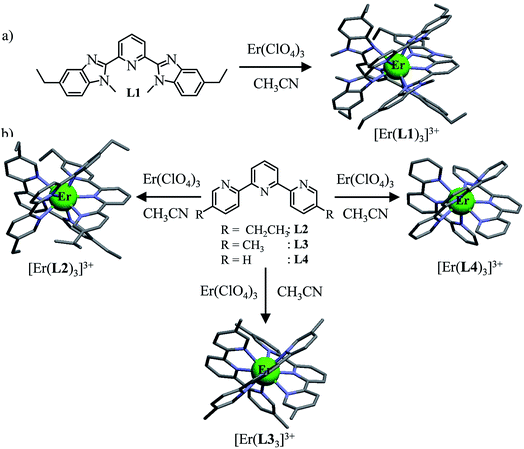 | ||
| Fig. 2 Erbium-based coordination complexes exhibiting linear upconversion processes following the ESA mechanism discussed in this work. The X-ray crystal structures are shown for [Er(L1)3](ClO4)3·1.5CH3CN, [Er(L2)3](ClO4)3, [Er(L3)3](ClO4)3 and [Er(L4)3](ClO4)3·1.5CH3CN. The counter-anions, solvent molecules and H atoms are omitted for clarity. Color code: grey = C, blue = N, and green = Er.32 | ||
Results and discussion
Preparation and structural characteristics of the triple-helical complexes
The four tridentate ligands L1–L4 (Fig. 2) have been shown to react with Er(ClO4)3 in acetonitrile to give highly stable triple helical complexes [Er(Lk)3]3+ (<0.1% dissociated at 10 mM total concentration), which can be crystallized by slow evaporation.32 In the crystal structures of [Er(Lk)3](ClO4)3 (Fig. 2), the Er cations are well-protected from external metallic perturbations (i.e. no cross-relaxation process) since the shortest intermolecular Er⋯Er distances amount to 1.03–1.21 nm. Furthermore, the closest intramolecular Er⋯H contact distance (C–H oscillators) reaches 3.86 Å for [Er(L1)3]3+ (L1 is a 2,6-bis(benzimidazol-2-yl)pyridine ligand), but slightly shrinks to 3.42–3.46 Å for [Er(Lk)3]3+ (Lk = L2–L4, terpyridine-based ligands). Compared with Er⋯H contact distances of 2.85 Å found for the aquo ion [Er(H2O)9](CH3CH2SO3)3 (O–H oscillators),34 the situation of trivalent erbium in the [Er(Lk)3]3+ complexes is compatible with limited multiphonon relaxation due to coupling with remote high-energy oscillators35 as ascertained by the 2–6 μs characteristic room-temperature lifetimes reported for the emissive Er(4I13/2) levels.32 While intramolecular Er⋯H distances are not significantly modified in solution for these rigid triple-stranded helicates,36 the average intermolecular Er⋯Er distance extends to approximately 6.8 nm at 10 mM concentration, which makes these metallic centers completely isolated in solution.Light-downshifting operating in the mononuclear triple-helical complexes
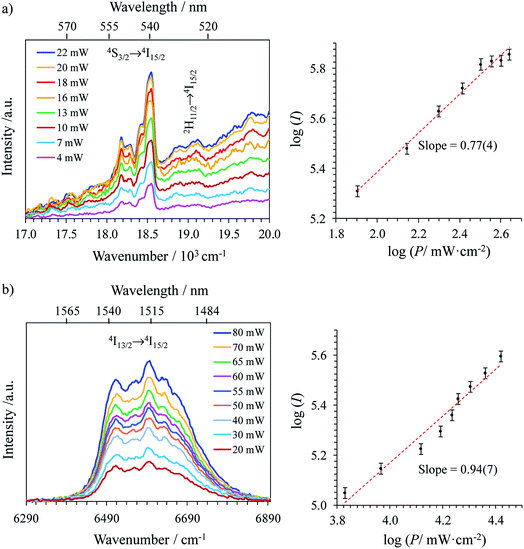
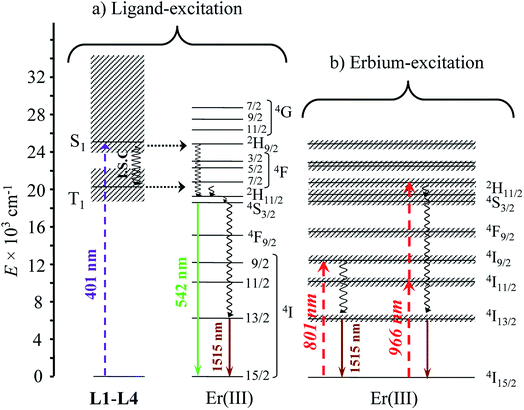
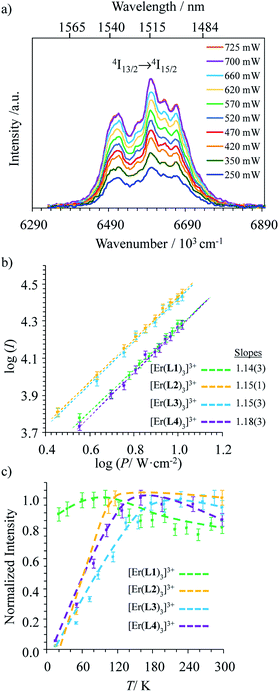
With these structural characteristics in mind, it is not so surprising that ligand-centered excitation at 401 nm of these trivalent erbium complexes [Er(Lk)3]3+ in the solid state and in solution systematically showed dual downshifted visible Er(4S3/2 → 4I15/2) and near-infrared Er(4I13/2 → 4I15/2) luminescence at 542 nm and 1515 nm, respectively (Fig. 3).32 The log–log plots of the intensity of the emitted light with respect to the incident power return slopes around 1.0 (Fig. 3),26 which are the signatures of single-photon ligand-centered excitation processes followed by energy migration according to the antenna effect (Fig. 4a).32 Please note in Fig. 3a the superimposition of the visible Er(2H11/2 → 4I15/2) and Er(4S3/2 → 4I15/2) emission bands with the tails of the residual broad ligand-centered 1,3π* → 1π bands, which is typical for incomplete metal sensitization via the antenna mechanism.Alternatively, the low-energy downshifted near-infrared Er(4I13/2 → 4I15/2) luminescence at 1515 nm can be sensitized via direct Er-centered excitation at λexc = 801 nm of the Er(4I9/2 ← 4I15/2) transition (molar absorption coefficients 0.20 ≤ ε801 ≤ 0.24 M−1 cm−1, Table S1†) of the [Er(Lk)3]3+ complexes in acetonitrile solution (Fig. 5a) or in the solid state (Fig. S1–S3 in the ESI†). The slopes of log(I)–log(P) plots are systematically close to 1.0 (Fig. 5b), a trend in line with single-photon excitations according to the standard mechanism depicted in Fig. 4b (left).
Interestingly, the dependence of the emitted downshifted intensity Iexc:801down on the temperature T is completely different for the terpyridine derivatives [Er(Lk)3]3+ (Lk = L2–L4) and for the extended 2,6-bis(benzimidazol-2-yl)pyridine analogue [Er(L1)3]3+ (Fig. 5c and S4†). A reasonable explanation considers that the non-radiative Er(4I9/2) ⇒ Er(4I13/2) relaxation pathway (ΔE ∼5900 cm−1, Fig. 4b), required for feeding the emissive Er(4I13/2) level following 801 nm excitation, is strongly phonon-activated (harmonics and/or combination bands) with terpyridine ligands. This mechanism disappears at low temperature, which overcomes the expected increase in intensity due to the minimizing of the non-radiative quenching of the Er(4I13/2 → 4I15/2) luminescence at 1515 nm. For the extended 2,6-bis(benzimidazol-2-yl)pyridine binding units in [Er(L1)3]3+, the larger density of available vibrations detected in the fingerprint region of the IR spectrum (Fig. S5†) provides some better adapted combinations of vibrational modes for filling the pertinent energy gap ΔE = E(Er(4I9/2)) − E(Er(4I13/2)) ∼5900 cm−1 and the downshifted luminescence is retained at low temperature (Fig. 5c).
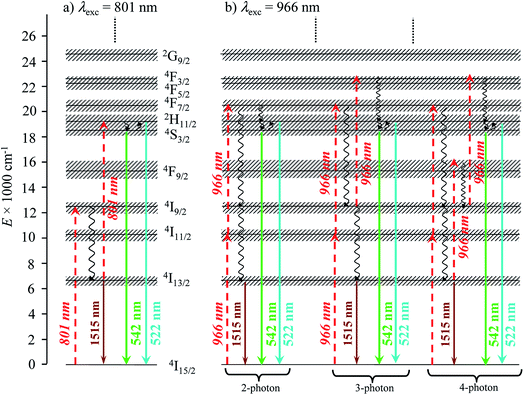
Excitation at λexc = 966 nm of the Er(4I11/2 ← 4I15/2) transition (molar absorption coefficients 0.54 ≤ ε966 ≤ 0.66 M−1 cm−1, Table S1†) surprisingly gives log(I)–log(P) plots with slopes larger than 2.0 for all complexes (Fig. S6–S8†), which suggests the sequential absorption of at least two photons prior to relaxation into the Er(4I13/2) level followed by ultimate Er(4I13/2 → 4I15/2) emission. These unexpected non-linear dependences, modeled with the mechanism depicted in the right part of Fig. 4b (and completed in Fig. 7b, vide infra), imply that the non-radiative Er(4I11/2) ⇒ Er(4I13/2) relaxation processes (ΔE ∼3700 cm−1, Fig. 4b) are poorly efficient in all complexes and prevent direct feeding of the emitting Er(4I13/2) level after excitation at 966 nm.
Lightupconversion operating in the mononuclear triple-helical complexes
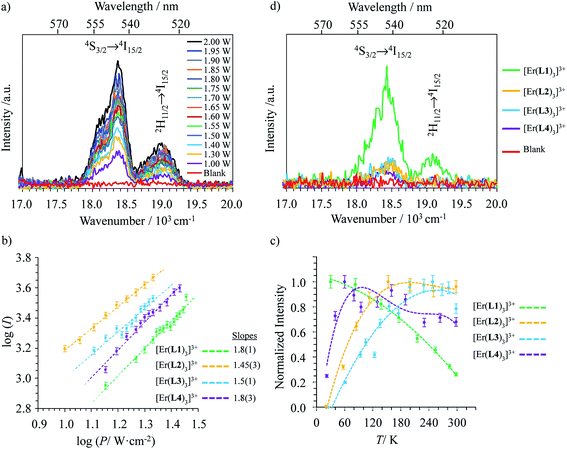
Upon Er-centered excitation at 801 nm of the Er(4I9/2 ← 4I15/2) transition of the triple helical complexes [Er(Lk)3]3+ (Lk = L1–L4) in the solid state (Fig. 6a, S9 and S10†) and in solution (Fig. 6d), the previously discussed downshifted Er(4I13/2 → 4I15/2) luminescence at 1515 nm is accompanied by two much weaker, but upconverted, signals at 542 nm (Er(4S3/2 → 4I15/2), green) and 522 nm (Er(2H11/2 → 4I15/2), blue). The limited 1–30 W cm−2 excitation power intensities, combined with the lack of residual ligand-centered 1,3π* → 1π emission bands exclude the contribution of competitive non-linear optical processes involving the ligands. The slopes of log(I)–log(P) plots span the 1.5–2.0 range (Fig. 6c) and support the successive linear absorption of two photons by the Er(III) metallic centers according to the standard ESA mechanism summarized in Fig. 7a.26The opposite thermal dependences of the intensities of the upconverted Er(4S3/2 → 4I15/2) signals Iup observed for the terpyridine-derivatives [Er(Lk)3]3+ (Lk = L2–L4, Iup increases with T, Fig. 6c and S11†) and [Er(L1)3]3+ (Iup decreases with T) mirror those found for the downshifted near-infrared Er(4I13/2 → 4I15/2) emission (Fig. 5c). This implies that the phonon-activated non-radiative Er(4I9/2) ⇒ Er(4I13/2) relaxation pathway is crucial for both downshifting and upconversion. One can thus safely conclude that the intermediate excited Er(4I13/2) levels act as relays for the ESA mechanism controlling the linear upconversion processes following 801 nm excitations in these complexes (Fig. 7a). As previously reported for Er(III)-doped solids, the close proximity of the thermally coupled 2H11/2 and 4S3/2 levels produce dual blue (522 nm) and green (542 nm) upconverted emissions, the relative intensity ratios of which may be exploited for thermometry applications (Fig. S11f†).37
Although weak, the latter Er(4S3/2 → 4I15/2) and Er(2H11/2 → 4I15/2) upconverted signals can be unambiguously recorded in solution for [Er(Lk)3]3+ at 10 mM concentration in non-deuterated acetonitrile at room temperature (Fig. 6d). Since all [Er(Lk)3]3+ complexes possess similar absorbance for their Er(4I9/2 ← 4I15/2) transition at 801 nm (column 2 in Tables 1 and S1, Fig. S12†), the stronger emission intensity observed for the 2,6-bis(benzimidazol-2-yl)pyridine derivative [Er(L1)3]3+ at a given incident pump intensity can be attributed to an improved quantum yield for the latter complex compared to that for less-protected complexes built with terpyridine derivatives (Fig. 6d). Quantitative data for the upconversion process (up) collected in Table 1 were obtained by using indocyanine green as a reference (λexc = 801 nm, Φ = 0.132 in ethanol at 298 K, Fig. S12†)38 and eqn (2) where Φ is the quantum yield, E is the integrated emission spectrum, A is the absorbance at the excitation wavelength λ, n is the refractive index (nCH3CN = 1.344 and nC2H5OH = 1.361), Pexc is the power intensity of the excitation source at the excitation wavelength and hνexc is the energy of the incident photon at frequency νexc = (c/λexc) so that Iexc = Pexc/hνexc is the spectral radiant power measuring the incident excitation intensity.31b,39 The introduction of a multiplicative factor of 2 takes into account the maximum 50% efficiency of upconversion.40
 | (2) |
![[small nu, Greek, tilde]](https://www.rsc.org/images/entities/i_char_e0e1.gif) exc = 12
exc = 12![[thin space (1/6-em)]](https://www.rsc.org/images/entities/char_2009.gif) 284 cm−1) and using an incident pump intensity P = 21 W cm−2 in acetonitrile solution (c ∼10 mM) at 298 K
284 cm−1) and using an incident pump intensity P = 21 W cm−2 in acetonitrile solution (c ∼10 mM) at 298 K
| Compound | A 801 nm | E | Φ up |
|---|---|---|---|
| a Optical density at 801 nm. b Integrated emission spectrum. c Calculated with respect to indocyanine green (ICG, λexc = 801 nm, Φr = 0.132 in ethanol at 298 K).38 | |||
| [Er(L1)3](ClO4)3 | 7.0 × 10⁻³ | 365(18) | 1.6(3) × 10−8 |
| [Er(L2)3](ClO4)3 | 5.9 × 10⁻³ | 78(4) | 4.1(5) × 10−9 |
| [Er(L3)3](ClO4)3 | 5.3 × 10⁻³ | 78(4) | 4.6(5) × 10−9 |
| [Er(L4)3](ClO4)3 | 4.4 × 10⁻³ | 55(3) | 3.9(4) × 10−9 |
The magnitude of the upconverted quantum yields 3 × 10⁻⁹ < Φup < 2 × 10⁻⁸ calculated for the ESA mechanisms operating in [Er(Lk)3]3+ in acetonitrile is comparable with Φup ∼2 × 1.4 × 10−8 = 2.8 × 10⁻⁸ reported for cooperative upconversion achieved by Charbonnière and co-workers in the trinuclear complex [Tb(YbL)2] dissolved in deuterated water (Fig. 1e).31b Despite the advantage of optimizing sensitization in [Tb(YbL)2] with the help of peripheral Yb(III) complexes and the operation of an ETU-type mechanism, the lack of a real intermediate excited state working as a relay on the Tb(III) activator is a severe limitation for final upconversion, a drawback duly mentioned by Auzel in his seminal review when discussing cooperative upconversion.9a However, the quantum yields collected in Table 1 demonstrate that the extended ligand L1, which moves the high-energy C–H oscillators away from the Er(III) center by circa 10%, simultaneously improves the Er(4I13/2) intermediate lifetime (5.57(6) μs, solid state 298 K)32 and upconversion quantum yields in [Er(L1)3]3+ (1.6(3) × 10−8) compared with terpyridine ligands in [Er(Lk)3]3+ (Lk = L2–L4; 1.88 μs ≤ τ(Er(4I13/2)) ≤ 2.18 μs and 3.9(4) × 10−9 ≤ τ(Er(4I13/2)) ≤ 4.6(5) × 10−9).
Related linear upconverted visible signals at 542 nm (Er(4S3/2 → 4I15/2)) and 522 nm (Er(2H11/2 → 4I15/2)) can be induced in solution (Fig. 8) or in the solid state (Fig. S13 and S14†) via Er-centered excitation of the Er(4I11/2 ← 4I15/2) transition at 966 nm and using power intensities in the 1–78 W cm−2 range. Again, the upconversion process is more efficient in [Er(L1)3]3+, when extended 2,6-bis-(benzimadol-2-yl)pyridine ligands are wrapped around Er(III) instead of terpyridines in [Er(Lk)3]3+ (Lk = L2–L4; Fig. 8). In the absence of easily accessible organic dyes with well-established quantum yields following excitation at 966 nm, we did not monitor absolute quantum yields at this excitation wavelength. As previously discussed when analyzing downshifting processes (see the mechanism in Fig. 4b), excitation of the Er(4I11/2 ← 4I15/2) transition at 966 nm results in multiple successive linear excitations prior to reaching the intermediate Er(4I13/2) relay, thus leading to slopes within the 3.0–4.0 range for the linear log(I)–log(P) plots characterizing the ultimate upconversion processes (Fig. S13 and S14†). The minimum slopes of 2.6–2.7 are still compatible with two- and three-photon processes which avoid the use of the Er(4I13/2) intermediate excited state as a relay (Fig. 7b, left). However, the most frequent slopes reach 3.0–4.0 and imply at least one additional successive linear excitation and a 4-phonon mechanism, which is a logical consequence of the involvement of the intermediate Er(4I13/2) level as a relay (Fig. 7b right). The lack of efficient non-radiative Er(4I11/2) ⇒ Er(4I13/2) relaxation (ΔE ∼3700 cm−1), previously responsible for the unusual 2-phonon downshifting mechanism observed in these complexes following 966 nm excitation (Fig. 4b), appears to be a severe handicap for exploiting the ‘long-lived’ (2–6 μs at 298 K)32 intermediate Er(4I13/2) excited level as a relay for promoting visible upconversion (Fig. 7b). Finally, excitations at 966 nm of the Er(4I11/2 ← 4I15/2) transition exhibit some standard decreases of the upconverted intensities with increasing temperatures (Fig. S15†).
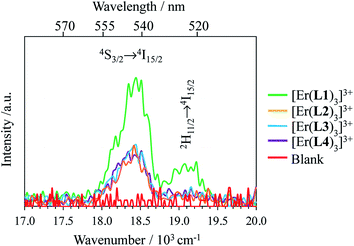 | ||
Fig. 8 Upconverted visible Er(2H11/2 → 4I15/2) and Er(4S3/2 → 4I15/2) emissions observed for [Er(Lk)3]3+ (Lk = L1–L4) complexes recorded upon laser excitation of the Er(4I11/2 ← 4I15/2) transition at λexc = 966 nm (![[small nu, Greek, tilde]](https://www.rsc.org/images/entities/i_char_e0e1.gif) exc = 10 exc = 10![[thin space (1/6-em)]](https://www.rsc.org/images/entities/char_2009.gif) 350 cm−1) and using an incident pump intensity P = 78 W cm−2 in acetonitrile solution (c ∼10 mM, Table S1†) at 298 K. The blank (red curve) was recorded from pure acetonitrile solvent using an incident pump intensity P = 78 W cm−2. 350 cm−1) and using an incident pump intensity P = 78 W cm−2 in acetonitrile solution (c ∼10 mM, Table S1†) at 298 K. The blank (red curve) was recorded from pure acetonitrile solvent using an incident pump intensity P = 78 W cm−2. | ||
Conclusions
Upon ligand-centered or erbium-centered optical excitation, the series of nine-coordinate mononuclear triple-helical erbium(III) complexes [Er(Lk)3]3+ (Lk = L1–L4) all exhibit the expected downshifted near-infrared emission at 1515 nm, which originates from the lowest-energy Er(4I13/2) excited level (solid state and solution, 10–298 K). While single photon mechanisms characterize sensitization via ligand-centered π* ← π light absorption at 401 nm or erbium-centered Er(4I9/2 ← 4I15/2) absorption at 801 nm, the lack of efficient non-radiative Er(4I11/2) ⇒ Er(4I13/2) relaxation in these complexes results in unusual two-photon downshifting mechanisms upon Er(4I11/2 ← 4I15/2) excitation at 966 nm. Because of vibrational quenching of the near-infrared Er(4I13/2 → 4I15/2) transition with high-energy oscillators, the Er(4I13/2) lifetime is reduced by an approximate factor of three when terminal benzimidazoles in [Er(L1)3]3+ (closest intramolecular Er⋯H distance = 3.86 Å) are replaced with pyridines in [Er(Lk)3]3+ (Lk = L2–L4; closest intramolecular Er⋯H distance = 3.42 Å). With these photophysical characteristics in mind, the induction of blue-green visible upconverted signals upon erbium-centered excitation of molecular [Er(Lk)3]3+ (Lk = L1–L4) complexes using reasonable power intensities (1–50 W cm−2) is logically more efficient in [Er(L1)3]3+ and corresponds to a two-photon mechanism for erbium-centered Er(4I9/2 ← 4I15/2) excitation at 801 nm and to multiple-photon processes (3–4 photons) for Er(4I11/2 ← 4I15/2) excitation at 966 nm. Although weak, the associated quantum yields recorded in acetonitrile (0.4 × 10⁻⁸ ≤ Φup ≤ 1.6 × 10⁻⁸ for λexc = 801 nm) favorably compare with quantitative data reported for molecular upconversion using multi-center cooperative upconversion in deuterated water.31b Taking the ESA mechanism operating in these [Er(Lk)3]3+ complexes as the ‘zero-level’ of efficiency of molecular upconversion, we should remember that Auzel taught us that optimised sensitisation followed by energy transfer according to the ETU mechanism with the help of adapted sensitizers in SA diads (S = sensitizer, A = lanthanide activator) may improve the upconversion output by two orders of magnitude.8,9 Additionally, moving from molecular SA diads to SAS triads, where S is a long-lived sensitizer (i.e. millisecond lifetimes as observed in Cr(III) complexes) may theoretically further improve upconversion by more than three orders of magnitude.20 Altogether, the connection of two adapted long-lived sensitizers on each side of a central Er(III) activator to give a structure similar to that shown in Fig. 1a is expected to increase the quantum yield by roughly five orders of magnitude compared to the ESA mechanism, thus reaching 0.1% efficiency as an upper limit for molecular upconversion using the ETU mechanism. Further optimization exploiting standard perdeuteration41 or perfluorination42 could be used as wildcards for final tuning. Interestingly, Er(III) protection from high-energy oscillators is helpful, but not sufficient, to design coordination complexes programmed for molecular upconversion. For instance, closely related 1![[thin space (1/6-em)]](https://www.rsc.org/images/entities/char_2009.gif) :
:![[thin space (1/6-em)]](https://www.rsc.org/images/entities/char_2009.gif) 2 complexes [Er(L5)2(CF3SO3)2](CF3SO3)·2CH3CN (L5 is identical to L1, except for the removal of the peripheral ethyl groups; closest Er⋯H contact distance = 3.70 Å, see Fig. S16†) and [Er(L4)2(CF3SO3)2](CF3SO3)·1.5C2H5CN (closest Er⋯H contact distance = 3.40 Å) did not exhibit upconverted signals.32 In this context, it is worth remembering here that solid films of Na3[Er(2,6 dipicolinate)3]·xH2O (x = 13–15), i.e. the most simple triple helical Er(III) complex with rather long intramolecular Er⋯H distances of 5.37 Å, also failed in providing either downshifting or upconversion processes in the solid state.21 A careful look at the crystal structures of the latter complexes43 shows that interstitial water molecules accumulate along the threefold axis of the [Ln(2,6 dipicolinate)3]3− activators, thus leading to shorter intermolecular Er⋯H distances around 3.56 Å, an organization which appears to be incompatible with the detection of any radiative signals following excitation.
2 complexes [Er(L5)2(CF3SO3)2](CF3SO3)·2CH3CN (L5 is identical to L1, except for the removal of the peripheral ethyl groups; closest Er⋯H contact distance = 3.70 Å, see Fig. S16†) and [Er(L4)2(CF3SO3)2](CF3SO3)·1.5C2H5CN (closest Er⋯H contact distance = 3.40 Å) did not exhibit upconverted signals.32 In this context, it is worth remembering here that solid films of Na3[Er(2,6 dipicolinate)3]·xH2O (x = 13–15), i.e. the most simple triple helical Er(III) complex with rather long intramolecular Er⋯H distances of 5.37 Å, also failed in providing either downshifting or upconversion processes in the solid state.21 A careful look at the crystal structures of the latter complexes43 shows that interstitial water molecules accumulate along the threefold axis of the [Ln(2,6 dipicolinate)3]3− activators, thus leading to shorter intermolecular Er⋯H distances around 3.56 Å, an organization which appears to be incompatible with the detection of any radiative signals following excitation.
Conflicts of interest
There are no conflicts to declare.Acknowledgements
Financial support from the Swiss National Science Foundation is gratefully acknowledged.References
- (a) J. Kerr, Philos. Mag., 1875, 50, 337–348 CrossRef; (b) J. Kerr, J. Phys. Theor. Appl., 1879, 8, 414–418 CrossRef.
- M. Goeppert-Mayer, Ann. Phys., 1931, 401, 273–294 CrossRef.
- P. A. Franken, A. E. Hill, C. W. Peters and G. Weinreich, Phys. Rev. Lett., 1961, 7, 118–119 CrossRef.
- W. Kaiser and C. G. B. Garrett, Phys. Rev. Lett., 1961, 7, 229–231 CrossRef CAS.
- T. H. Maiman, Nature, 1960, 187, 493–494 CrossRef.
- (a) P. Neveu, I. Aujard, C. Benbrahim, T. Le Saux, J.-F. Allemand, S. Vriz, D. Bensimon and L. Jullien, Angew. Chem., Int. Ed., 2008, 47, 3744–3746 CrossRef CAS PubMed; (b) C. Andraud and O. Maury, Eur. J. Inorg. Chem., 2009, 4357–4371 CrossRef CAS; (c) R. Medishetty, J. K. Zareba, D. Mayer, M. Samoc and R. A. Fischer, Chem. Soc. Rev., 2017, 46, 4976–5004 RSC; (d) T. N. Nguyen, F. Ebrahim and K. C. Stylianou, Coord. Chem. Rev., 2018, 377, 259–306 CrossRef CAS.
- N. Bloembergen, Phys. Rev. Lett., 1959, 2, 84–85 CrossRef CAS.
- (a) F. Auzel, C. R. Acad. Sci., 1966, B262, 1016–1019 Search PubMed; (b) F. Auzel, C. R. Acad. Sci., 1966, B263, 819–821 Search PubMed.
- (a) F. Auzel, Chem. Rev., 2004, 104, 139–173 CrossRef CAS PubMed; (b) B. M. van der Ende, L. Aarts and A. Meijerink, Phys. Chem. Chem. Phys., 2009, 11, 11081–11095 RSC; (c) X. Huang, S. Han, W. Huang and X. Liu, Chem. Soc. Rev., 2013, 42, 173–201 RSC; (d) J.-C. G. Bünzli and A.-S. Chauvin, Handbook on the Physics and Chemistry of Rare Earths, ed. J-C. G. Bünzli and V. K. Pecharsky, Elsevier North Holland, Amsterdam, 2014; vol. 44, pp. 169–281 Search PubMed; (e) S. Ye, E.-H. Song and Q.-Y. Zhang, Adv. Sci., 2016, 3, 1600302 CrossRef PubMed.
- (a) R. Martin-Rodriguez, S. Fischer, A. Ivaturi, B. Froehlich, K. W. Krämer, J. C. Goldschmidt, B. S. Richards and A. Meijerink, Chem. Mater., 2013, 25, 1912–1921 CrossRef CAS; (b) R. Page, K. Schaffers, P. Waide, J. Tassano, S. Payne, W. Krupke and W. Bischel, J. Opt. Soc. Am. B, 1998, 996–1008 CrossRef CAS.
- (a) Y. Liu, D. Tu, H. Zhu and X. Chen, Chem. Soc. Rev., 2013, 42, 6924–6958 RSC; (b) G. Chem, H. Qiu, P. N. Prasad and X. Chen, Chem. Rev., 2014, 114, 5161–5214 CrossRef PubMed; (c) S. Gai, C. Li, P. Yang and J. Lin, Chem. Rev., 2014, 114, 2343–2389 CrossRef CAS PubMed; (d) L.-D. Sun, Y.-F. Wang and C.-H. Yan, Acc. Chem. Res., 2014, 47, 1001–1009 CrossRef CAS PubMed; (e) D. C. Rodriguez Burbano, R. Naccache and J. A. Capobianco, Handbook on the Physics and Chemistry of Rare Earths, ed. K. A. Gschneidne Jr, J.-C. G. Bünzli and V. K. Pecharsky, Elsevier Science, Amsterdam, 2015, vol. 47, pp. 273–352 Search PubMed; (f) X. Zhu, Q. Su, W. Feng and F. Li, Chem. Soc. Rev., 2017, 46, 1025–1039 RSC.
- (a) C. Strohhofer and A. Polman, J. Appl. Phys., 2001, 90, 4314–4320 CrossRef CAS; (b) P. G. Kik and A. Polman, J. Appl. Phys., 2003, 93, 5008–5012 CrossRef CAS.
- (a) Y. Zhang, L. Zhang, R. Deng, J. Tian, D. Jin and X. Liu, J. Am. Chem. Soc., 2014, 136, 4893–4896 CrossRef CAS PubMed; (b) J.-C. G. Bünzli, Eur. J. Inorg. Chem., 2017, 5058–5063 CrossRef.
- (a) R. M. Macfarlane, J. Lumin., 1990, 45, 346–350 CrossRef; (b) W. Lenth and R. M. Macfarlane, Opt. Photonics News, 1992, 3, 8–15 CrossRef; (c) R. Scheps, Prog. Quantum Electron., 1996, 20, 271–358 CrossRef CAS; (d) E. Downing, L. Hesselink, J. Ralston and R. M. Macfarlane, Science, 1996, 273, 185–1189 CrossRef.
- C. Strohhöfer and A. Polman, Opt. Mater., 2003, 21, 705–712 CrossRef.
- D. R. Gamelin and H. U. Güdel, Acc. Chem. Res., 2000, 33, 235–242 CrossRef CAS PubMed.
- (a) M. Haase and H. Schäfer, Angew. Chem., Int. Ed., 2011, 50, 5808–5829 CrossRef CAS PubMed; (b) J. Zhou, Q. Liu, W. Feng, Y. Sun and F. Li, Chem. Rev., 2015, 115, 395–465 CrossRef CAS PubMed.
- J.-C. Boyer and F. C. J. M. van Veggel, Nanoscale, 2010, 2, 1417–1419 RSC.
- (a) S. Han, R. Deng and X. Liu, Angew. Chem., Int. Ed., 2014, 53, 11702–117151 CrossRef CAS PubMed; (b) D. M. Wu, A. Garcia-Etxarri, A. Salleo and J. A. Dionne, J. Phys. Chem. Lett., 2014, 5, 4020–4031 CrossRef CAS PubMed.
- Y. Suffren, B. Golesorkhi, D. Zare, L. Guénée, H. Nozary, S. V. Eliseeva, S. Petoud, A. Hauser and C. Piguet, Inorg. Chem., 2016, 55, 9964–9972 CrossRef CAS PubMed.
- C. Reinhard and H. U. Güdel, Inorg. Chem., 2002, 41, 1048–1055 CrossRef CAS PubMed.
- X. Xiao, J. P. Haushalter and G. W. Faris, Opt. Lett., 2005, 30, 1674–1676 CrossRef CAS PubMed.
- O. A. Blackburn, M. Tropiano, T. J. Sorensen, J. Thom, A. Beeby, L. M. Bushby, D. Parker, L. Natrajan and S. Faulkner, Phys. Chem. Chem. Phys., 2012, 14, 13378–13384 RSC.
- (a) T. N. Singh-Rachford and F. N. Castellano, Coord. Chem. Rev., 2010, 254, 2560–2573 CrossRef CAS; (b) A. Monguzzi, R. Tubino, S. Hoseinkhani, M. Campione and F. Meinardi, Phys. Chem. Chem. Phys., 2012, 14, 4322–4332 RSC; (c) T. W. Schmidt and F. N. Castellano, J. Phys. Chem. Lett., 2014, 5, 4062–4072 CrossRef CAS PubMed; (d) V. Gray, K. Moth-Poulsen, B. Albinsson and M. Abrahamsson, Coord. Chem. Rev., 2018, 362, 54–71 CrossRef CAS.
- L. J. Charbonnière, Dalton Trans., 2018, 47, 8566–8570 RSC.
- (a) M. Pollnau, D. R. Gamelin, S. R. Lüthi and H. U. Güdel, Phys. Rev., 2000, B61, 3337–3346 CrossRef; (b) J. F. Suyver, A. Aebischer, S. Garcia-Revilla, P. Gerner and H. U. Güdel, Phys. Rev. B, 2005, 71, 125123 CrossRef; (c) M. T. Berry and P. S. May, J. Phys. Chem. A, 2015, 119, 9805–9811 CrossRef CAS PubMed.
- (a) D. Weng, X. Zheng, X. Chen, L. Li and L.-P. Jin, Eur. J. Inorg. Chem., 2007, 3410–3415 CrossRef CAS; (b) C.-Y. Sun, X.-J. Zheng, X.-B. Chen and L.-P. Jin, Inorg. Chim. Acta, 2009, 362, 325–330M CrossRef CAS; (c) X. Zhang, B. Li, H. Ma, L. Zhang and H. Zhao, ACS Appl. Mater. Interfaces, 2016, 8, 17389–17394 CrossRef CAS PubMed; (d) T. V. Balashova, A. P. Pushkarev, A. N. Yablonskiy, B. A. Andreev, I. D. Grishin, R. V. Rumyantcev, G. K. Fukin and M. N. Bochkarev, J. Lumin., 2017, 192, 208–210 CrossRef CAS; (e) M. Li, S. Gui, D. Tian, E. Zhou, Y. Wang, Y.-F. Han, L. Yin and L. Huang, Dalton Trans., 2018, 47, 12868–12872 RSC.
- (a) L. Aboshyan-Sorgho, C. Besnard, P. Pattison, K. R. Kittilstved, A. Aebischer, J.-C. G. Bünzli, A. Hauser and C. Piguet, Angew. Chem., Int. Ed., 2011, 50, 4108–4112 CrossRef CAS PubMed; (b) Y. Suffren, D. Zare, S. V. Eliseeva, L. Guénée, H. Nozary, T. Lathion, L. Aboshyan-Sorgho, S. Petoud, A. Hauser and C. Piguet, J. Phys. Chem. C, 2013, 117, 26957–26963 CrossRef CAS; (c) D. Zare, Y. Suffren, L. Guénée, S. V. Eliseeva, H. Nozary, L. Aboshyan-Sorgho, S. Petoud, A. Hauser and C. Piguet, Dalton Trans., 2015, 44, 2529–2540 RSC.
- I. Hyppänen, S. Lahtinen, R. Äritalo, J. Mäkelä, J. Kankare and T. Soukka, ACS Photonics, 2014, 1, 394–397 CrossRef.
- A. Nonat, C. F. Chan, C. Platas-Iglesias, Z. Liu, W.-T. Wong, W.-K. Wong, K.-L. Wong and L. J. Charbonnière, Nat. Commun., 2016, 11978 CrossRef CAS PubMed.
- (a) N. Souri, P. Tian, C. Platas-Iglesias, K.-L. Wong, A. Nonat and L. J. Charbonnière, J. Am. Chem. Soc., 2017, 139, 1456–1459 CrossRef CAS PubMed; (b) A. Nonat, S. Bahamyirou, A. Lecointre, F. Przybilla, Y. Mély, C. Platas-Iglesias, F. Camerel, O. Jeannin and L. J. Charbonnière, J. Am. Chem. Soc., 2019, 141, 1568–1576 CrossRef CAS PubMed.
- B. Golesorkhi, L. Guénée, H. Nozary, A. Fürstenberg, Y. Suffren, S. V. Eliseeva, S. Petoud, A. Hauser and C. Piguet, Chem.–Eur. J., 2018, 24, 13158–13169 CrossRef CAS PubMed.
- B. Golesorkhi, H. Nozary, L. Guénée, A. Fürstenberg and C. Piguet, Angew. Chem., Int. Ed., 2018, 57, 15172–15176 CrossRef CAS PubMed.
- J. A. A. Ketelaar, Physica, 1937, 4, 619–630 CrossRef CAS.
- E. Kreidt, C. Kruck and M. Seitz, Handbook on the Physics and Chemistry of Rare Earths, ed. J-C. G. Bünzli and V. K. Pecharsky, Elsevier Science, Amsterdam, 2018, vol. 53, pp. 35–79 Search PubMed.
- S. Rigault, C. Piguet, G. Bernardinelli and G. Hopfgartner, J. Chem. Soc., Dalton Trans., 2000, 4587–4600 RSC.
- Z. Chouahda, J. P. Jouart, T. Duvaut and M. Diaf, J. Phys.: Condens. Matter, 2009, 21, 245504 CrossRef CAS PubMed.
- K. Rurack and M. Spieles, Anal. Chem., 2011, 83, 1232–1242 CrossRef CAS PubMed.
- J. Verhoeven, Pure Appl. Chem., 1996, 68, 2283–2286 Search PubMed.
- V. Gray, D. Dzebo, M. Abramhamsson, B. Albinsson and K. Moth-Poulsen, Phys. Chem. Chem. Phys., 2014, 16, 10345–10352 RSC.
- C. Doffek and M. Seitz, Angew. Chem., Int. Ed., 2015, 54, 9719–9721 CrossRef CAS PubMed.
- G. Mancino, A. J. Ferguson, A. Beeby, N. J. Long and T. S. Jones, J. Am. Chem. Soc., 2005, 127, 524–525 CrossRef CAS PubMed.
- (a) J. Albertsson, Acta Chem. Scand., 1972, 26, 1023–1044 CrossRef CAS; (b) N. Hojnik, M. Kristl, A. Golobič, Z. Jagličić and M. Drofenik, J. Mol. Struct., 2015, 1079, 54–60 CrossRef CAS; (c) S. M. Elahi and M. V. Rajasekharan, ChemistrySelect, 2016, 1, 6515–6522 CrossRef.
Footnote |
| † Electronic supplementary information (ESI) available. See DOI: 10.1039/c9sc02068c |
| This journal is © The Royal Society of Chemistry 2019 |

