
 Open Access Article
 This Open Access Article is licensed under a Creative Commons Attribution-Non Commercial 3.0 Unported Licence
Expanding the mass range for UVPD-based native top-down mass spectrometry†
Jean-François
Greisch
 ab,
Sem
Tamara
ab,
Richard A.
Scheltema
ab,
Howard W. R.
Maxwell
c,
Robert D.
Fagerlund
c,
Peter C.
Fineran
c,
Stephan
Tetter
d,
Donald
Hilvert
d and
Albert J. R.
Heck
*ab
ab,
Sem
Tamara
ab,
Richard A.
Scheltema
ab,
Howard W. R.
Maxwell
c,
Robert D.
Fagerlund
c,
Peter C.
Fineran
c,
Stephan
Tetter
d,
Donald
Hilvert
d and
Albert J. R.
Heck
*ab
aBiomolecular Mass Spectrometry and Proteomics, Bijvoet Center for Biomolecular Research, Utrecht Institute of Pharmaceutical Sciences, Utrecht University, Padualaan 8, 3584 Utrecht, The Netherlands. E-mail: a.j.r.heck@uu.nl
bNetherlands Proteomics Center, Padualaan 8, 3584 Utrecht, The Netherlands
cDepartment of Microbiology and Immunology, University of Otago, PO Box 56, 9054 Dunedin, New Zealand
dLaboratory of Organic Chemistry, Department of Chemistry and Applied Biosciences, ETH Zürich, Vladimir-Prelog-Weg 1-5/10, 8093 Zürich, Switzerland
First published on 1st July 2019
Abstract
Native top-down mass spectrometry is emerging as a methodology that can be used to structurally investigate protein assemblies. To extend the possibilities of native top-down mass spectrometry to larger and more heterogeneous biomolecular assemblies, advances in both the mass analyzer and applied fragmentation techniques are still essential. Here, we explore ultraviolet photodissociation (UVPD) of protein assemblies on an Orbitrap with extended mass range, expanding its usage to large and heterogeneous macromolecular complexes, reaching masses above 1 million Da. We demonstrate that UVPD can lead not only to the ejection of intact subunits directly from such large intact complexes, but also to backbone fragmentation of these subunits, providing enough sequence information for subunit identification. The Orbitrap mass analyzer enables simultaneous monitoring of the precursor, the subunits, and the subunit fragments formed upon UVPD activation. While only partial sequence coverage of the subunits is observed, the UVPD data yields information about the localization of chromophores covalently attached to the subunits of the light harvesting complex B-phycoerythrin, extensive backbone fragmentation in a subunit of a CRISPR-Cas Csy (type I–F Cascade) complex, and sequence modifications in a virus-like proteinaceous nano-container. Through these multiple applications we demonstrate for the first time that UVPD based native top-down mass spectrometry is feasible for large and heterogeneous particles, including ribonucleoprotein complexes and MDa virus-like particles.
Introduction
Native mass spectrometry involves characterizing ions retaining (in part) their quaternary structure extracted from a (physiological) solution.1–4 For ions with lower charge states, electrospray ionization has been shown to preserve enough of the structure in the gas phase for proteins to even display biological activity upon rehydration.5 Using primarily volatile aqueous high ionic strength components, such as ammonium acetate, “intact” native proteins and protein complexes ranging from small proteins such as myoglobin and antibodies up to intact ribosomes,6 circadian clock systems,7 viruses,8 and ATPases9 have been successfully investigated.The advent of high-resolution mass analyzers with a dynamic range of several orders of magnitude extending in mass range from approximately m/z 100 to m/z 80k have now enabled mass spectrometric techniques to resolve composition and heterogeneities; determine binding stoichiometries, specificities, and relative binding affinities; and probe the dynamics of interactions, assembly interfaces, and structural arrangements. For applications in structural biology, native mass spectrometry is increasingly complementing X-ray crystallography, NMR spectrometry, and cryo-EM.10–12
Top-down proteomics, on the other hand, focuses on the identification and quantification of proteoforms, which include sequence variants and post-translational modifications, from the fragments produced upon the cleavage of their backbone.13 With the advance in mass range and growth in the complexity of the analytes, native and top-down approaches are now merging, leading to a constant drive to push the boundaries of native top-down fragmentation methods.14 For protein complexes of more than 100 kDa, a marked preference has been observed, until now, for collision induced dissociation (CID/HCD).6 While recent developments involving surface-induced dissociation (SID) have yielded inter-subunit connectivity and topology for intact complexes,15 collisional activation often leads primarily to the ejection of intact monomeric subunits. Extensive backbone fragmentation is usually not achieved for large complexes, such as those studied here, even for the highest collision energies. Furthermore, when achieved, it often does not provide sufficient sequence coverage of the ejected subunits for identification and characterization, with the exception of the so-called pseudo-MS3 approach which involves disassembling complexes in the source region prior to mass selection.16,17 Likewise, electron capture dissociation (ECD) and electron transfer dissociation (ETD), performed without additional collisional activation, primarily lead to extensive charge reduction without substantial fragmentation.18 Among photodissociation techniques, infrared multiphoton dissociation (IRMPD), as previously implemented on ToF and FT-ICR instruments,19 was also found to be best suited for subunit ejection, without further fragmentation of these subunits.
Pioneered largely by the Brodbelt group,20 ultraviolet photodissociation (UVPD) is an emerging alternative to previous dissociation methods. The present work further explores the boundaries of native top-down MS on an Orbitrap mass spectrometer with extended mass range using 193 nm ultraviolet laser pulses. UVPD, potentially the most versatile method, has so far primarily been used for monomers and simple oligomers typically with a molecular mass (Mw) below 200 kDa.21–23 To demonstrate the benefits of native top-down UVPD MS to the characterization of large protein assemblies, we have investigated the gas-phase photodissociation of three distinct high-mass assemblies. The first is B-phycoerythrin (B-PE) from Porphyridium cruentum – a 265 kDa hetero-multimeric α6β6γ protein sub-complex of the light harvesting phycobilisome assembly, and one of the brightest fluorescent protein assemblies known to date. The second assembly we investigated is the type I–F CRISPR-Cas Csy ribonucleoprotein complex of Pectobacterium atrosepticum SCRI1043 – a 347 kDa heterogeneous complex consisting of 9 proteins subunits: Cas8f/Cas5/(Cas7)6/Cas6f and a single ∼19 kDa CRISPR RNA (crRNA) strand.24–26 The third system explored is a virus-like particle, termed AaLS. This particle is built from the Aquifex aeolicus lumazine synthase (AaLS) protein, which is a thermostable 17 kDa enzyme that assembles into virus-like icosahedral protein cages containing 60 identical subunits with a T = 1 triangulation number,27 exhibiting a Mw of ∼1 MDa for the intact particles.28,29
Overall, we show that different laser fluences lead, under optimal ion transfer conditions, to the observation of complementary dissociation pathways for protein assemblies reaching 1 MDa. At low fluences, the simultaneous detection of intact subunits and corresponding high m/z product ions enables the resolution of protein assemblies' composition and heterogeneities. As the fluence increases, optimal backbone cleavage conditions are reached yielding enough sequence coverage of the subunits to identify proteoforms.
Experimental
Cloning, expression and purification of the Csy complex
A plasmid (pPF1181) for crRNA expression was constructed by PCR-amplifying spacer 1 and flanking repeat motifs of the CRISPR array from P. atrosepticum SCRI1043 through extension of overlapping primers (primers PF2237 + PF2238) and cloning into pRSF-1b via NcoI and HindIII restriction sites. All primers are listed in Table S1.† A plasmid (pPF1286) for expression of proteins Cas8f (Csy1), Cas5 (Csy2), Cas7 (Csy3) and Cas6f (Csy4) was constructed by PCR-amplifying the operon between cas8f and cas6f (primers PF1455 + PF401) using P. atrosepticum genomic DNA as template and cloning the product into pQE-80LoriT via MfeI and PstI restriction sites. The cas8f gene was cloned to incorporate an N-terminal StrepII tag. Plasmid constructs were confirmed using DNA sequencing.The StrepII-tagged type I–F Csy complex was expressed in E. coli BL21(DE3) containing pPF1181 and pPF1286. Cultures were grown in LB with kanamycin (50 μg mL−1) and ampicillin (100 μg mL−1) at 37 °C and 180 rpm to an OD600 of 0.2, then transferred to 25 °C and grown until an OD600 of 0.4 to 0.5. When the desired OD600 was achieved, complex expression was induced with the addition of 1 mM isopropyl β-D-1-thiogalactopyranoside and incubated for 16 h at 25 °C and 180 rpm. Cells were harvested by centrifugation at 10![[thin space (1/6-em)]](https://www.rsc.org/images/entities/char_2009.gif) 000×g and 4 °C for 10 min, and every 1 g of cell paste was resuspended in 10 mL Csy lysis buffer (50 mM HEPES·NaOH, pH 7.5, 300 mM KCl, 5% glycerol, 1 mM dithiothreitol (DTT)) supplemented with 0.02 mg mL−1 DNase I, 0.1 mM phenylmethanesulfonyl flouride and one cOmplete EDTA free protease inhibitor tablet. Cells were lysed by French press (10000 psi) and the lysate was clarified by two rounds of centrifugation at 16000×g and 4 °C for 15 min. Up to 10 mL of clarified lysate was added per 1 mL column of Strep-Tactin resin (IBA), the column was washed with Csy lysis buffer, and eluted by the addition of Csy lysis buffer supplemented with 3 mM D-desthiobiotin. Eluted Csy complex was further purified by size exclusion chromatography (SEC) on a Superdex 200 purification column in Csy SEC buffer (20 mM HEPES·NaOH, pH 7.5, 100 mM KCl, 5% glycerol and 1 mM DTT). Type I–F Csy complex fractions were pooled and concentrated using a centrifugal concentrator (100000 Da MWCO; molecular weight cut off). Aliquots of the Csy complex were snap frozen with dry-ice ethanol and stored at −80 °C.
000×g and 4 °C for 10 min, and every 1 g of cell paste was resuspended in 10 mL Csy lysis buffer (50 mM HEPES·NaOH, pH 7.5, 300 mM KCl, 5% glycerol, 1 mM dithiothreitol (DTT)) supplemented with 0.02 mg mL−1 DNase I, 0.1 mM phenylmethanesulfonyl flouride and one cOmplete EDTA free protease inhibitor tablet. Cells were lysed by French press (10000 psi) and the lysate was clarified by two rounds of centrifugation at 16000×g and 4 °C for 15 min. Up to 10 mL of clarified lysate was added per 1 mL column of Strep-Tactin resin (IBA), the column was washed with Csy lysis buffer, and eluted by the addition of Csy lysis buffer supplemented with 3 mM D-desthiobiotin. Eluted Csy complex was further purified by size exclusion chromatography (SEC) on a Superdex 200 purification column in Csy SEC buffer (20 mM HEPES·NaOH, pH 7.5, 100 mM KCl, 5% glycerol and 1 mM DTT). Type I–F Csy complex fractions were pooled and concentrated using a centrifugal concentrator (100000 Da MWCO; molecular weight cut off). Aliquots of the Csy complex were snap frozen with dry-ice ethanol and stored at −80 °C.
B-phycoerythrin and wt-ALS samples
B-phycoerythrin, purified from the red algae Porphyridium cruentum, was obtained from the Cayman Chemical Company. The wt-AaLS capsid was purified in analogy to published protocols for the purification of AaLS-derived proteins lacking a His6 tag.30 An additional gel filtration step on a Superose 6 Increase 10/300 GL column (GE Healthcare) was included to eliminate higher order aggregates of multiple protein cages. All complexes were buffer exchanged to aqueous 150 mM NH4OAc (pH 6.8) using Amicon ultra centrifugal filters (Millipore, Merck KGaA, Germany) with a 10 kDa cutoff. As typical for native electrospray ionization, protein concentrations in between 1 and 5 μM (monomer concentration) were used.Native top-down MS
Native top-down MS of intact complexes was performed on a previously described extended mass range (EMR) Q-Exactive Orbitrap (Thermo Fisher Scientific, Bremen, Germany) with a mass range limited to m/z 24000.31 All samples were electrosprayed using gold-coated borosilicate capillaries pulled in-house. All spectra were acquired with a signal to noise cutoff corresponding to a 3.64 value of the “Noise threshold” parameter. Resolving powers of 4350 (transient length of 16 ms) or 8750 (transient length of 32 ms) at m/z 200 were used to resolve high m/z charge distributions. A resolving power of 140000 (transient length of 512 ms) at m/z 200 allowed isotopic resolution of the subunits charge states, enabling optimal deisotoping and charge deconvolution of the peptidic fragment peaks. The values of the Microscans and Averaging parameters are provided in Table S2.†
For the native top-down UVPD experiments, precursor ions were transferred to the HCD cell with a direct collision energy parameter set to 0 eV to prevent dissociation. The UVPD spectra were acquired using single 6 ns laser pulses at a wavelength of 193 nm and an energy of 0.5–4.5 mJ per pulse (ExciStar 500, Coherent, Santa Clara, CA, U.S.A.) as described in the next section. A major bottleneck that we had to tackle was the concomitant efficient transfer and detection of the macromolecular precursor ions, the ejected subunit ions, the complementary high m/z product ions, and the peptidic fragments formed. We therefore carefully adjusted the gas phase pressure in the HCD cell along with several trapping and transfer voltages. In more detail, the HCD cell trapping and extraction parameters were optimized for low nitrogen collision gas pressures to achieve efficient detection of the subunits and fragments. Specifically, the ions of interest were decelerated in the source region via reducing the Source DC Offset potential from 25–30 V to 2–5 V (for AaLS), as well as reducing the potential of the Injection Flatapole, Inter Flatapole lens, Bent Flatapole and Transfer Multipole to the lowest value enabling efficient transmission. Following mass selection in the linear quadrupole, the ions were transferred and stored in the HCD cell. The HCD cell behavior was enhanced by setting the “IonGun AxField Exit” parameter to −10 V and increasing the HCD Multipole DC-Purge potential to 27 V. This enabled efficient trapping and ejection of both low and high m/z ions under low pressure conditions.
Implementation of UVPD
UVPD was implemented on the extended mass range (EMR) Q-Exactive Orbitrap mass spectrometer essentially as described previously.23,32 Briefly, a CaF2 viewport was added to the back of the higher-energy collision dissociation (HCD) cell adjacent to the C-trap as well as a CaF2 window in lieu of the HCD cell electrometer to limit gas conductance. Coaxial adjustment of the 193 nm (6 ns pulses) laser beam with the HCD cell multipole, following its reduction by a 2 mm in diameter aperture, was achieved using a two-mirror periscope configuration. The instrument's Split Lens and HCD Exit test points were used to generate TTL trigger pulses for the laser using voltage comparators. An Arduino microcontroller was used to trigger the laser pulses 3 ms after injection into the HCD cell as determined from processing the signals of the test points. Optimal detection was observed using low pressure nitrogen as HCD collision and trapping gas. Pressure measurements were performed indirectly via monitoring the Ultra High Vacuum readout. In almost all experiments, to ensure a long enough observation time window for the dissociation processes, a detection delay (IonGun Time) of typically 150 ms was used without significantly affecting the duty cycle at a 140000 at m/z 200 resolution characterized by 512 ms transients. Shorter detection delays, down to 16 ms, yield similar results.
To achieve an optimal detection of the backbone fragment ions in the sequencing experiments, the precursor ions of a single charge state were isolated using a 50–150 m/z window. MS/MS experiments were performed with the following settings: Microscans set to 1, Averaging set to 0, typically 1000 scans recorded and subsequently averaged and 1 laser pulse of 0.5–4.5 mJ per pulse energy. Pulse energy inside the HCD cell is significantly lower and measured to correspond (upon exiting the cell) to be ∼30–130 μJ per pulse. While the beam size is ∼2 mm in diameter, its exact spatial energy profile is not well known. Assuming a uniform energy distribution, typical fluences range from 950 to 4200 μJ cm−2 leading to hundreds of photons being absorbed by proteins assemblies such as the AaLS capsid (see Table S3† for relevant quantities). While mentioning fluences, we report pulse energies as is common in the field.32,33
Data analysis
Preliminary charge and isotope deconvolution of the raw files involved conversion of the fragment ions to protonated monoisotopic masses. To this aim and following background subtraction using an asymmetric least squares smoothing, we used the Y.A.D.A. 2.0 tool34 (Pattern Lab for Proteomics) with the following parameters PPM of 20, stringency of 0.6, and “Is Profile” on. A lower intensity threshold was applied to eliminate low confidence assignments. The simplicity of type I–F Csy complex spectra, acquired using a Microscans parameter equal to 10, enabled manual processing.Following manual control, the monoisotopic singly charged spectra were assigned using an in-house developed software for peak assignments and processing of top-down data combined with Prosight Lite (v1.4.6) and the Fragment Ion Calculator (Institute for System Biology, Seattle). The fragment lists generated were sequentially analyzed against the known sequences of the proteins present in the complex of interest. Sequence assignment accommodated the major UVPD ion types (a, a + 1, b, c, x, x + 1, y − NH3, y − 1, y, z), as well as H2O and NH3 losses respectively from the C- and N-terminus of the parent ion. a − 1, b − 1, b + 1, c − 1, c + 1, x − 1, y + 1, z − 1, z + 1, d, v and w fragment ions were additionally considered in B-PE's case. A mass accuracy better than 5 ppm, following mass recalibration using internal calibrant ions, was used. Sequence coverage for a given protein was calculated as a percentage value resulting from the division of the total number of observed inter-residue cleavages (considering all ion series) by the total number of inter-residue bonds in the protein.
The relative abundances of the subunit fragment ions were determined using the UniDec 3.1.0 deconvolution software.35
To benchmark the false discovery rate (FDR) of fragment ion assignments in our fragmentation spectra, we searched the spectra against 200 different randomly scrambled sequences. The median sequence coverage percentage from the scrambled searches was used as a proxy for the false positive rate at the fragment assignment level.
Results and discussion
On the EMR Orbitrap used in this work (Fig. 1), the detectability of UVPD fragments originating from large protein complexes was improved via the reduction of the ions' kinetic energy prior to entering the HCD cell and the adjustment of the trapping conditions. Specifically, the ions of interest were decelerated in the source region by reducing the Source DC Offset potential from the standard 25 V to 2–5 V (for MDa wt-AaLS particles), as well as reducing the potential of the Injection Flatapole, Inter Flatapole lens, Bent Flatapole and Transfer Multipole to the lowest value enabling efficient transmission. While this can affect the desolvation of large complexes, the particularly soft conditions also aid in retaining as much as possible the solution-like structure in the gas phase.36 Most importantly this allows trapping of the precursor ions under low pressure conditions thereby enhancing detection of the fragments upon ejection from the HCD cell. The HCD cell behavior was enhanced by setting the IonGun AxField Exit to −10 V and increasing the HCD Multipole DC-Purge potential to an optimum of 27 V. The UV laser was triggered 3 ms after injection into the HCD cell. Optimal detection was observed using low pressure nitrogen as trapping gas. To ensure optimal detection of all product ions an observation time window – detection delay (IonGun Time) – of up to 150 ms was used.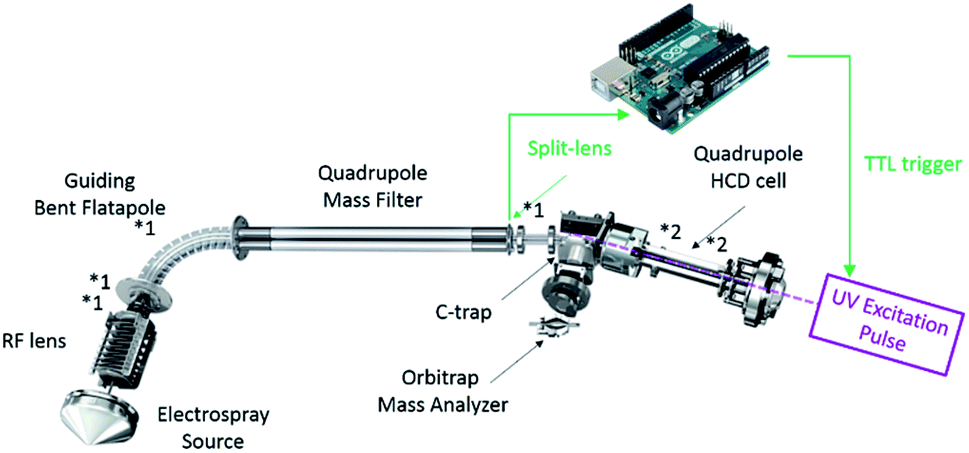 | ||
| Fig. 1 Schematic diagram of the used Orbitrap EMR instrument to which the UV-laser was coupled. The main parameters altered to optimize detection for large complex subunits and fragments formed thereof by UVPD are displayed with an asterisk: *1 for source-side deceleration of the ions of interest and *2 for trapping in and ejection from the HCD cell (see text for details). | ||
Native top-down UVPD-MS of B-phycoerythrin (B-PE)
Large protein complexes have reasonable absorption cross-sections in the ultraviolet range primarily due to the photo-absorptivity of amide bonds with additional contributions of the aromatic residues, tryptophan (W), tyrosine (Y), and phenylalanine (F). Further cross-section enhancement can be achieved via chromophore attachment.37 Consequently, we attempted our initial native top-down proteomics on a larger complex, originating from a natural light harvesting complex, whose natural chromophores can be expected to potentially enhance UVPD. B-phycoerythrin (B-PE) is a multimeric pigment protein, forming a major part of the peripheral antenna system of the phycobilisome (PBS) protein assembly in algae and cyanobacteria. Characterized by strong absorption bands between 460 and 580 nm in solution, B-PE is structurally similar to phycocyanin (PC) and allophycocyanin (APC), two other phycobiliproteins part of the phycobilisome energy cascade that display absorption bands more to the red. While all three differ by the nature and number of their chromophoric groups, their structures each consist of α and β monomers which arrange into (αβ) heterodimers before oligomerizing into a stack of two (αβ)3 discs with a central cavity hosting a single γ-subunit (Fig. 2b). The phycobiliproteins multimeric structure and ability to form stacks is suspected to be responsible for the phycobilisome's over 95% light harvesting and radiation-less energy transfer efficiencies.38 Phycoerythrobilins (PEB) and phycourobilins (PUB) are two tetrapyrrole prosthetic groups of B-PE covalently bound to cysteinyl residues of which only the first is present in all three subunits. Two PEBs are mono-linked to the α-unit as well as two others to the β-unit. Another PEB is bound to the β subunit via two links. The central γ-subunit potentially carries up to five additional bilins. While a detailed structural model was recently reported for the phycobilisome of Griffithsia pacifica based on cryo-EM data, the exact structural details of how up to five bilins are attached to the γ-subunit and placed with respect to each other to enable efficient energy transfer remains under investigation.39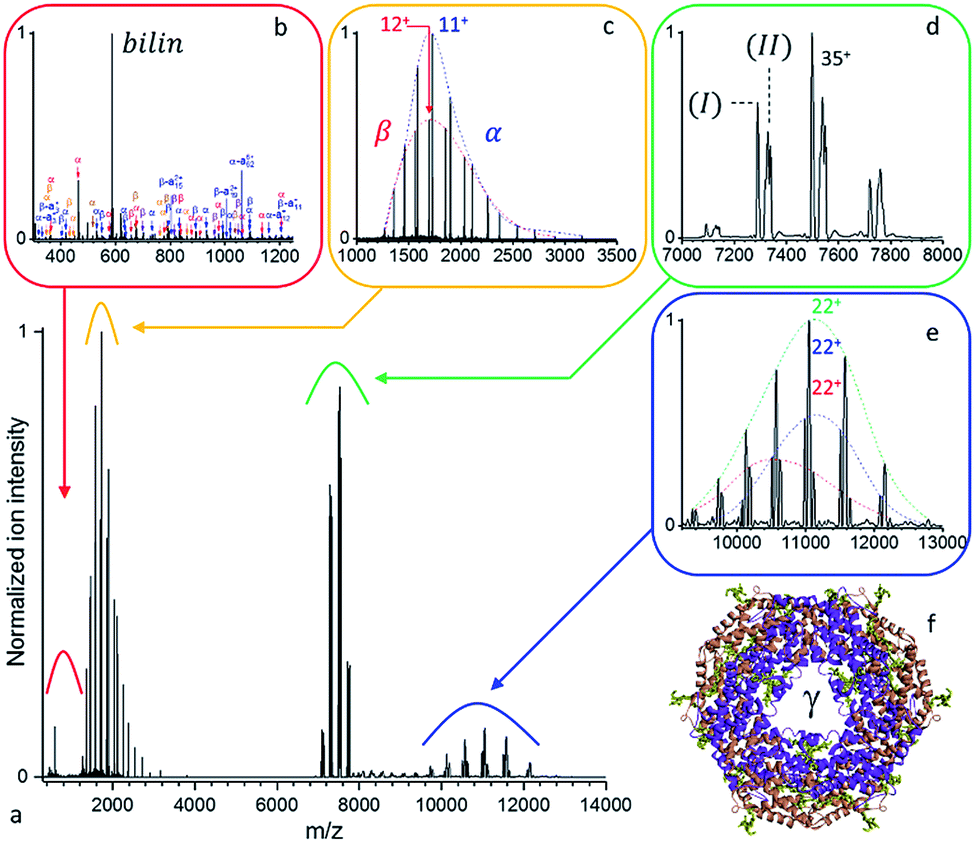 | ||
| Fig. 2 (a) Native top-down UVPD MS of mass selected B-PE ([37+–33+], 1.0 mJ per pulse, 3.2 10−10 mbar N2 readout, and resolution at m/z 200 of 4375 except for (b) 140000 and (d) 8750). (b) Free chromophores and (c) intact monomeric subunits resulting from the dissociation of the (d) precursor ions are detected together with the (e) concomitant higher m/z dissociation products. (f) Structural model of the B-phycoerythrin (αβ)6 barrel with the structurally non-resolved γ unit at the center and the PEB chromophores highlighted in mustard green. | ||
As displayed in Fig. S1,† the UVPD fluence has a substantial effect on B-PE dissociation at low nitrogen pressure in the HCD cell – a limited gas conductance was determined to be optimal in our setup. Essentially, at a given pressure, three regimes can be distinguished: (1) at low UV fluences (energies below 1.0 mJ per pulse), species with m/z larger than the precursor ion (8000 < m/z < 12000) are formed, which appear to be concomitant with intact monomeric sub-units detected at low m/z (1000 < m/z < 2000). (2) For medium range fluences (E between 1.0 and 1.5 mJ per pulse), monomeric subunit ejection dominates as dissociation channel. The α- and β-subunits are found to be ejected largely intact, with respectively 2 and 3 PEB chromophores attached, and upon dissociation of a single charge state (35+) at resolution 140000 at m/z 200 in close to stoichiometric ratios (100:86 for α:β) (Fig. S2†). The γ-subunit was not efficiently detected, likely due to its lower stoichiometry and inherent sequence heterogeneity. (3) In the higher fluence range (E above 1.5 mJ per pulse), peptide fragments are abundant and ultimately become the most prominent fragment ions. The observation of ejected intact chromophore ions (m/z 587) at all fluences for UVPD (Fig. S1†), but not for HCD/CID, suggests that they may selectively enhance local absorption, funneled locally into the selective elimination. Alternatively, they may be released as neutral fragments in HCD/CID.
A detailed analysis of the UVPD mass spectrum (Fig. 2) provides evidence of the coexistence of at least two populations of assemblies (Fig. 2d) with masses (I) 262377 ± 18 Da and (II) 263808 ± 22 Da. It should be noted that, at high m/z, micro-heterogeneities of a few hundred Da are not resolved, resulting in broad peaks representative of several assembly variants. These result from the sequence variability of the γ-unit threading the B-PE (αβ)6 barrel, as well as losses of bilins upon prolonged storage in an ammonium acetate buffer.40 Dissociation of the complex yields intact subunits in the low mass range (Fig. 2c) with average masses of 18977.4 ± 0.7 Da and 20327.8 ± 1.1 Da, respectively corresponding to α and β subunits respectively with 2 and 3 bilins bound. On the high m/z side (Fig. 2e), three concomitant charge distributions are observed with masses of 241692 ± 37 Da, 243060 ± 15 Da, and 244397 ± 128 Da. These respectively correspond to (I) minus β (242050 Da), (I) minus α (243399 Da) or (II) minus β (243481 Da), and (II) minus α (244830 Da), respectively (see Table S4† for a summary). PEB loss upon UVPD, mass 586.28 Da, can be seen in Fig. 2b. A comparable analysis, using a higher mass resolution (Fig. S2†) is provided as ESI.†
In terms of sequence coverage, optimal information content was obtained for B-PE upon fragmentation of the most abundant charge state at UV pulse energies of about 1.1 mJ per pulse, and N2 HCD pressures leading to a 2.37 10−10 mbar readout on the Ultra High Vacuum gauge (Fig. S3†). These conditions ensure that ions with a high sequential score, commonly over-fragmented at higher fluences, are retained while singly charged ions whose overlapping distributions hinder charge deconvolution and de-isotoping are kept to a minimum. Fragments could be mapped onto the α- and β-subunit sequences as shown in Fig. S3.† The resulting 38% and 29% sequence coverages reached for the α- and β-chains at a 5 ppm accuracy enable correct and unambiguous site assignment for the binding of 2 of the PEB chromophores: α-C139 and β-C158. Based on X-ray diffraction data,41 the α-subunit second binding site is wrongly annotated to be α-C59 in our data and should read α-C82. As for the β-subunit, while the other mono-linked β-C82 binding site goes undetected, of the two bridged cysteines, only β-C50 is correctly assigned from the available fragments. While the FDR achieved in this analysis for the α- and β-subunits is only 15%, due to the combined contributions of the α-, β-, and γ-subunits to the fragmentation spectra, the approach is highly promising for the characterization of proteoforms. This is particularly true if the disassembly of the complex into subunits is complemented by the isolation prior to activation of a subunit given proteoform, e.g. using a pseudo-MS3 approach.16,17
Native top-down UVPD-MS of a type I–F CRISPR-Cas Csy ribonucleoprotein complex
The next investigated complex is the CRISPR-Cas Csy (aka type I–F Cascade) complex, which is a non-coding RNA-guided surveillance complex of the P. atrosepticum SCRI1043. It has been selected both for the heterogeneity of its subunits and to demonstrate that chromophores are not essential to achieve efficient dissociation upon excitation at 193 nm.CRISPR-Cas systems provide adaptive immunity to bacteria and archaea.42 By recognizing and targeting foreign DNA, this type I–F Csy complex provides a sequence-specific protection to P. atrosepticum against foreign genetic elements, such as invading bacteriophages and plasmids.43,44 The destruction of the foreign DNA also requires the Cas2–3 nuclease/helicase that is recruited upon target DNA recognition by the type I–F Cascade. Using cryo-EM and biochemical analyses, the type I–F surveillance (Csy) complexes have been found to contain a 60-nucleotide crRNA.26,45,46 As illustrated in Fig. 3f and g, the head of the complex is the Cas6f protein which is located at the 3′ stem-loop of the cr-RNA and initiates assembly following pre-crRNA cleavage.25,47 Cas6f is followed along the length of the crRNA spacer by six interlocking copies of Cas7 forming a helical backbone. The complex tail consists of the Cas5 and Cas8f proteins. Initially in an ‘‘open’’ hook state, the Csy complex undergoes a transition to a ‘‘locked’’ state mediated by the Cas5 ‘‘hook’’ domain, which flexibly clamps onto dsDNA concomitantly with the Cas8f thumb domain. The Cas7 units, which rotate upon DNA binding, provide a stabilizing groove for the heteroduplex formation. Upon recognition of a short 2 base pair GG ‘‘protospacer adjacent motif’’ (PAM), hybridization of the crRNA with the target strand of DNA duplex occurs and a DNA:RNA R-loop is formed which triggers recruitment of the Cas2–3 endonuclease and subsequent degradation of the target dsDNA.46
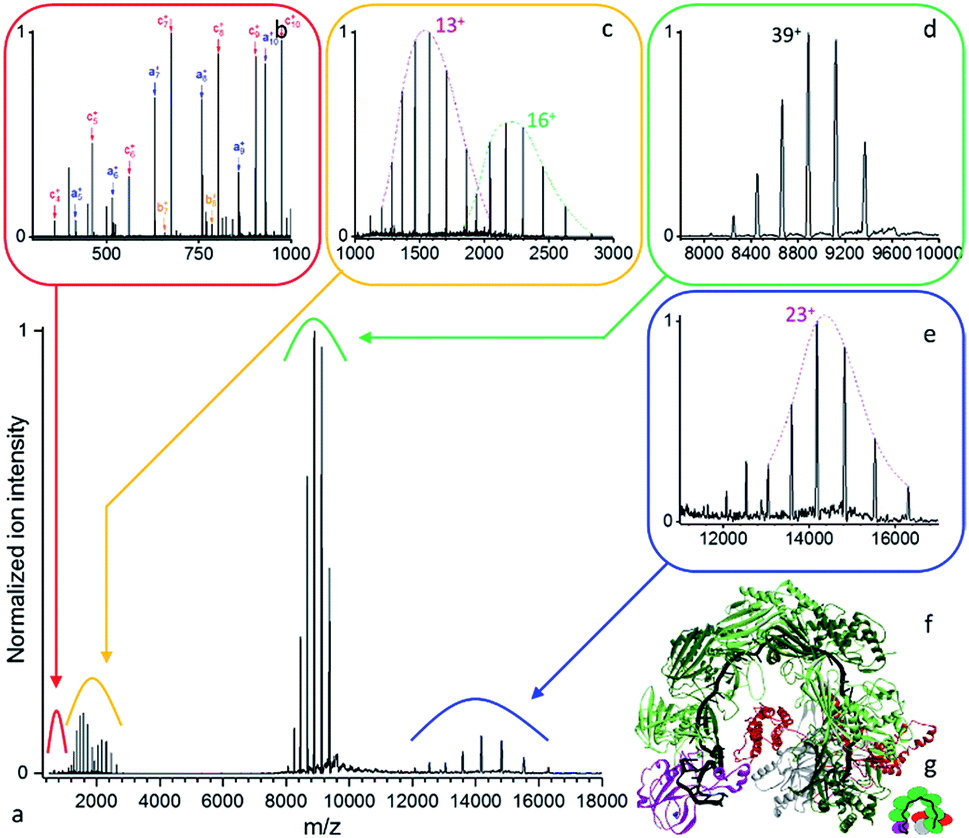 | ||
| Fig. 3 (a) Native top-down mass spectrometry of the mass selected Csy ribonucleoprotein complex using UVPD ([43+–36+], 1.5 mJ per pulse, 3.2 10−10 mbar N2 readout, and resolution 4375 at m/z 200). (b) Low mass peptide fragments and (c) intact subunits resulting from the dissociation of the (d) precursor ions are detected together with the (e) concomitant high m/z product ions. (f) Structural model of an analogous CRISPR-Cas complex (PDB ID: 5UZ9)45 with (g) its structural schematic: Cas6f (purple), 6× Cas7 (dark and light green), Cas8f (red), Cas5 (grey), crRNA (black). | ||
As displayed in Fig. 3, even for a ribonucleoprotein complex where protein subunits are expected to strongly interact with the crRNA strand, we see facile subunit ejection. Compared to B-PE, the same three laser regimes are observed with only slightly higher pulse energies for Csy (3.2 10−10 mbar, 8750 resolution at m/z 200). We therefore focus hereafter on the structural information gained about the Csy complex. The precursor is found to have a mass of 346528 ± 26 Da (Fig. 3d). UVPD unambiguously yields the charge distributions of two intact subunits, Cas6f and Cas7, with respective masses of 20458.27 ± 0.45 Da and 36778.9 ± 2.4 Da (Fig. 3c). On the high m/z side, one concomitant charge distribution is observed with mass of 326046 ± 59 Da (Fig. 3e) which corresponds to Csy minus Cas6f (expected mass 326070 Da). The high m/z product ions originating from the loss of Cas7 are not detected likely due to lower abundance or their charge states. Compared to CID/HCD we see less subunit ejection which might be due to different dissociation dynamics, electrostatic interactions with the RNA strand, and non-uniform repartition of charged amino acids. Interestingly, Csy unwrapping appears to occur from the head of the complex and not the tail as seen previously for the related type I-E CRISPR-Cas complex from Escherichia coli.48
Conditions optimal for disentangling fragments in the lowest mass range – high resolution to resolve isotopologues, low laser power to avoid over-fragmentation – yield the low m/z fragments displayed in Fig. S4.† Our analysis yields complete coverage for a 19 amino acids continuous segment of the Cas7 protein, thereby demonstrating that while composition can be determined from the subunits' charge distributions, unambiguous identification can also be achieved by native top-down proteomics based on the sequence coverage achieved using UVPD.
Native top-down UVPD-MS of the AaLS nano-container
In the absence of efficient coupling to the environment, one of the critical processes taking place upon activation of native protein complexes by UV photons is internal conversion followed by intramolecular vibrational energy redistribution (IVR), as discussed above for B-PE. In order to test IVR efficiency upon UV excitation of large protein complexes, particularly in the absence of chromophore antennae, we selected a virus-like particle (VLP) made of 60 equivalent subunits. In nature, this enzymatic cage encapsulates another enzyme in its interior. Together, they act in the same biochemical pathway to produce the vitamin riboflavin.49 The AaLS polypeptides are arranged in icosahedral symmetry.50When we subjected intact wt-AaLS particles of over 1 MDa to UVPD, similarly to B-PE and Csy, essentially three UVPD regimes could again be distinguished at a given pressure (Fig. S5,† 6 10−10 mbar N2 readout): (1) at low UV fluences (E below 2 mJ per pulse), low m/z monomeric subunits are detected concomitantly with complementary species whose m/z is larger than the precursor (13000 < m/z < 22000). (2) For medium range fluences (E between 2 and 3 mJ per pulse), the ejection of intact monomeric subunits dominates. (3) In the higher fluence range (E above 3 mJ per pulse), top-down peptidic fragments are abundant and ultimately become the most prominent fragment ions. While collisional cooling is not a major competing pathway to UVPD for proteins below 100 kDa,21 it appears to affect the dissociation of very large complexes, lower pulse energies being amenable at low pressure.
More detailed analysis of the data presented in Fig. 4 (0.7 mJ per pulse, 3.7 10−10 mbar N2 readout), yields a precursor (Fig. 4d) mass of 1000574 ± 300 Da in close agreement with the expected average value of 1 001 297 Da (NIST defined elemental av. mass). The low mass charge distribution (Fig. 4c) corresponds to the intact Aquifex aeolicus lumazine synthase subunit with an average mass of 16705.3 ± 0.7 Da in agreement with the average expected value of 16706.0 Da. The concomitant high mass distribution, 988280 ± 270, (Fig. 4e) appears to be the capsid minus one subunit, with the discrepancy likely due to partial fragmentation, and/or overlapping fragments. Assuming a uniform charge distribution on wt-AaLS, the ejected subunits appear to be highly charged compared to the precursor and high m/z complementary ions. This asymmetric dissociation implies stripping of charges from the complex as the leaving unit unfolds, as is also commonly observed during CID/HCD of protein complexes.51
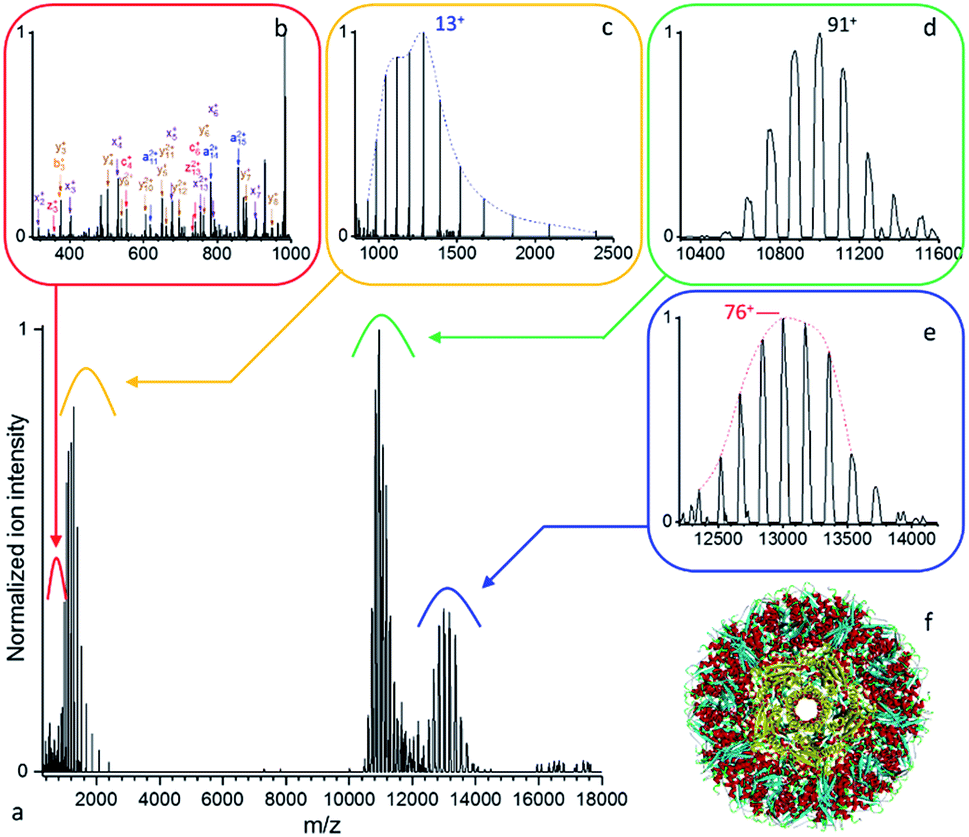 | ||
| Fig. 4 (a) Native top-down mass spectrometry of wt-AaLS virus-like nanocontainers (Mw > 1 MDa) using UVPD ([95+–87+], 0.7 mJ per pulse, 3.7 10−10 mbar N2 readout, and resolution 4350 at m/z 200). (b) Some low mass peptide and (c) intact wt-AaLS subunits resulting from the dissociation of the (d) precursor ions of the VLPs are detected together with (e) larger fragments. (f) Structural model of wt-AaLS (PDB ID: 5MPP) with a pore formed by a pentamer of subunits highlighted in yellow. | ||
Due to desolvation and ion transfer limitations of the Q-Exactive (EMR) Orbitrap used at high m/z, we resorted to a selection window of 4000 m/z. Optimal fragmentation in terms of sequence coverage was achieved at 1.6 mJ per pulse at a 3.9 10−10 mbar N2 readout (Fig. S7†). As noted for B-PE, while high fluences yield more fragments, over-fragmentation often leads to species with lower information content in terms of sequence coverage.21
Sequence coverage is concentrated in the N- and C-terminus regions and reaches 61% (FDR = 6%) for one data set, 62.5% (FDR = 6.5%) using a minimum of 2 replicates out of 3. Strong evidence for glutamine Q2 deamination was found as it leads to unambiguous attribution of the N-terminal fragments. a and y ions were found to be predominant among the fragment ions identified likely as a result of the unfolding process, the N-terminal protruding out of the capsid. Interestingly, proline sites are systematically cleaved as y ions using 193 nm UVPD (Fig. S7b†).
Cumulatively from all the data presented, we find that UVPD implemented on an Orbitrap EMR can be used to study the composition and dissociation of very large protein assemblies, broadening the scope of native top-down proteomics. While UV excitation is not best known for its ability to dissociate non-covalent bonds,22,23 we demonstrate that a single nanosecond UV pulse can effectively dissociate non-covalent interactions in large protein complexes such B-PE, Csy, and wt-AaLS. We hypothesize that the ejection of intact subunits at low fluences primarily results from instantaneous (on a 10 ps timescale) internal conversion and redistribution of the photons' energy on vibrational modes, with the inter-protein interfaces acting as energy transfer bottlenecks.52,53 The subunit charges are high compared to the average charge of the precursor and high m/z product ions, thereby suggesting subunit unfolding and charge stripping from the precursor ion upon ejection. Altogether, the data support the so-called asymmetric dissociation often observed in tandem MS experiments for protein complexes.51,54,55
As for higher UV fluences, the dissociation behavior observed here for large protein complexes is similar to that of smaller systems.56 It primarily leads to a collection of high energy fragments, a, x, and side-chain-loss (d, v, and w) ions (Fig. S3, S4, and S7†), as observed on instruments with short observation time windows. b and y fragments are observed as well, as is typical for observation time windows extending into the ms range.21,33,57 We therefore hypothesize that the fragmentation of the subunits of large complexes involves the population of reactive (low-lying) bottleneck electronic excited states as well as distinctive vibrational mode-specific behaviors.52,53
Conclusions
The primary aim of the present work was to further establish UVPD as a structural tool for the characterization of protein assemblies. While, for peptides, UVPD leads to prompt fragmentation due to the localization of the energy needed to break a bond, it is a far less established technique for dissociating non-covalent complexes. Furthermore, the 1 MDa barrier has only been broken using CID/HCD.14,58 To demonstrate that UVPD native top-down mass spectrometry is amenable to large protein machineries, we generated data on three heterogeneous assemblies: B-phycoerythrin (B-PE) – a 265 kDa heterogeneous α6β6γ protein sub-complex of the light harvesting phycobilisome assembly – the type I–F Csy ribonucleoprotein CRISPR-Cas complex of P. atrosepticum SCRI1043 – a 347 kDa heterogeneous complex consisting of 9 proteins and one crRNA strand – and the 1 MDa virus-like particle wt-AaLS. At low fluences, low and high m/z fragment pairs are observed corresponding to intact subunit ions and the complementary product ions. As the fluence increases, intact monomeric subunit ejection becomes more prominent. At the highest fluences, peptidic fragments are dominant.Overall, we demonstrate here that UVPD is well-suited for the characterization of large protein and ribonucleoprotein assemblies, even up to the mega-Dalton range. Internal conversion of the excited states reached upon absorption of a 193 nm photon as well as the redistribution of the ∼3 eV energy in excess of typical peptide backbone bond energies, readily explains why processes as different as release of subunits, subunit unfolding, and subunit backbone cleavage occur upon UVPD. While further instrumental developments are clearly needed to achieve full native top-down analysis of large complexes, unique sequence tags can already be readily obtained with the potential to contribute to the identification of released subunits in less well characterized assemblies.
Native top-down UVPD MS thereby provides not only information on subunit composition and stoichiometry, as achieved by conventional methods, but also substantial sequence information that can be used to locate modifications and identify proteoforms. By optimizing experimental conditions to maximize ions with high information content in terms of sequence coverage, we have shown that it is possible to validate the binding sites of several chromophores in B-PE (Fig. S3†), induce substantial fragmentation of a subunit of the CRISPR-Cas Csy complex (Fig. S5†), and determine up to 61% of the AaLS capsid protein sequence (Fig. S7†). Native top-down UVPD MS can significantly facilitate screening assays for endogenous protein assemblies purified from various biological sources.
Overall, the present approach shows how a deeper understanding of the interplay between mass spectrometry instrumentation (how molecules are ionized, activated, and detected) and gas-phase chemistry (which bonds are broken, at what rate, and how cleavage or dissociation depends on factors such as the charge state, size, composition, and sequence) enables the development of ever more effective characterization techniques.59
Conflicts of interest
There are no conflicts to declare.Acknowledgements
We thank the members of the Heck laboratory for the support, especially Arjan Barendregt and Barbara A. Steigenberger. JFG thanks Paulo C. Carvalho (FIOCRUZ/PR, Brazil) for providing the latest Y.A.D.A. version (2.0). This research received funding through The Netherlands Organization for Scientific Research (NWO) TTW project 15575 (Structural analysis and position-resolved imaging of macromolecular structures using novel mass spectrometry-based approaches) and SPI.2017.028; Spinoza Award to AJRH, and was further supported by the large-scale proteomics facility Proteins@Work (project 184.032.201) embedded in The Netherlands Proteomics Centre. This project received additional funding from the European Union's Horizon 2020 research and innovation program under the grant agreement 686547 (MSMed) for AJRH, and European Research Council Advanced Grant ERC-AdG-2012-321295 to DH. The Fineran laboratory was supported by the Marsden Fund, Royal Society of New Zealand (RSNZ) and a Rutherford Discovery Fellowship (RSNZ) to PCF. HWRM was supported by a contract from the Health Research Council of New Zealand.Notes and references
- J. A. Loo, Mass Spectrom. Rev., 1997, 16, 1–23 CrossRef CAS PubMed.
- M. Sharon and C. V. Robinson, Annu. Rev. Biochem., 2007, 76, 167–193 CrossRef CAS PubMed.
- A. J. R. Heck, Nat. Methods, 2008, 5, 927–933 CrossRef CAS PubMed.
- J. Snijder and A. J. R. Heck, Annu. Rev. Anal. Chem., 2014, 7, 43–64 CrossRef CAS PubMed.
- Z. Ouyang, Z. Takats, T. A. Blake, B. Gologan, A. J. Guymon, J. M. Wiseman, J. C. Oliver, V. J. Davisson and R. G. Cooks, Science, 2003, 301, 1351–1354 CrossRef CAS PubMed.
- A. A. Rostom, P. Fucini, D. R. Benjamin, R. Juenemann, K. H. Nierhaus, F. U. Hartl, C. M. Dobson and C. V. Robinson, Proc. Natl. Acad. Sci. U. S. A., 2000, 97, 5185–5190 CrossRef CAS PubMed.
- J. Snijder, J. M. Schuller, A. Wiegard, P. Lössl, N. Schmelling, I. M. Axmann, J. M. Plitzko, F. Förster and A. J. R. Heck, Science, 2017, 355, 1181–1184 CrossRef CAS PubMed.
- C. Uetrecht, C. Versluis, N. R. Watts, W. H. Roos, G. J. L. Wuite, P. T. Wingfield, A. C. Steven and A. J. R. Heck, Proc. Natl. Acad. Sci. U. S. A., 2008, 105, 9216–9220 CrossRef CAS PubMed.
- M. Zhou, N. Morgner, N. P. Barrera, A. Politis, S. C. Isaacson, D. Matak-Vinkovic, T. Murata, R. A. Bernal, D. Stock and C. V. Robinson, Science, 2011, 334, 380–385 CrossRef CAS PubMed.
- C. V. Robinson, A. Sali and W. Baumeister, Nature, 2007, 450, 973–982 CrossRef CAS PubMed.
- H. Zhang, W. Cui, J. Wen, R. E. Blankenship and M. L. Gross, J. Am. Soc. Mass Spectrom., 2010, 21, 1966–1968 CrossRef CAS PubMed.
- J. Stojko, S. Fieulaine, S. Petiot-Bécard, A. Van Dorsselaer, T. Meinnel, C. Giglione and S. Cianférani, Analyst, 2015, 140, 7234–7245 RSC.
- K. R. Durbin, L. Fornelli, R. T. Fellers, P. F. Doubleday, M. Narita and N. L. Kelleher, J. Proteome Res., 2016, 15, 976–982 CrossRef CAS PubMed.
- J. Snijder, R. J. Rose, D. Veesler, J. E. Johnson and A. J. R. Heck, Angew. Chem., Int. Ed., 2013, 52, 4020–4023 CrossRef CAS PubMed.
- A. Sahasrabuddhe, Y. Hsia, F. Busch, W. Sheffler, N. P. King, D. Baker and V. H. Wysocki, Proc. Natl. Acad. Sci. U. S. A., 2018, 115, 1268–1273 CrossRef CAS PubMed.
- M. E. Belov, E. Damoc, E. Denisov, P. D. Compton, S. Horning, A. A. Makarov and N. L. Kelleher, Anal. Chem., 2013, 85, 11163–11173 CrossRef CAS PubMed.
- M. R. Mehaffey, J. D. Sanders, D. D. Holden, C. L. Nilsson and J. S. Brodbelt, Anal. Chem., 2018, 90, 9904–9911 CrossRef CAS PubMed.
- G. C. McAlister, W. T. Berggren, J. Griep-Raming, S. Horning, A. Makarov, D. Phanstiel, G. Stafford, D. L. Swaney, J. E. P. Syka, V. Zabrouskov and J. J. Coon, J. Proteome Res., 2008, 7, 3127–3136 CrossRef CAS PubMed.
- V. A. Mikhailov, I. Liko, T. H. Mize, M. F. Bush, J. L. P. Benesch and C. V. Robinson, Anal. Chem., 2016, 88, 7060–7067 CrossRef CAS PubMed.
- J. S. Brodbelt, Chem. Soc. Rev., 2014, 43, 2757–2783 RSC.
- J. B. Shaw, W. Li, D. D. Holden, Y. Zhang, J. Griep-Raming, R. T. Fellers, B. P. Early, P. M. Thomas, N. L. Kelleher and J. S. Brodbelt, J. Am. Chem. Soc., 2013, 135, 12646–12651 CrossRef CAS PubMed.
- L. J. Morrison and J. S. Brodbelt, J. Am. Chem. Soc., 2016, 138, 10849–10859 CrossRef CAS PubMed.
- S. Tamara, A. Dyachenko, K. L. Fort, A. A. Makarov, R. A. Scheltema and A. J. R. Heck, J. Am. Chem. Soc., 2016, 138, 10860–10868 CrossRef CAS PubMed.
- C. Richter and P. C. Fineran, Biochem. Soc. Trans., 2013, 41, 1468–1474 CrossRef CAS PubMed.
- R. Przybilski, C. Richter, T. Gristwood, J. S. Clulow, R. B. Vercoe and P. C. Fineran, RNA Biol., 2011, 8, 517–528 CrossRef CAS PubMed.
- B. Wiedenheft, E. van Duijn, J. B. Bultema, S. P. Waghmare, K. Zhou, A. Barendregt, W. Westphal, A. J. R. Heck, E. J. Boekema, M. J. Dickman and J. A. Doudna, Proc. Natl. Acad. Sci. U. S. A., 2011, 108, 10092–10097 CrossRef CAS PubMed.
- D. L. D. Caspar and A. Klug, Cold Spring Harbor Symp. Quant. Biol., 1962, 27, 1–24 CrossRef CAS PubMed.
- X. Zhang, W. Meining, M. Fischer, A. Bacher and R. Ladenstein, J. Mol. Biol., 2001, 306, 1099–1114 CrossRef CAS PubMed.
- E. Sasaki, D. Böhringer, M. van de Waterbeemd, M. Leibundgut, R. Zschoche, A. J. R. Heck, N. Ban and D. Hilvert, Nat. Commun., 2017, 8, 14663 CrossRef PubMed.
- E. Sasaki and D. Hilvert, J. Phys. Chem. B, 2016, 120, 6089–6095 CrossRef CAS PubMed.
- R. J. Rose, E. Damoc, E. Denisov, A. Makarov and A. J. R. Heck, Nat. Methods, 2012, 9, 1084–1086 CrossRef CAS PubMed.
- K. L. Fort, A. Dyachenko, C. M. Potel, E. Corradini, F. Marino, A. Barendregt, A. A. Makarov, R. A. Scheltema and A. J. R. Heck, Anal. Chem., 2016, 88, 2303–2310 CrossRef CAS PubMed.
- J. S. Brodbelt, Anal. Chem., 2016, 88, 30–51 CrossRef CAS PubMed.
- P. C. Carvalho, T. Xu, X. Han, D. Cociorva, V. C. Barbosa and J. R. Yates, Bioinformatics, 2009, 25, 2734–2736 CrossRef CAS PubMed.
- M. T. Marty, A. J. Baldwin, E. G. Marklund, G. K. A. Hochberg, J. L. P. Benesch and C. V. Robinson, Anal. Chem., 2015, 87, 4370–4376 CrossRef CAS PubMed.
- K. Breuker and F. W. McLafferty, Proc. Natl. Acad. Sci. U. S. A., 2008, 105, 18145–18152 CrossRef CAS PubMed.
- L. Vasicek and J. S. Brodbelt, Anal. Chem., 2010, 82, 9441–9446 CrossRef CAS PubMed.
- A. N. Glazer, J. Biol. Chem., 1989, 264, 1–4 CAS.
- J. Zhang, J. Ma, D. Liu, S. Qin, S. Sun, J. Zhao and S.-F. Sui, Nature, 2017, 551, 57–63 CrossRef PubMed.
- S. Tamara, M. Hoek, R. A. Scheltema, A. C. Leney and A. J. R. Heck, Chem, 2019, 5, 1302–1317 CAS.
- A. Camara-Artigas, J. Bacarizo, M. Andujar-Sanchez, E. Ortiz-Salmeron, C. Mesa-Valle, C. Cuadri, J. M. Martin-Garcia, S. Martinez-Rodriguez, T. Mazzuca-Sobczuk, M. J. Ibañez and J. P. Allen, FEBS J., 2012, 279, 3680–3691 CrossRef CAS PubMed.
- S. A. Jackson, R. E. McKenzie, R. D. Fagerlund, S. N. Kieper, P. C. Fineran and S. J. J. Brouns, Science, 2017, 356, eaal5056 CrossRef PubMed.
- C. Richter, R. L. Dy, R. E. McKenzie, B. N. J. Watson, C. Taylor, J. T. Chang, M. B. McNeil, R. H. J. Staals and P. C. Fineran, Nucleic Acids Res., 2014, 42, 8516–8526 CrossRef CAS PubMed.
- B. N. J. Watson, R. H. J. Staals and P. C. Fineran, mBio, 2018, 9, e02406 CrossRef CAS PubMed.
- S. Chowdhury, J. Carter, M. F. Rollins, S. M. Golden, R. N. Jackson, C. Hoffmann, L. Nosaka, J. Bondy-Denomy, K. L. Maxwell, A. R. Davidson, E. R. Fischer, G. C. Lander and B. Wiedenheft, Cell, 2017, 169, 47–57 CrossRef CAS PubMed.
- T. W. Guo, A. Bartesaghi, H. Yang, V. Falconieri, P. Rao, A. Merk, E. T. Eng, A. M. Raczkowski, T. Fox, L. A. Earl, D. J. Patel and S. Subramaniam, Cell, 2017, 171, 414–426 CrossRef CAS PubMed.
- R. E. Haurwitz, M. Jinek, B. Wiedenheft, K. Zhou and J. A. Doudna, Science, 2010, 329, 1355–1358 CrossRef CAS PubMed.
- E. van Duijn, I. M. Barbu, A. Barendregt, M. M. Jore, B. Wiedenheft, M. Lundgren, E. R. Westra, S. J. J. Brouns, J. A. Doudna, J. van der Oost and A. J. R. Heck, Mol. Cell. Proteomics, 2012, 11, 1430–1441 CrossRef PubMed.
- R. Ladenstein, M. Fischer and A. Bacher, FEBS J., 2013, 280, 2537–2563 CrossRef CAS PubMed.
- U. F. Greber, Rev. Med. Virol., 1998, 8, 213–222 CrossRef CAS PubMed.
- H. Metwally, Q. Duez and L. Konermann, Anal. Chem., 2018, 90, 10069–10077 CrossRef CAS PubMed.
- M. C. Schneebeck, L. E. Vigil and M. R. Ondrias, Chem. Phys. Lett., 1993, 215, 251–256 CrossRef CAS.
- T. Uzer and W. H. Miller, Phys. Rep., 1991, 199, 73–146 CrossRef CAS.
- C. Versluis, A. Staaij, E. Stokvis, A. J. R. Heck and B. Craene, J. Am. Soc. Mass Spectrom., 2001, 12, 329–336 CrossRef CAS PubMed.
- J. C. Jurchen, D. E. Garcia and E. R. Williams, J. Am. Soc. Mass Spectrom., 2004, 15, 1408–1415 CrossRef CAS PubMed.
- R. R. Julian, J. Am. Soc. Mass Spectrom., 2017, 28, 1823–1826 CrossRef CAS PubMed.
- M. S. Thompson, W. Cui and J. P. Reilly, J. Am. Soc. Mass Spectrom., 2007, 18, 1439–1452 CrossRef CAS PubMed.
- H. Li, H. H. Nguyen, R. R. Ogorzalek Loo, I. D. G. Campuzano and J. A. Loo, Nat. Chem., 2018, 10, 139–148 CrossRef CAS PubMed.
- V. H. Wysocki, K. A. Resing, Q. Zhang and G. Cheng, Methods, 2005, 35, 211–222 CrossRef CAS PubMed.
Footnote |
| † Electronic supplementary information (ESI) available: Csy primers, acquisition parameters, UV absorption quantities, effect of pulse energy and HCD on BPE, table of BPE product ions, BPE high resolution UVPD, native top-down UVPD of BPE, native top-down of Csy complex, effect of pulse energy and HCD on wt-AaLS, wt-AaLS high resolution UVPD, native top-down of wt-AaLS, sequence coverages. See DOI: 10.1039/c9sc01857c |
| This journal is © The Royal Society of Chemistry 2019 |