 Open Access Article
Formation of compound I in heme bound Aβ-peptides relevant to Alzheimer's disease†
Ishita
Pal‡
,
Arnab Kumar
Nath‡
,
Madhuparna
Roy
,
Manas
Seal
,
Chandradeep
Ghosh
,
Abhishek
Dey
 * and
Somdatta Ghosh
Dey
 *
*
Indian Association for the Cultivation of Science, 2A & 2B, Raja S. C. Mullick Road, Jadavpur, Kolkata 700032, India. E-mail: icsgd@iacs.res.in
First published on 25th July 2019
Abstract
Proteolysis of Amyloid Precursor Protein, APP, results in the formation of amyloid β (Aβ) peptides, which have been associated with Alzheimer's disease (AD). Recently the failure of therapeutic agents that prohibit Aβ aggregation and sequester Cu/Zn in providing symptomatic relief to AD patients has questioned the amyloid and metal ion hypothesis. Alternatively, abnormal heme homeostasis and reduced levels of neurotransmitters in the brain are hallmark features of AD. Heme can bind Aβ peptides forming a peroxidase type active site which can oxidatively degrade neurotransmitters like serotonin. To date the reactive species responsible for this activity has not been identified. Using rapid kinetics and freeze quenching, we show that heme bound Aβ forms a highly reactive intermediate, compound I. Thus, compound I provides a basis for elucidating the oxidative degradation of neurotransmitters like serotonin, resulting in abnormal neurotransmission, a key pathological feature of AD. Site directed mutants indicate that the Arg5 and Tyr10 residues, unique to human Aβ, affect the rates of formation and decay of compound I providing insight into their roles in the oxidative degradation of neurotransmitters. Tyr10 can potentially play a natural protective role against the highly reactive oxidant, compound I, in AD.
Introduction
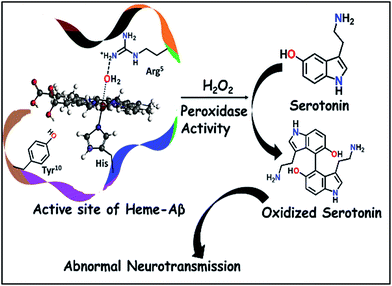
Alzheimer's disease (AD) is a terminal neurodegenerative disease that is likely to affect around 115.4 million people by 2050.1 Generally, amyloidogenic plaques formed by the aggregation of small amyloid β (Aβ) peptides resulting from the hydrolysis of amyloid precursor protein (APP) by the action of secretases are observed in the hippocampal cortex of the brain of an AD affected patient.2–4 Co-localization of Zn and Cu metals in these Aβ plaques has led the community to invoke a potential role of these metals in aggregation.5 Specifically for Cu, neurotoxicity can be derived from oxidative stress owing to the generation of reactive oxygen species by the reaction of Aβ peptide/aggregate bound cuprous ions with oxygen.6,7 Over the last few decades several small molecule inhibitors of aggregation and Cu/Zn chelators have been tested as potential drug candidates.8 Unfortunately, to date, molecules that dissolve such aggregates and/or chelate Cu/Zn have failed to provide credible symptomatic relief during clinical trials.9–11This has prompted investigation of other likely origins of the disease. Heme, the chromophore present in proteins like haemoglobin and myoglobin is ubiquitous in the mammalian body (∼60 g of heme in a grown adult) and has been detected in the Aβ plaques.12,13 While the takers of the heme hypothesis are few, the role of heme in the important cytopathologies of AD cannot be ignored.14,15 AD pathology includes disruption in heme homeostasis, enhanced heme oxygenase activity, reduced levels of heme proteins like NO synthase, increase in iron uptake, dysfunction in mitochondrial complex IV, etc., all indicating a potential association of heme with AD.16,17 Heme has been established to bind to Aβ peptide via a histidine residue in the hydrophilic segment (1–16) of Aβ peptide.17–20 The three residues deemed relevant to the reactivity of heme–Aβ complexes, namely His13, Arg5 and Tyr10, are unique to human Aβ peptides and are absent in rodents who do not have AD.18 The heme–Aβ complexes show peroxidase activity owing to the presence of a distal Arg5 residue18 and can catalyze the oxidation of the neurotransmitter, serotonin (5-HT).21 Serotonin, an essential neurotransmitter for cognitive functions and formation of new memories,22 is catalytically oxidized by heme–Aβ and H2O2 primarily to its dimer dihydroxybitryptamine.23 Significant reduction of the serotonin level and its oxidation leading to neurotoxicity are common phenomena in the pathology of AD.24,25 Since the peroxidase activity of heme–Aβ is unregulated, such reactivity of heme–Aβ can account for the abnormal neurotransmission observed in AD (Scheme 1).21,26 In the absence of the substrate, heme–Aβ can oxidize the Tyr10 residue to form dityrosine linkages between Aβ peptides leading to their aggregation.14,27 Apart from its peroxidase activity with H2O2, reduced heme–Aβ is known to generate H2O2 following a 2-electron reduction of molecular O2, in which one of the electrons is donated by the Tyr residue at the 10th position in the peptide which acts as a redox non-innocent residue similar to the redox active Tyr residues in other heme and non-heme enzymes in nature.28
Although the peroxidase activity of heme–Aβ complexes is known, to date there have been no reports on the reactive intermediates involved in the reaction. Peroxidases are known to contain a highly conserved Arg residue in the distal pocket which assists in O–O bond heterolysis by protonation of the distal oxygen atom of an Fe(III)–OOH intermediate species (also known as compound 0).29 This role of the Arg residue is also described as the “pull effect”.30 The protonation assisted O–O bond cleavage of compound 0 results in the formation of the reactive oxidant compound I, formally described as an Fe(IV)![[double bond, length as m-dash]](https://www.rsc.org/images/entities/char_e001.gif) O porphyrin π cation radical species,31 which is the active oxidant in peroxidases.32 However, the intermediate involved in the peroxidase activity of heme–Aβ has not been trapped and characterized and remains to be established.
O porphyrin π cation radical species,31 which is the active oxidant in peroxidases.32 However, the intermediate involved in the peroxidase activity of heme–Aβ has not been trapped and characterized and remains to be established.
In this manuscript, we report that heme–Aβ complexes rapidly react with m-CPBA (meta-chloro perbenzoic acid), a surrogate for H2O2,21 to generate compound I by the heterolytic cleavage of the O–O bond. The compound I species, having a half-life of 0.6 s, can oxidize neurotransmitters like serotonin. The distal Arg5 and Tyr10 residues control the rate of formation and decay of compound I.
Results and discussion
Formation of reactive intermediates in the reaction of heme–Aβ with m-CPBA
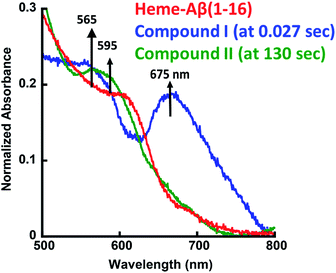
The heme–Aβ complex reacts with m-CPBA with an observed rapid decrease in the absorbance of the Soret band and a concomitant blue shift of the Soret band from 392 nm to 365 nm (Fig. S1a†). The Q-band at 606 nm corresponding to heme bound Aβ red shifts to ∼675 nm in ∼27 ms (Fig. 1 and S1b†). Reaction of heme with peroxide/peracid can lead to a ferric peroxide which can either cleave the O–O bond homolytically to form compound II or heterolytically to form compound I. Heme peroxides are characterized by absorption at 526–540 nm and 556–575 nm while compound II is characterized by absorption at 525–551 and 556–586 nm.33–38 Alternatively, compound I is characterized by absorption at 645–690 nm.37–46 Absorption in this region results in a green colour and is characteristic of a ferryl porphyrin cation radical (FeIV![[double bond, length as m-dash]](https://www.rsc.org/images/entities/char_e001.gif) O Por˙+) or compound I (Table S1†).39–41 The absorbance at ∼675 nm is found to decrease within 4 s indicating the decay of compound I (Fig. 2a). As the reaction progresses, a new species is formed which is characterized by a red shift of the Soret band to 403 nm and new bands at ∼565 nm and 595 nm indicating the decay of compound I to other intermediate species, such as ferryl heme (FeIV
O Por˙+) or compound I (Table S1†).39–41 The absorbance at ∼675 nm is found to decrease within 4 s indicating the decay of compound I (Fig. 2a). As the reaction progresses, a new species is formed which is characterized by a red shift of the Soret band to 403 nm and new bands at ∼565 nm and 595 nm indicating the decay of compound I to other intermediate species, such as ferryl heme (FeIV![[double bond, length as m-dash]](https://www.rsc.org/images/entities/char_e001.gif) O porphyrin) or compound II (Fig. 1 and S1b†).35,36,39 Note that we have not been able to accumulate a high enough amount of compound I with H2O2 because the rate of formation of compound I in H2O2 is slower than in m-CPBA as is well documented for peroxidases.47 In contrast, the decay of compound I to compound II is independent of the source of peroxide. This is why compound I is barely observed in the reaction of heme–Aβ with H2O2; rather compound II is observed (Fig. S2†).36
O porphyrin) or compound II (Fig. 1 and S1b†).35,36,39 Note that we have not been able to accumulate a high enough amount of compound I with H2O2 because the rate of formation of compound I in H2O2 is slower than in m-CPBA as is well documented for peroxidases.47 In contrast, the decay of compound I to compound II is independent of the source of peroxide. This is why compound I is barely observed in the reaction of heme–Aβ with H2O2; rather compound II is observed (Fig. S2†).36
Kinetic assays
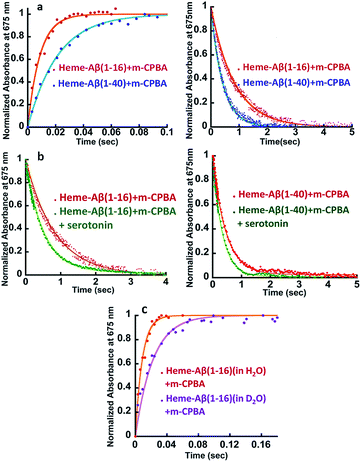
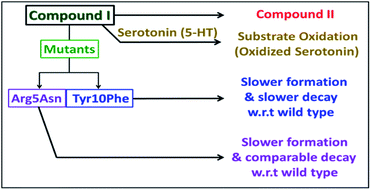
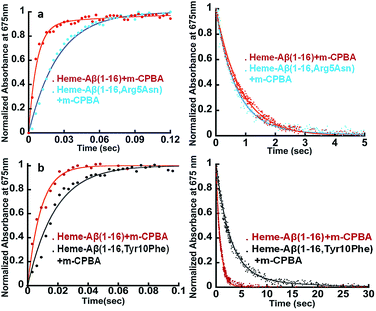
The kinetic trace of the reaction between heme–Aβ and m-CPBA at 675 nm shows an exponential increase followed by a decay indicating the formation and decay of compound I, respectively (Fig. 2a). The rate constants for the formation and decay have been estimated to be 115 s−1 and 1.2 s−1 for heme–Aβ(1–16). In the presence of serotonin, the decay of compound I is accelerated as the compound I formed oxidizes it to its dimer dihydroxybitryptamine (Fig. 2b, and S4†), at a rate which is faster than that of its auto decay in the absence of the substrate (Table 1 and Scheme 2). Note that heme–Aβ can oxidize serotonin to its dimer dihydroxybitryptamine in the presence of both m-CPBA and H2O2 (Fig. S3†).| Heme–Aβ complexes | Formation rate (s−1) | Decay rate (s−1) |
|---|---|---|
| Heme–Aβ(1–16) | 115 ± 5 | 1.20 ± 0.10 |
| Heme–Aβ(1–16) in D2O | 45 ± 2 | 1.10 ± 0.10 |
| Heme–Aβ(1–40) | 47 ± 1 | 2.40 ± 0.20 |
| Heme–Aβ(1–16) + serotonin | 180 ± 5 | 2.05 ± 0.20 |
| Heme–Aβ(1–40) + serotonin | 70 ± 2 | 3.00 ± 0.15 |
| Heme–Aβ(1–16, Arg5Asn) | 40 ± 2 | 1.32 ± 0.20 |
| Heme–Aβ(1–16, Tyr10Phe) | 55 ± 3 | 0.40 ± 0.05 |
Heme–Aβ(1–40) also gives rise to the formation of both compound I and compound II (Fig. S5a and b†). It shows a slower rate of formation and a faster rate of decay of compound I relative to heme–Aβ(1–16) (Fig. 2a and Table 1), suggesting that the presence of the hydrophobic region hinders the formation of compound I and marginally accelerates its decay. The decay of compound I is faster in the presence of serotonin (Fig. 2b and S6†), similar to that of heme–Aβ(1–16).
The reactions of heme–Aβ(1–40) and heme–Aβ(1–16) with m-CPBA have been monitored at 675 nm in D2O (Fig. 2c and S7b, Table S2†). Both complexes exhibit a slower rate of formation of compound I in D2O relative to H2O suggesting protonation is involved in the rate determining step (r.d.s). The KH/KD was found to be ∼2 (Table 1) which compares very well with the KH/KD reported for the O–O bond heterolysis in peroxidases.48 However, no isotope effect was observed in the case of decay of compound I (Fig. S7a and c†) consistent with reports on peroxidases as compound I decays by outer sphere electron transfer. These data are consistent with protonation assisted O–O bond heterolysis as the rate determining step in the formation of compound I.49,50
Role of second sphere residues in controlling the rate of formation and decay of compound I
The Arg5 and Tyr10 residues are involved in peroxidase activity and reactive oxygen species generation, respectively, by heme–Aβ complexes.18 In naturally occurring heme peroxidases a distal Arg residue plays a key role in the heterolytic cleavage of the O–O bond as well as stabilizing the FeIV![[double bond, length as m-dash]](https://www.rsc.org/images/entities/char_e001.gif) O intermediate.31 The Arg5Asn mutant of heme–Aβ(1–16), i.e. heme–Aβ(1–16, Arg5Asn), reacts with m-CPBA and shows a slower rate of formation and a comparable rate of decay of the band at 675 nm suggesting that the Arg5 residue assists in the formation of compound I (Table 1, Fig. 3a) akin to natural peroxidases. Thus, the role of the Arg5 residue, which was proposed to induce a pull effect assisting in O–O bond heterolysis and help the heme–Aβ complex function as a peroxidase, is confirmed. Similar results are obtained with the Arg5Asn mutant of heme–Aβ(1–40) (Fig. S8a†).
O intermediate.31 The Arg5Asn mutant of heme–Aβ(1–16), i.e. heme–Aβ(1–16, Arg5Asn), reacts with m-CPBA and shows a slower rate of formation and a comparable rate of decay of the band at 675 nm suggesting that the Arg5 residue assists in the formation of compound I (Table 1, Fig. 3a) akin to natural peroxidases. Thus, the role of the Arg5 residue, which was proposed to induce a pull effect assisting in O–O bond heterolysis and help the heme–Aβ complex function as a peroxidase, is confirmed. Similar results are obtained with the Arg5Asn mutant of heme–Aβ(1–40) (Fig. S8a†).
The Tyr10Phe mutant of heme–Aβ(1–16), i.e. the heme–Aβ(1–16, Tyr10Phe) complex, shows a slower rate of formation of compound I followed by a slower rate of decay relative to the native heme–Aβ(1–16) complex (Scheme 2, Fig. 3b). In fact the decay of compound I from heme–Aβ(1–16, Tyr10Phe) is almost three times slower compared to that for native Aβ(1–16) suggesting that Tyr10 is likely associated with the decay of compound I. Similar results are obtained with the Tyr10Phe mutant of heme–Aβ(1–40) (Fig. S8b†). It can thereby possibly exhibit a protective role by mitigating the highly reactive oxidant, compound I.51 Attempts to trap a tyrosine radical that would be produced upon its oxidation were not successful implying that the lifetime of such a radical is short. Note that the slower rate of decay of compound I in the Tyr10 mutant is consistent with the faster peroxidase activity exhibited by this mutant (Fig. S9†), since a slower self-decay rate allows compound I to oxidise more of the substrate.
Characterization of compound I by temperature dependent EPR
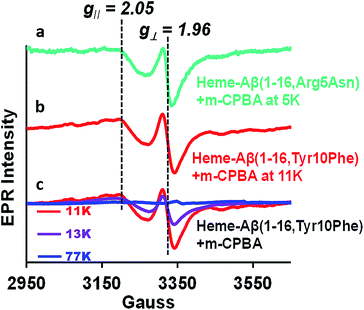
Compound I [Fe(IV)![[double bond, length as m-dash]](https://www.rsc.org/images/entities/char_e001.gif) O Por˙+] in heme proteins is characterized by an asymmetric signal ∼15 gauss wide with g ∼1.995, which results from the weak coupling between the S = 1 ferryl centre and S = ½ porphyrin radical.30,43,52 The broad EPR signal is temperature sensitive and almost disappears at temperatures ≥ 30 K due to spin relaxation, inflicted by the interaction between the porphyrin radical and heme centre.53 Since the Tyr10Phe and Arg5Asn mutants of Aβ exhibit slower kinetics relative to native heme–Aβ (Table 1), these mutants are used for the spectroscopic characterisation of compound I. EPR data of the green species formed by the reaction of heme–Aβ(1–16, Tyr10Phe) and heme–Aβ(1–16, Arg5Asn) with m-CPBA frozen within their decay times, show an axial signal with a broad estimated g⊥ = 2.05 and g∥ = 1.97 at 11 K and 5 K, respectively. The data are similar to those reported for compound I of turnip peroxidase by Ivancich et al. and are thereby consistent with the formation of compound I.54 The intensity of the broad signal was found to decrease with increasing temperature and at 77 K there was hardly any signal, attributed to the spin relaxation phenomenon (Fig. 4 and S10†).54,55
O Por˙+] in heme proteins is characterized by an asymmetric signal ∼15 gauss wide with g ∼1.995, which results from the weak coupling between the S = 1 ferryl centre and S = ½ porphyrin radical.30,43,52 The broad EPR signal is temperature sensitive and almost disappears at temperatures ≥ 30 K due to spin relaxation, inflicted by the interaction between the porphyrin radical and heme centre.53 Since the Tyr10Phe and Arg5Asn mutants of Aβ exhibit slower kinetics relative to native heme–Aβ (Table 1), these mutants are used for the spectroscopic characterisation of compound I. EPR data of the green species formed by the reaction of heme–Aβ(1–16, Tyr10Phe) and heme–Aβ(1–16, Arg5Asn) with m-CPBA frozen within their decay times, show an axial signal with a broad estimated g⊥ = 2.05 and g∥ = 1.97 at 11 K and 5 K, respectively. The data are similar to those reported for compound I of turnip peroxidase by Ivancich et al. and are thereby consistent with the formation of compound I.54 The intensity of the broad signal was found to decrease with increasing temperature and at 77 K there was hardly any signal, attributed to the spin relaxation phenomenon (Fig. 4 and S10†).54,55
Characterization of compound I by resonance Raman spectroscopy
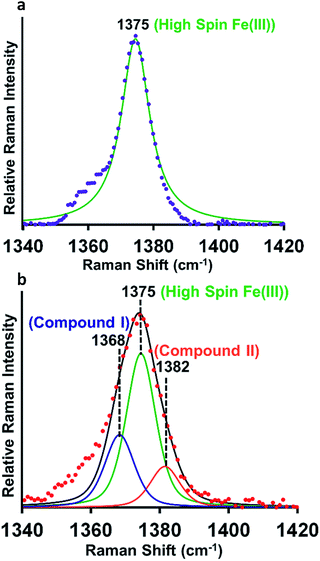
Resonance Raman (rR) spectroscopy is a unique technique for the characterization of structures of heme proteins.56,57 The rR spectra obtained from heme–Aβ complexes reacted with 5 times excess of m-CPBA clearly indicate a broadening of the oxidation state marker ν4 band region due to the presence of compound I at 1368 cm−1 (Fig. 5b, blue) along with compound II at 1382 cm−1 (Fig. 5b, orange) in addition to the ν4 band of resting ferric species at 1375 cm−1 (Fig. 5a and b, green).58,59 All these signals could be deconvoluted by fitting the ν4 region of the spectrum. More importantly, in the low frequency region (600–900 cm−1) of rR spectra, we observe a weak feature at 843 cm−1 which shifted to 803 cm−1 when an isotope labelled solvent (H2O18) was employed. This corresponds to the ν(Fe-0) of the oxyferryl fragment of compound I.60,61 Another less intense band at 817 cm−1 was observed corresponding to ν(Fe-0) of compound II (Fig. S11†). We were unable to see convincing isotopic shifts of this band likely because of its weak intensity relative to the strong heme vibrations and due to low yields of these high valent intermediates, as expected due to the high reactivities of these species.Conclusions
Heme–Aβ complexes have a peroxidase type active site. They react with m-CPBA to form a high valent iron–oxo species, which shows a characteristic absorption band at 675 nm and a broad axial EPR signal with effective g⊥ = 2.05 and g∥ = 1.97 at liquid helium temperatures, which disappeared almost completely at 77 K. In the rR spectra, the mixture of heme–Aβ and m-CPBA also shows appearance of new oxidation state marker (ν4) bands at 1368 cm−1 in the high frequency region and at 843 cm−1 in the low frequency region. The low frequency band at 843 cm−1 shifts to about 803 cm−1 upon isotope incorporation (40 cm−1 shift). These features are characteristic of a reactive compound I type intermediate which can oxidize neurotransmitters like serotonin. This can potentially lead to abnormal neurotransmission, which is a key pathological feature of AD. A slower rate of formation of compound I in D2O than in H2O, but a comparable decay, is consistent with protonation assisted O–O bond heterolysis as the rate determining step for compound I formation. The effects of the second sphere residues Arg5 and Tyr10 on the formation and decay of this intermediate were probed using mutated Aβ peptides. In the absence of the Arg5 residue, the rate of formation of the 675 nm band was found to be slower while the decay was comparable to that of native heme–Aβ, indicating the role of Arg5 in assisting in compound I formation by inducing a pull effect helping in the O–O bond heterolysis and consequently in the peroxidase activity of the heme–Aβ complex. The Tyr10 mutant of the heme–Aβ complex shows a slower rate of formation of compound I and a slower decay of the same, relative to the native heme–Aβ complex suggesting a likely association of Tyr10 in the decay of compound I. Thus the Tyr10 residue might act as a natural defence against oxidation by compound I. Isolation and characterization of compound I in the oxidative degradation of neurotransmitters like serotonin provides a possible explanation and mechanism for the abnormal neurotransmission that is observed in AD. It must be noted that AD is a very slowly progressing disease. The catalytic oxidation of neurotransmitters like serotonin by heme–Aβ is expected to be slow, so that the deleterious effects of it would occur over a prolonged period of time, which also correlated with the relatively late onset of this disease. The relatively slow rate of serotonin oxidation is thus well in accordance with the established facts of AD.12,19–21Conflicts of interest
There are no conflicts to declare.Acknowledgements
The authors thank the DST-SERB India for financial support (Grants EMR/2014/000392 and EMR/2015/0008063). Ishita Pal and Arnab Kumar Nath thank the UGC, Madhuparna Roy and Manas Seal thank the IACS-integrated Ph.D. program and Chandradeep Ghosh thanks the IACS for a fellowship. The authors thank the CSS, IACS for providing the HPLC facility.Notes and references
- A. Alberdi, A. Aztiria and A. Basarab, Artif. Intell. Med., 2016, 71, 1–29 CrossRef PubMed.
- T. Lührs, C. Ritter, M. Adrian, D. Riek-Loher, B. Bohrmann, H. Döbeli, D. Schubert and R. Riek, Proc. Natl. Acad. Sci. U. S. A., 2005, 102, 17342–17347 CrossRef PubMed.
- R. J. O'Brien and P. C. Wong, Annu. Rev. Neurosci., 2011, 34, 185–204 CrossRef PubMed.
- N. Storey and N. Cappai, Neuropathol. Appl. Neurobiol., 2002, 25, 81–97 CrossRef.
- C. R. Cornett, W. R. Markesbery and W. D. Ehmann, NeuroToxicology, 1998, 19, 339–345 CAS.
- A. I. Bush, C. L. Masters and R. E. Tanzi, Proc. Natl. Acad. Sci. U. S. A., 2003, 100, 11193–11194 CrossRef CAS PubMed.
- A. I. Bush, C. L. Masters and R. E. Tanzi, Proc. Natl. Acad. Sci. U. S. A., 2003, 100, 11193 CrossRef CAS PubMed.
- A. I. Bush, J. Alzheimer's Dis., 2008, 15, 223 CAS.
- S. C. Drew, Front. Neurosci., 2017, 11, 317 CrossRef PubMed.
- E. Karran, M. Mercken and B. D. Strooper, Nat. Rev. Drug Discovery, 2011, 10, 698 CrossRef CAS PubMed.
- A. I. Bush, J. Alzheimer's Dis., 2008, 15, 223–240 CAS.
- A. Rauk, Chem. Soc. Rev., 2009, 38, 2698–2715 RSC.
- C. L. Masters, G. Simms, N. A. Weinman, G. Multhaup, B. L. McDonald and K. Beyreuther, Proc. Natl. Acad. Sci. U. S. A., 1985, 82, 4245 CrossRef CAS PubMed.
- E. Chiziane, H. Telemann, M. Krueger, J. Adler, J. Arnhold, A. Alia and J. Flemmig, J. Alzheimer's Dis., 2018, 61, 963–984 CAS.
- J. Flemmig, M. Zámocký and A. Alia, Neural Regener. Res., 2018, 13, 1170–1174 CrossRef PubMed.
- J. Valla, L. Schneider, T. Niedzielko, K. D. Coon, R. Caselli, M. N. Sabbagh, G. L. Ahern, L. Baxter, G. Alexander, D. G. Walker and E. M. Reiman, Mitochondrion, 2006, 6, 323–330 CrossRef CAS PubMed.
- H. Atamna and W. H. Frey, Proc. Natl. Acad. Sci. U. S. A., 2004, 101, 11153 CrossRef CAS PubMed.
- D. Pramanik and S. G. Dey, J. Am. Chem. Soc., 2011, 133, 81–87 CrossRef CAS PubMed.
- H. Atamna and K. Boyle, Proc. Natl. Acad. Sci. U. S. A., 2006, 103, 3381–3386 CrossRef CAS PubMed.
- C. Ghosh, M. Seal, S. Mukherjee and D. S. Ghosh, Acc. Chem. Res., 2015, 48, 2556–2564 CrossRef CAS PubMed.
- S. Mukherjee, M. Seal and S. G. Dey, J. Biol. Inorg Chem., 2014, 19, 1355–1365 CrossRef CAS PubMed.
- L. C. Berumen, A. Rodriguez, R. Miledi and G. Garcia-Alcocer, Sci. World J., 2012, 2012, 15 Search PubMed.
- M. Z. Wrona and G. Dryhurst, Chem. Res. Toxicol., 1998, 11, 639–650 Search PubMed.
- P. B. Crino, B. A. Vogt, J.-C. Chen and L. Volicer, Brain Res., 1989, 504, 247–257 CrossRef CAS PubMed.
- J. J. Rodríguez, H. N. Noristani and A. Verkhratsky, Prog. Neurobiol., 2012, 99, 15–41 CrossRef PubMed.
- E. M. Mutisya, A. C. Bowling and M. F. Beal, J. Neurochem., 1994, 63, 2179–2184 CrossRef CAS PubMed.
- S. Mukherjee, E. A. Kapp, A. Lothian, A. M. Roberts, Y. V. Vasil'ev, B. A. Boughton, K. J. Barnham, W. M. Kok, C. Hutton, C. L. Masters, A. I. Bush, J. S. Beckman, S. G. Dey and B. Roberts, Anal. Chem., 2017, 89, 6136–6145 CrossRef CAS PubMed.
- D. Pramanik, C. Ghosh, S. Mukherjee and S. G. Dey, Coord. Chem. Rev., 2013, 257, 81–92 CrossRef CAS.
- E. Derat and S. Shaik, J. Phys. Chem. B., 2006, 110, 10526–10533 CrossRef CAS PubMed.
- T. L. Poulos, Chem. Rev., 2014, 114, 3919–3962 CrossRef CAS PubMed.
- T. L. Poulos, Arch. Biochem. Biophys., 2010, 500, 3–12 CrossRef CAS PubMed.
- X. Huang and J. T. Groves, Chem. Rev., 2018, 118, 2491–2553 CrossRef CAS PubMed.
- J. N. Rodriguez-Lopez, A. T. Smith and R. N. Thorneley, J. Biol. Chem., 1997, 272, 389–395 CrossRef CAS PubMed.
- I. G. Denisov, M. T. Makris and S. G. Sligar, J. Biol. Chem., 2002, 277, 42706–42710 CrossRef CAS PubMed.
- T. Egawa, H. Shimada and Y. Ishimura, J. Biol. Chem., 2000, 275, 34858–34866 CrossRef CAS PubMed.
- A. J. Fielding, R. Singh, B. Boscolo, P. C. Loewen, E. M. Ghibaudi and A. Ivancich, Biochemistry, 2008, 47, 9781–9792 CrossRef CAS PubMed.
- E. D. Coulter, J. Cheek, A. P. Ledbetter, C. K. Chang and J. H. Dawson, Biochem. Biophys. Res. Commun., 2000, 279, 1011–1015 CrossRef CAS PubMed.
- Y. Watanabe, H. Nakajima and T. Ueno, Acc. Chem. Res., 2007, 40, 554–562 CrossRef CAS PubMed.
- W. D. Hewson and L. P. Hager, J. Biol. Chem., 1979, 254, 3182–3186 CAS.
- S. Yokota and H. Fujii, J. Am. Chem. Soc., 2018, 140, 5127–5137 CrossRef CAS PubMed.
- H. Fujii and K. Ichikawa, Inorg. Chem., 1992, 31, 1110–1112 CrossRef CAS.
- C. E. Schulz, R. Rutter, J. T. Sage, P. G. Debrunner and L. P. Hager, Biochemistry, 1984, 23, 4743–4754 CrossRef CAS PubMed.
- R. Rutter, L. P. Hager, H. Dhonau, M. Hendrich, M. Valentine and P. Debrunner, Biochemistry, 1984, 23, 6809–6816 CrossRef CAS PubMed.
- J. Rittle and M. T. Green, Science, 2010, 330, 933 CrossRef CAS PubMed.
- C. M. Maupin and G. A. Voth, Biochemistry, 2007, 46, 2938–2947 CrossRef CAS PubMed.
- H. Fujii, T. Yoshimura and H. Kamada, Inorg. Chem., 1997, 36, 6142–6143 CrossRef CAS.
- S. Yokota and H. Fujii, J. Am. Chem. Soc., 2018, 140, 5127–5137 CrossRef CAS PubMed.
- H. B. Dunford, W. D. Hewson and H. Steiner, Can. J. Chem., 1978, 56, 2844–2852 CrossRef CAS.
- M. Vidakovic, S. G. Sligar, H. Li and T. L. Poulos, Biochemistry, 1998, 37, 9211–9219 CrossRef CAS PubMed.
- G. Chreifi, E. L. Baxter, T. Doukov, A. E. Cohen, S. E. McPhillips, J. Song, Y. T. Meharenna, S. M. Soltis and T. L. Poulos, Proc. Natl. Acad. Sci. U. S. A., 2016, 113, 1226 CrossRef CAS PubMed.
- B. Gray Harry and R. Winkler Jay, Isr. J. Chem., 2016, 56, 640–648 CrossRef CAS PubMed.
- R. Aasa, T. Vänngård and H. B. Dunford, Biochim. Biophys. Acta, Enzymol., 1975, 391, 259–264 CrossRef CAS.
- J. T. Colvin, R. Rutter, H. J. Stapleton and L. P. Hager, Biophys. J., 1983, 41, 105–108 CrossRef CAS PubMed.
- A. Ivancich, G. Mazza and A. Desbois, Biochemistry, 2001, 40, 6860–6866 CrossRef CAS PubMed.
- A. T. Smith, W. A. Doyle, P. Dorlet and A. Ivancich, Proc. Natl. Acad. Sci. U. S. A., 2009, 106, 16084 CrossRef CAS PubMed.
- S. Hu, K. M. Smith and T. G. Spiro, J. Am. Chem. Soc., 1996, 118, 12638–12646 CrossRef CAS.
- T. G. Spiro and T. C. Strekas, J. Am. Chem. Soc., 1974, 96, 338–345 CrossRef CAS PubMed.
- K. J. Paeng and J. R. Kincaid, J. Am. Chem. Soc., 1988, 110, 7913–7915 CrossRef CAS.
- C. M. Reczek, A. J. Sitter and J. Terner, J. Mol. Struct., 1989, 214, 27–41 CrossRef CAS.
- J. R. Kincaid, Y. Zheng, J. Al-Mustafa and K. Czarnecki, J. Biol. Chem., 1996, 271, 28805–28811 CrossRef CAS PubMed.
- W. A. Oertling and G. T. Babcock, Biochemistry, 1988, 27, 3331–3338 CrossRef CAS PubMed.
Footnotes |
| † Electronic supplementary information (ESI) available. See DOI: 10.1039/c9sc01679a |
| ‡ Equal contributions. |
| This journal is © The Royal Society of Chemistry 2019 |

