
 Open Access Article
 This Open Access Article is licensed under a Creative Commons Attribution-Non Commercial 3.0 Unported Licence
Rational design of functional materials guided by single particle chemiluminescence imaging†
Weijun
Kong‡
a,
Qi
Li‡
a,
Wei
Wang
 *b,
Xiaoning
Zhao
c,
Shenglong
Jiang
d,
Tianhua
Zheng
a,
Qun
Zhang
d,
Wen
Shen
a and
Hua
Cui
*a
*b,
Xiaoning
Zhao
c,
Shenglong
Jiang
d,
Tianhua
Zheng
a,
Qun
Zhang
d,
Wen
Shen
a and
Hua
Cui
*a
aDepartment of Chemistry, CAS Key Laboratory of Soft Matter Chemistry, iChEM (Collaborative Innovation Center of Chemistry for Energy Materials), University of Science and Technology of China, Hefei, Anhui 230026, P. R. China. E-mail: hcui@ustc.edu.cn
bState Key Laboratory of Analytical Chemistry for Life Science, School of Chemistry and Chemical Engineering, Nanjing University, Nanjing 210023, P. R. China. E-mail: wei.wang@nju.edu.cn
cBeijing Institute of Metrology, Room 303, No. 10 Lishuiqiaojia, Chaoyang District, Beijing, 102200, P. R. China
dHefei National Laboratory for Physical Science at the Microscale, iChEM, Synergetic Innovation Center of Quantum Information and Quantum Physics, University of Science and Technology of China, Hefei, Anhui 230026, P. R. China
First published on 30th April 2019
Abstract
Chemiluminescence (CL) functionalized materials have found tremendous value in developing CL assays for clinical assays and point-of-care tests. To date, the design and optimization of these materials have mainly relied on conventional trial-and-error procedures in which the ensemble performance is evaluated using conditional experiments. Here we have built an optical microscope to acquire the CL emission from single magnetic-polymer hybrid microbeads functionalized with luminol analogues, and to access the CL kinetics of each individual particle. It was incidentally found that a minor subpopulation of microbeads exhibited intense and delayed CL emission while the majority showed transient and weak emission. Structural characterization of the very same individual particles uncovered that the amorphous multi-core microstructures were responsible for the enhanced encapsulation efficiency and optimized CL reaction kinetics. Guided by this knowledge stemming from single particle CL imaging, the synthesis procedure was rationally optimized to enrich the portion of microbeads with better CL performance, which was validated by both single particle imaging and the significantly improved analytical performance at the ensemble level. The present work not only demonstrates the CL imaging and CL kinetics curve of single microbeads for the first time, but also sets a clear example showing the capability of single particle studies to investigate the structure–activity relationship in a bottom-up manner and to help the rational design of ensemble materials with improved performance.
Introduction
Exploring the structure–property relationship of functional materials plays a central role in materials science, because it holds great promise for the rational design of better materials by understanding the structural basis of the corresponding chemical and physical properties. In order to overcome the inherent structural and functional inhomogeneity among individual particles, single particle studies have recently been rising as a powerful complement to ensemble-based conventional approaches.1–5 With the help of various optical imaging techniques including fluorescence,6–8 dark-field,9,10 Raman scattering,11,12 infrared13 and surface plasmon resonance,14,15 the chemical activity of each and every individual particle in the field of view was determined by monitoring the optical or spectroscopic signals during chemical reactions.5 The results were further correlated with the structural features of the very same individual particles, leading to a bottom-up strategy towards determining the structure–activity relationship which removed or bypassed the inhomogeneity among individual particles.16,17 Despite the bright future promised by single particle studies, major efforts have so far been made on the development of methodologies which preferably demonstrated some proof-of-concept cases by using model reactions and catalysts rather than practically significant ones. Although highly desirable, the attempts to utilize the structure–activity relationship originating from single particle studies to guide the rational design of practical ensemble systems are still rare.3,18–20 It is clear that a stronger connection between single particle studies and ensemble performance is critical to convincingly underscore their value in understanding the fundamental structure–activity relationship, and to benefit broad application fields with improved ensemble performance.Chemiluminescence (CL) assays, including CL immunoassays, DNA/RNA assays and aptamer-based assays, have become powerful and popular tools to sensitively and selectively detect various analytes such as proteins, nucleic acids and even small molecules in bio-specimens.21,22 In particular, CL immunoassays have gradually replaced traditional enzyme-linked immunosorbent assays (ELISA) and fluorescence immunoassays because they possess several unique strengths.23,24 First, the absence of an excitation light source not only greatly simplifies the instrumentation and experimental operation, but also dramatically improves the sensitivity due to the removal of the scattering background. Second, as one of the most commercially valued assays, to date, CL immunoassays are explosively growing worldwide, particularly in the in vitro diagnosis (IVD) industry, due to the ease of automation. In recent years, multifunctional materials such as magnetic microbeads, metal nanoparticles and carbon nanomaterials have received much attention in CL assays.25,26 These materials were functionalized with a specific antibody or DNA/RNA or aptamer and CL molecules to act not only as the immobilizing substrate for molecular recognition, but also as the CL probe or interface for signal transduction.27,28 The geometrical structure and the chemical composition of these functionalized particles regulated the CL reaction efficiency and kinetics, thus determining the assay's performance such as sensitivity, specificity and dynamic range.29 To date, the design and optimization of these particles have largely relied on trial-and-error type conditional experiments that were performed at the ensemble level. The capability to determine the reaction kinetics of single particles and correlate the activity with their structural features allows one to investigate the structure–activity relationship, which is critical for improving the assay's performance.
CL imaging of individual particles has been a quite challenging task, mostly because of the limited photon flux accompanying CL reactions. In contrast to fluorescence imaging in which a single fluorophore can repeatedly emit up to 1 million photons as a result of the extremely fast excitation–relaxation cycles, reaction of a single CL molecule, however, releases only one photon in the best scenario (CL quantum yield = 1). Consequently, it is difficult to accumulate sufficient photons from a particle to achieve the necessary signal-to-background ratio for CL imaging because the particle contains only a very small amount of CL molecules. To date, the electrochemiluminescence (ECL) of tris-bipyridyl ruthenium (TBR) and its derivatives has been the dominant choice, probably the only one, in order to realize ECL imaging of single objects.23,30–34 It is because, in this particular case, the reactants (TBR molecules) are regenerated and recycled after the ECL reactions. Long-time exposure when applying periodic electrochemical potentials allows for accumulating a lot of photons from one TBR molecule, thus enhancing the image contrast. Although CL represents a more convenient and robust read-out format in clinical assays and point-of-care tests because of the absence of electrochemical accessories and the diverse choice of applicable CL reaction systems, direct CL imaging of single particle has yet to be demonstrated because it certainly requires an alternative strategy for signal amplification. For example, we have recently developed a polymer-assisted method to effectively incorporate a large amount of luminol analogues, as luminol is one of the earliest and most commonly used CL reagents, and catalysts in 3-dimensional mesoporous materials while maintaining their accessibility and reaction activity. Co-functionalization of catalysts in the same microenvironment further optimized the reaction efficiency and kinetics, leading to the state-of-the-art hydrogel materials that can emit intense CL light and last more than a week.35 Similar strategies have been also utilized to improve the sensitivity of CL assays for the detection of DNA, protein markers, metal ions and small molecular compounds.36–39 In these previous studies, although it was generally hypothesized that the microstructure of particles played essential roles in regulating the encapsulation and reaction efficiency of luminol analogues, a clear structure–activity relationship remained largely unexplored, thus hampering further improvements in the performance of these CL assays. So far, the design and optimization has largely relied on trial-and-error type conditional experiments at the ensemble level. The capability of determining the CL kinetics of single particles and correlating them with their structural features allows one to investigate the structure–activity relationship from a bottom-up perspective, which is critical for improving the assay's performance.
In the present work, we demonstrate the capability of imaging the CL emission from single magnetic-polymer hybrid microbeads functionalized with luminol analogues for the first time. The microbeads were chosen as a model of CL functional materials due to the ease of magnetic separation after recognition reactions. Surprisingly, plotting the CL intensity of single microbeads as a function of time uncovered two subpopulations with significantly different reaction kinetics. While transient flash-like weak CL emission was observed from the majority of microbeads, a minor subpopulation exhibited delayed but intense emission. It is clear that increasing the portion of the latter subpopulation is desirable for improving the assay’s performance. In situ characterization of the structure and chemical composition of the corresponding microbeads with confocal fluorescence microscopy (CFM) and scanning electron microscopy (SEM) pointed out that an amorphous multi-core microstructure, in which multiple smaller microbeads were encapsulated in a larger hollow one, was responsible for the enhanced encapsulation efficiency and optimized reaction kinetics. Guided by this structure–activity relationship originating from single particle CL imaging, the synthesis procedure was rationally optimized to increase the portion of amorphous multi-core microbeads. Both single particle imaging and ensemble measurements successfully indicated that the optimized batch of microbeads showed significantly improved sensitivity in the detection of 2,4,6-trinitrotoluene (TNT). This study not only demonstrates the CL imaging and kinetics curve of single microbeads for the first time, but also sets a clear example showing how single particle studies could help the rational design of CL materials and ensemble CL assays with improved performance.
Results and discussion
Imaging single microbeads with CL microscopy
CL-functionalized microbeads were prepared by incorporating N-(4-aminobutyl)-N-ethylisoluminol (ABEI) and Co2+ into magnetic-polymer microbeads via covalent bonds and electrostatic interactions, respectively.39 The geometrical features and CL properties of the ensemble materials were subsequently characterized by multiple techniques including SEM, fluorescence spectroscopy, fluorescence microscopy and CL measurements with a CL meter. SEM images demonstrated a broad size distribution of spherical microbeads ranging from 40 to 110 microns (Fig. S1†). The presence of ABEI was confirmed by the steady-state fluorescence spectrum and the fluorescence imaging of single microbeads (Fig. S2†). Successful loading of ABEI molecules is undoubtedly supported by CL measurements with a CL meter. As shown in Fig. S3,† strong CL emission was observed by mixing the as-prepared microbeads with H2O2 solution.The CL imaging of single microbeads was subsequently examined by using a home-built CL microscope combined with a specifically designed microfluidics set-up as shown in Fig. 1. Detailed descriptions and a photograph of the microscope are provided in the ESI (Fig. S4†). In order to firmly trap and immobilize the microbeads on a slide, a drop of suspension containing the microbeads was deposited onto a particularly fabricated polydimethylsiloxane (PDMS) substrate (Fig. S5†). It contained an array of tens of microwells with varying diameter and depth from 40 to 100 microns, so that the single microbeads can keep their original location without moving during the solution exchange operation. This was not only necessary for extracting the CL kinetics with image analysis, but also particularly important for characterizing the very same microbeads after the reaction by using CFM and SEM. Without the help of these microwells, rinsing and air-drying procedures could easily move these microbeads and make it impossible to correlate between CL images and SEM images. A capillary force-based pump-free fluidics set-up was also designed to deliver H2O2 solution without introducing mechanical vibrations and pulsations. The device was put on the sample stage of an up-right microscope equipped with an EMCCD and an objective (numerical aperture = 0.30). The relatively large depth of field of the objective (∼10 microns, comparable with the size of microbeads) increased the collection efficiency of defocused photons. The entire setup was placed in a dark-room and all the LED indicators on the instrument panels were either turned off or covered by thick black tape to reduce the background photons as much as possible. In a typical experiment, the microbeads were exposed to buffer solution for 10 seconds in order to record a baseline in the dark. Then H2O2 solution was manually introduced into the chamber to trigger the CL reactions. The emitted photons were collected by the objective to create a series of time-lapsed CL images in the camera with a typical exposure time of 0.5 seconds. The open-source software ImageJ was used to extract the CL kinetics of each individual particle from the image sequences. The representative CL image was reconstructed by averaging all the CL images obtained during the recording period to improve the signal-to-background ratio (upper right panel in Fig. 1).
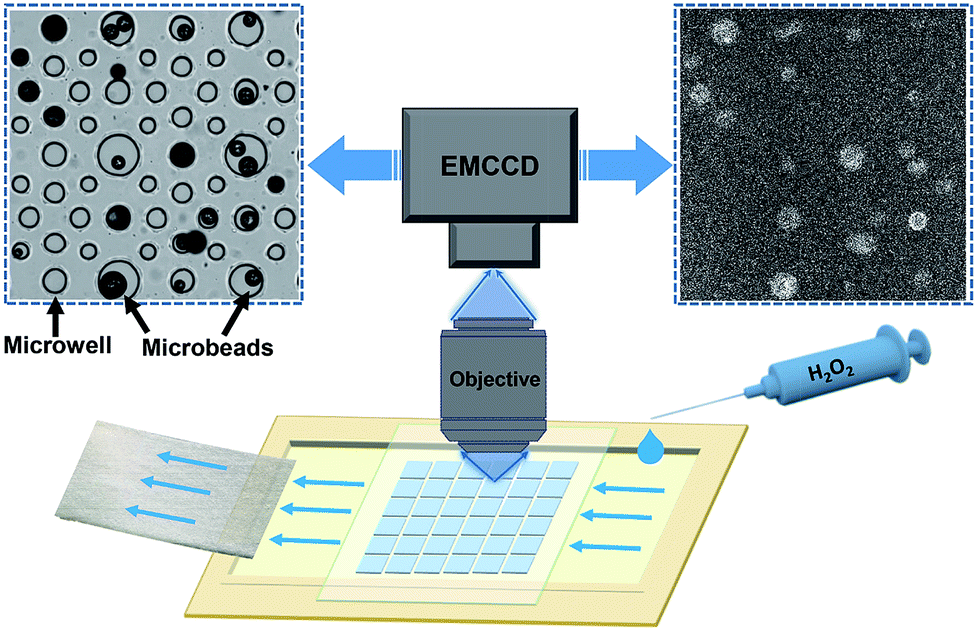 | ||
| Fig. 1 Schematic illustration of the CL imaging setup and the CL image of single microbeads. | ||
Enhanced and delayed CL emission from the minority subpopulation
Fig. 2A shows the bright-field image of 21 microbeads trapped in microwells. Six snapshots at different moments during the CL reactions are shown in Fig. 2B. While almost every microbead exhibits CL activity upon the exposure to H2O2, the CL behaviors are rather inhomogeneous (Movie S1†). Representative CL curves of 6 microbeads are provided in Fig. 2C, while the locations of these individuals are marked in Fig. 2A and B. According to the dramatically different CL intensities and kinetics, they can be divided into two types such as strong and weak emission subpopulations, respectively. While the majority of microbeads (#1–5) exhibit an immediate but weak CL emission as shown in Fig. 2B, microbead #6 shows delayed but much stronger CL emission (blue curve). Its maximal CL intensity is 7 times higher than that of the fast-type ones. The curve integration, which reflected the total amount of CL molecules, varied by more than 25 times. Statistical analysis has shown that only one individual particle with strong-type CL emission was observed in a sample set of over 500 microbeads (Fig. S6†). It is clear that the strong-type subpopulation is more desirable in CL assays because the intensified emission increases the signal and improves the detection limit. In addition, because solution mixing usually takes a few seconds and it is difficult to reliably record the CL signal during this period of time, delayed or extended emission further helps the signal acquisition.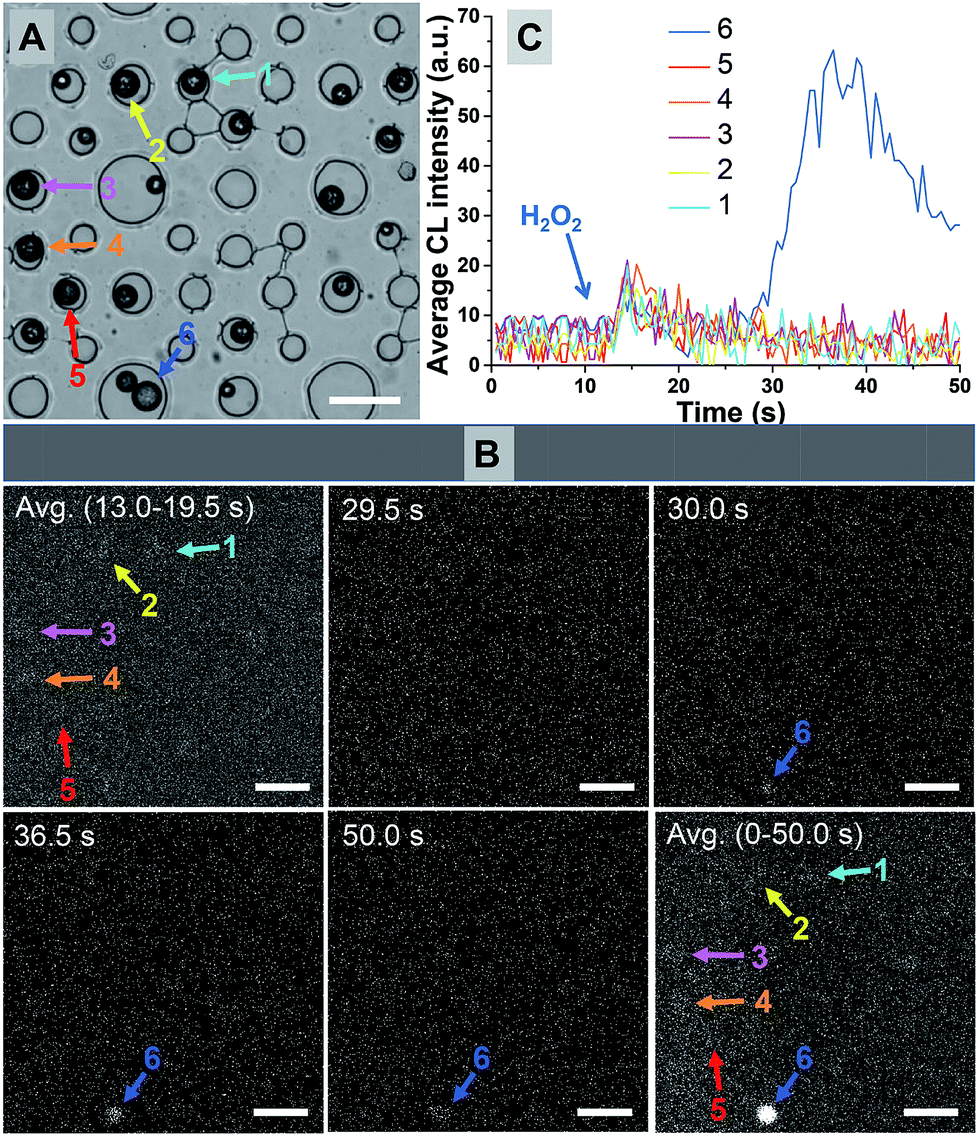 | ||
| Fig. 2 (A) Bright field image (scale bar: 100 μm) of multiple microbeads trapped in the microwells. (B) Snapshots at different moments and the averaged CL images upon reaction with H2O2 (scale bar: 100 μm). (C) Representative CL kinetics curves of six microbeads showing weak (1–5) and strong (6) emission, respectively. | ||
Structure–activity relationship
In order to investigate the structural basis of different CL behaviors, the SEM images of the very same individual particles were obtained and are shown in Fig. 3A (#6 in Fig. 2A) and 3B (#2 in Fig. 2A), respectively. However, the SEM images do not reveal much difference because SEM is not capable of accessing the internal structures when the shell is intact. Therefore, confocal fluorescence microscopy was further utilized to characterize the 3-dimensional distribution of ABEI molecules, which revealed significantly different features in the internal structures between strong (Fig. 3C) and weak-type (Fig. 3D) microbeads. CFM is applicable because the oxidation product of ABEI (ABEI-ox) is fluorescent (Fig. S2†). The CFM images of a typical strong and weak-type microbead are displayed in Fig. 3C and D, respectively. The fluorescence emission spectrum of the as-prepared microbeads obtained upon excitation at 355 nm after thorough reactions with H2O2 is shown in Fig. 3E. The FL emission spectrum of single microbeads shows a band centered at 460 nm, which is in good agreement with the steady-state FL spectrum (Fig. 3F), which was from the oxidation products of ABEI.35 Note that these images were taken at a z-distance (from the substrate) close to its radius so that the centroid of the microbead is located within the focal plane (Fig. S7†). Thus the CFM images demonstrated the spatial distribution of ABEI-ox molecules in the microbeads. We noted two differences in the CFM images between strong (Fig. 3C) and weak-type (Fig. 3D) microbeads. First, the FL intensity of the weak-type microbead is significantly lower than that of the strong-type one, indicating different encapsulation efficiencies of ABEI among individual particles. The mean intensity varied by up to 41 times. This difference explained the more than 25-fold difference in the integration value of representative CL curves. Second, multiple local enrichments of ABEI were observed in the strong-type microbead, while a hollow (dark) center existed in the weak-type one. Such local enrichments were attributed to an amorphous multi-core structure, in which multiple smaller sized microbeads were encapsulated in a large one. The existence of amorphous multi-core structure was confirmed by the SEM image of a microbead that occasionally broke exposing the inner content (Fig. S1B†). Because the covalent linkage of ABEI onto the polymer skeleton required the diffusion of ABEI into the porous structure, one would expect that the inner core of a dense solid microsphere should display very low linkage efficiency. This was the scenario in the weak-type microbead (Fig. 3D). | ||
| Fig. 3 Representative SEM images (A and B) and CFM images (C and D) of strong-type (A and C) and weak-type (B and D) microbeads. Fluorescence spectra of microbeads obtained from (E) an imaging spectrometer in a confocal microscope and (F) a steady-state fluorescence spectrometer. (G) Chemical mechanism of CL reaction on ABEI/Co2+ functionalized microbeads. | ||
The intense CL emission in strong-type microbeads was attributed to the increased chemical activity of both Co2+ and ABEI molecules and the physical accessibility of H2O2 as a result of multi-core structures. Earlier studies demonstrated that CL catalysis and enhancement of the ABEI–H2O2 system were regulated by the generation of oxygen-related radicals and an improved electron transfer.40 Our previous work proposed that Co2+ could catalyze the decomposition of H2O2 to form oxygen-related radicals, such as HO˙ and O2˙−, followed by the reaction with ABEI to produce ABEI radicals, accelerating the CL reaction (Fig. 3G).41 It was also reported that the attachment of Co2+ to a rigid polymer resulted in an increase in the catalytic activity and the stability of the catalyst.42 Thus, it is believed that Co2+ coordinated by hydroxyl groups on the inside wall of the microbeads with amorphous multi-core structure exhibited outstanding heterogeneous catalytic activity on the CL reaction, leading to the enhanced CL emission. Furthermore, as a result of the unique internal structure, H2O2 could only slowly diffuse to the active site inside the microbeads through numerous micro/nano-sized pores on the particles. Interestingly, when H2O2 slowly diffuses to the active site inside the particles, the oxygen-related radicals generated from the catalytic decomposition reaction of H2O2 also could diffuse out only slowly, resulting in an increase in the concentration of oxygen-related radicals. They significantly enhanced the CL reaction and the following CL emission.35 Because of the slow diffusion rate of H2O2 and oxygen-related radicals, the CL reaction is a slow-diffusion-controlled process and could produce stronger emission.
Rational design of microbeads with improved CL properties
The synthesis procedure was rationally adjusted to increase the possibility of producing amorphous multi-core structures. A hydrophobic reagent was used as a base material to form the framework in microbeads, and a hydrophilic agent was used for providing carboxyl groups, which was for further coupling reactions with ABEI and Co2+. However, superfluous hydrophilic reagent could make it difficult to form regular shaped microbeads while insufficient hydrophilic agent will significantly reduce the functional efficiency of ABEI and Co2+. Moreover, it is known that larger microbeads could only be formed under relatively low speed stirring and smaller microbeads were mainly generated under vigorous stirring. Therefore, a suitable ratio of hydrophilic and hydrophobic reagents was first optimized to obtain small microbeads under vigorous stirring. Second, hydrophilic reagents and hydrophobic reagents were added again in the suspension under gentle stirring to obtain larger microbeads, accompanied by doping small microbeads into their inside wall. Thus, the ratio of amorphous multi-core structures was significantly increased.Under the optimized conditions, the ratio of amorphous multi-core structures increased from 0.2% to 13% according to the statistics of a sample set of over 500 (Fig. S6†). It is further examined by CL imaging experiments as shown in Fig. 4. Fig. 4A and B show the bright-field image of 4 individual microbeads and their CL kinetics curves, respectively. Six snapshots at different moments and the representative CL kinetics of 4 individuals are shown in Fig. 4C. In contrast to the old batch of microbeads (Fig. 2B), many individual particles now exhibit intense and extended CL emission (Movie S2†), suggesting the significant improvement in both the ABEI encapsulation and the reaction rate.
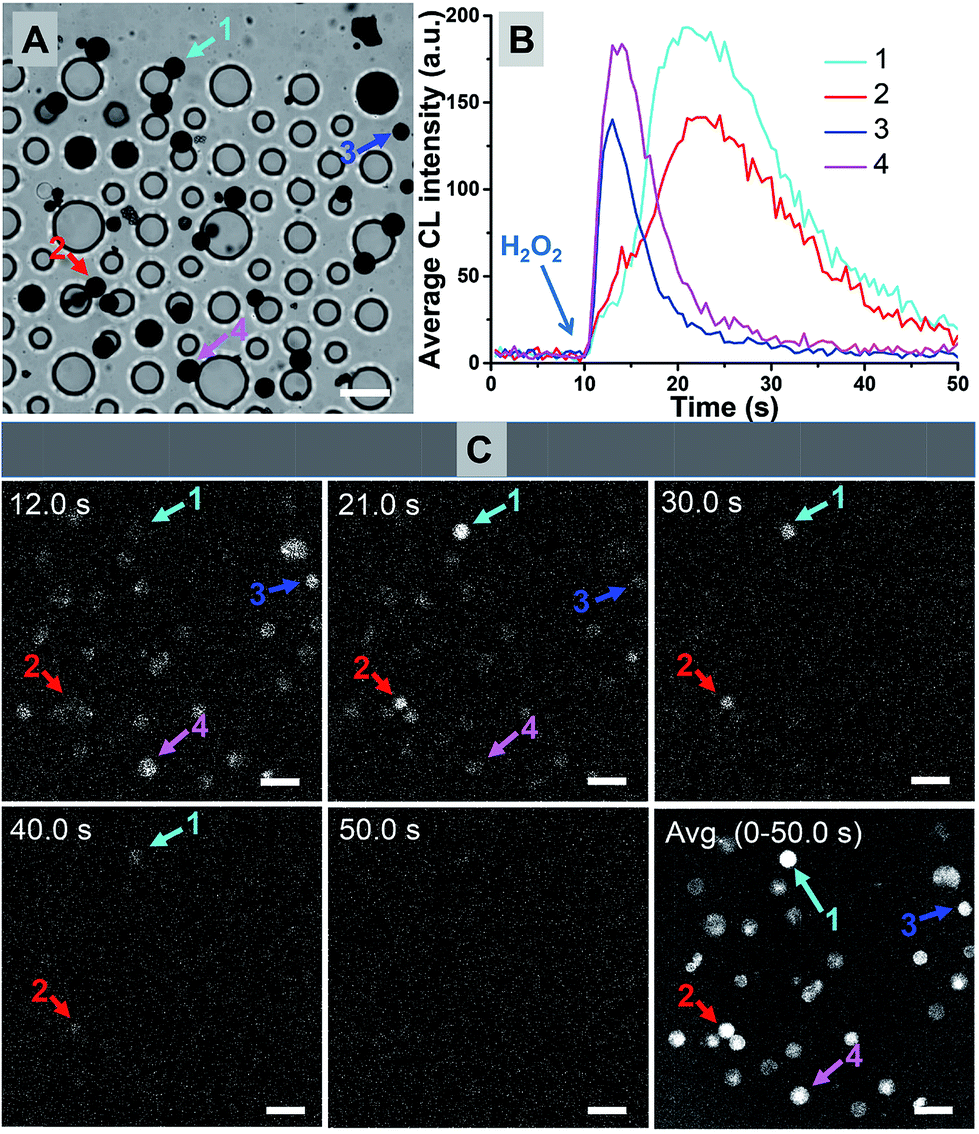 | ||
| Fig. 4 (A) Bright field image of microbeads trapped in microwells (scale bar: 100 μm). (B) CL kinetics curves of single particles 1/2/3/4 from the new batch of microbeads upon reaction with H2O2. (C) Snapshots at different moments and the averaged CL images from the new batch of microbeads (scale bar: 100 μm). | ||
The analytical performance of the CL assay was significantly improved by using the new batch of microbeads at the ensemble level. The principle, condition optimization and interference test were conducted according to our previous publication (ESI†).39 Briefly, microbeads were functionalized with aptamer molecules that can recognize a small molecule compound, TNT, which is one of the most classic explosives for military/terrorist purposes. The existence of analytes decreased the inhibition effect of the TNT aptamer on CL intensity, and led to enhanced CL emission upon injection of H2O2. The average CL emission intensity of an ensemble suspension of magnetic microbeads was measured by using a conventional CL meter containing a 96-well microplate (Fig. 5A). The CL intensity at the same concentration of the analyte was greatly increased by 9 times on curve integration. By using the new batch of microbeads, the analytical performance was found to be greatly improved as shown in Fig. 5B. For example, the detection limit, which was calculated from the CL signals of blank samples and three times of their standard deviation, was improved by 53 times from 113 pg mL−1 to 2.14 pg mL−1, and the dynamic range was further expanded by 2 orders of magnitude. As shown in Fig. 5C and D, the analyte could be detected in the range of 0.2–75 ng mL−1 by using the old batch of microbeads while the dynamic range by using the new batch of microbeads is 0.005–100 ng mL−1. The improved analytical performance is a result of the enhanced CL emission of magnetic microbeads. The consistency between single particle CL imaging experiments and ensemble measurements in a practical CL assay convincingly underscored the value of the rational design guided by single particle studies.
 | ||
| Fig. 5 (A) Comparison of CL kinetics curves of old (curve a) and new (curve b) batches of microbeads. (B) Comparison of CL responses of the aptasensor based on old (line a) and new (line b) batches of microbeads using different concentrations of TNT. (C) CL kinetics curves of the TNT aptasensor based on the old batch of microbeads at concentrations of (a) 0, (b) 0.20, (c) 0.50, (d) 1.0, (e) 5.0, (f) 10, (g) 50, and (h) 75 ng mL−1. Inset: the calibration curve for TNT. (D) CL kinetics curves of the TNT aptasensor based on the new batch of microbeads at concentrations of (a) 0, (b) 0.005, (c) 0.010, (d) 0.050, (e) 0.10, (f) 0.50, (g) 1.0, (h) 5.0, (i) 10, (j) 50 and (k) 100 ng mL−1. Inset: the calibration curve for TNT. | ||
Conclusions
In conclusion, we have proposed an optical imaging approach to monitor the CL reaction kinetics of single magnetic-polymer microbeads functionalized with ABEI and Co2+ when reacting with H2O2, which were synthesized for use in a practical CL assay. The CL imaging and kinetics curve of single particles in a chemical reaction were obtained for the first time. Simultaneous imaging of multiple particles allowed for distinguishing two subpopulations that exhibit weak and strong CL emissions, respectively. Characterization of the spatial distribution of ABEI molecules with CFM and SEM resolved amorphous multi-core structures that were responsible for the strong and delayed emission. Such structures led to the improved CL emission and kinetics because of the significantly higher encapsulation efficiency of ABEI, improved chemical activity of Co2+ and ABEI molecules, and the optimized accessibility of H2O2. Such a structure–activity relationship was immediately utilized to rationally guide the design of microbeads. The improved CL activity was validated by both CL imaging at the single particle level and CL assay at the ensemble level. Both approaches confirmed that the optimized batches exhibited enhanced CL emission as well as improved analytical performance. The present work demonstrated the capability of CL imaging to investigate the structure–activity relationship in a bottom-up manner, and the validation of such a relationship by ensemble performance further underscored the value of single particle studies for the rational design and optimization of functional materials in practical reaction systems.Experimental section
Preparation of the old batch of microbeads
First, 0.01 g of azobisisobutyronitrile (AIBN) and 1.0 mL of styrene was added into 100 mL of ultrapure water containing 0.1 g of Fe3O4 seeds under vigorous stirring at 70 °C. Besides, N2 flow was passed through the reacting solution slowly during the entire process of preparation to remove O2. Following 30 min of reaction, a mixture of 10 mL of polyvinyl alcohol (PVA) (5%), 0.2 g of AIBN, 10 mL of styrene and 1.0 g of methacrylic acid was added to the suspension under gentle stirring. After 24 h reaction at 70 °C, the resulting suspension was washed several times with water. Finally, the resulting microbeads were dispersed in ultrapure water for further use.Preparation of the optimized batch of microbeads
In a typical synthesis, 0.01 g of AIBN, 1.0 mL of styrene and 0.1 mL of methacrylic acid were added to 100 mL of ultrapure water containing 0.1 g of Fe3O4 seeds under vigorous stirring at 70 °C and O2 was removed by passing N2 through the reacting solution rapidly in the entire preparation process. After 30 min reaction, 10 mL of PVA (5%), 0.2 g of AIBN, 10 mL of styrene and 2.0 g of methacrylic acid were added to the suspension under gentle stirring at 70 °C. Following 24 h reaction, the final product was washed several times and dispersed in ultrapure water for further use.Preparation of CL functionalized microbeads
In a typical synthesis,39 6.0 mL of microbead suspension was washed thrice with 2-(N-morpholino)ethanesulfonic acid (MES) buffer after ultrasonication for 5 min. Subsequently, the suspension was dispersed in 6.0 mL of MES buffer containing 200 mg of EDC and 200 mg of NHS under vigorous stirring at room temperature. Following 30 min activation, the mixture was washed twice with washing buffer, followed by the addition of 200 μL of ABEI (10 mM) stock solution under continuous stirring. After 12 h reaction at room temperature, the resulting ABEI/microbeads were washed thrice and resuspended in ultrapure water. 1.0 mL of Co2+ aqueous solution (10 mM) was added to 0.5 mL of ABEI/microbead suspension and incubated at room temperature for 20 min under constant shaking. Finally, the resulting suspension was washed twice and dispersed in 2.0 mL of ultrapure water. The optimal Co2+/ABEI ratio of 15.5 was chosen for further experiments (Fig. S8†).Preparation of PDMS apparatus
Typically, the microwells were produced by a one-step casting replication process.43 A silicon wafer mould with an array of micrometer-sized cylinders was designed by us, and then manufactured by Suzhou Wenhao Co., Ltd. (China). A mixture of the PDMS base and the curing reagent (the mass ratio of PDMS base/curing reagent was 10![[thin space (1/6-em)]](https://www.rsc.org/images/entities/char_2009.gif) :1) was poured on the salinized silicon mould and cured at 80 °C for 30 min. After curing, the PDMS film was released from the mould in air. Then the as-prepared PDMS film was placed on a hotplate that was heated to 60 °C for 2 h. Finally, the PDMS film with microwells was cut into several slices with suitable size to obtain the PDMS apparatus for further use.
:1) was poured on the salinized silicon mould and cured at 80 °C for 30 min. After curing, the PDMS film was released from the mould in air. Then the as-prepared PDMS film was placed on a hotplate that was heated to 60 °C for 2 h. Finally, the PDMS film with microwells was cut into several slices with suitable size to obtain the PDMS apparatus for further use.
Data availability
The authors declare that all the data are available within the article and its ESI† or from the corresponding author upon reasonable request.Author contributions
W. K. and Q. L. carried out the experimental work. W. K., W. W. and H. C. designed the project and wrote the manuscript. X. Z. prepared the microbeads. W. K., S. J. and Q. Z. completed the confocal fluorescence microscopy imaging and discussed the results together. T. Z. was involved in studies on CL imaging. W. S. helped with the discussion of the results.Conflicts of interest
The authors declare no competing financial interests.Acknowledgements
The support of this research by the National Natural Science Foundation of China (Grant No. 21527807) and the National Key Research and Development Program of China (Grant No. 2016YFA0201300) is gratefully acknowledged.Notes and references
- I. L. C. Buurmans and B. M. Weckhuysen, Nat. Chem., 2012, 4, 873–886 CrossRef CAS PubMed.
- J. B. Sambur and P. Chen, Annu. Rev. Phys. Chem., 2014, 65, 395–422 CrossRef CAS PubMed.
- J. B. Sambur, T. Y. Chen, E. Choudhary, G. Q. Chen, E. J. Nissen, E. M. Thomas, N. M. Zou and P. Chen, Nature, 2016, 530, 77–80 CrossRef CAS PubMed.
- T. Chen, B. Dong, K. Chen, F. Zhao, X. Cheng, C. Ma, S. Lee, P. Zhang, S. H. Kang, J. W. Ha, W. Xu and N. Fang, Chem. Rev., 2017, 117, 7510–7537 CrossRef CAS PubMed.
- W. Wang, Chem. Soc. Rev., 2018, 47, 2485–2508 RSC.
- X. Zhou, N. M. Andoy, G. Liu, E. Choudhary, K. S. Han, H. Shen and P. Chen, Nat. Nanotechnol., 2012, 7, 237–241 CrossRef CAS PubMed.
- K. P. F. Janssen, G. De Cremer, R. K. Neely, A. V. Kubarev, J. Van Loon, J. A. Martens, D. E. De Vos, M. B. J. Roeffaers and J. Hofkens, Chem. Soc. Rev., 2014, 43, 990–1006 RSC.
- Q. Miao and K. Pu, Adv. Mater., 2018, 30, 1801778 CrossRef PubMed.
- C. Novo, A. M. Funston and P. Mulvaney, Nat. Nanotechnol., 2008, 3, 598–602 CrossRef CAS PubMed.
- S. Li, Y. Du, T. He, Y. Shen, C. Bai, F. Ning, W. Wang, S. Xi and X. Zhou, J. Am. Chem. Soc., 2017, 139, 14277–14284 CrossRef CAS PubMed.
- E. M. van Schrojenstein Lantman, T. Deckert-Gaudig, A. J. G. Mank, V. Deckert and B. M. Weckhuysen, Nat. Nanotechnol., 2012, 7, 583–586 CrossRef CAS PubMed.
- J. H. Zhong, X. Jin, L. Y. Meng, X. Wang, H. S. Su, Z. L. Yang, C. T. Williams and B. Ren, Nat. Nanotechnol., 2017, 12, 132–136 CrossRef CAS PubMed.
- C. Y. Wu, W. J. Wolf, Y. Levartovsky, H. A. Bechtel, M. C. Martin, F. D. Toste and E. Gross, Nature, 2017, 541, 511–515 CrossRef CAS PubMed.
- X. N. Shan, I. Diez-Perez, L. J. Wang, P. Wiktor, Y. Gu, L. H. Zhang, W. Wang, J. Lu, S. P. Wang, Q. H. Gong, J. H. Li and N. J. Tao, Nat. Nanotechnol., 2012, 7, 668–672 CrossRef CAS PubMed.
- D. Jiang, Y. Y. Jiang, Z. M. Li, T. Liu, X. Wo, Y. M. Fang, N. J. Tao, W. Wang and H. Y. Chen, J. Am. Chem. Soc., 2017, 139, 186–192 CrossRef CAS PubMed.
- X. C. Zhou, E. Choudhary, N. M. Andoy, N. M. Zou and P. Chen, ACS Catal., 2013, 3, 1448–1453 CrossRef CAS.
- F. C. Hendriks, S. Mohammadian, Z. Ristanovic, S. Kalirai, F. Meirer, E. T. C. Vogt, P. C. A. Bruijnincx, H. C. Gerritsen and B. M. Weckhuysen, Angew. Chem., Int. Ed. Engl., 2018, 57, 257–261 CrossRef CAS PubMed.
- G. K. Hodgson, S. Impellizzeri and J. C. Scaiano, Chem. Sci., 2016, 7, 1314–1321 RSC.
- Z. Ristanovic, J. P. Hofmann, G. De Cremer, A. V. Kubarev, M. Rohnke, F. Meirer, J. Hofkens, M. B. J. Roeffaers and B. M. Weckhuysen, J. Am. Chem. Soc., 2015, 137, 6559–6568 CrossRef CAS PubMed.
- G. T. Whiting, N. Nikolopoulos, I. Nikolopoulos, A. D. Chowdhury and B. M. Weckhuysen, Nat. Chem., 2019, 11, 23–31 CrossRef CAS PubMed.
- K. Aslan and C. D. Geddes, Chem. Soc. Rev., 2009, 38, 2556–2564 RSC.
- L. Z. Hu and G. B. Xu, Chem. Soc. Rev., 2010, 39, 3275–3304 RSC.
- F. Deiss, C. N. LaFratta, M. Symer, T. M. Blicharz, N. Sojic and D. R. Walt, J. Am. Chem. Soc., 2009, 131, 6088–6089 CrossRef CAS PubMed.
- L. X. Zhao, L. Sun and X. G. Chu, TrAC, Trends Anal. Chem., 2009, 28, 404–415 CrossRef CAS.
- Y. Chen, S. W. Zhou, L. L. Li and J. J. Zhu, Nano Today, 2017, 12, 98–115 CrossRef CAS.
- M. Zhao, Y. Zhuo, Y. Q. Chai and R. Yuan, Biomaterials, 2015, 52, 476–483 CrossRef CAS PubMed.
- A. J. Shuhendler, K. Pu, L. Cui, J. P. Uetrecht and J. Rao, Nat. Biotechnol., 2014, 32, 373–380 CrossRef CAS PubMed.
- X. Zhen, C. Zhang, C. Xie, Q. Miao, K. L. Lim and K. Pu, ACS Nano, 2016, 10, 6400–6409 CrossRef CAS PubMed.
- H. L. Zhang, M. X. Liu, G. M. Huang, Y. Q. Yu, W. Shen and H. Cui, J. Mater. Chem. B, 2013, 1, 970–977 RSC.
- M. Sentic, M. Milutinovic, F. Kanoufi, D. Manojlovic, S. Arbault and N. Sojic, Chem. Sci., 2014, 5, 2568–2572 RSC.
- L. S. Dolci, S. Zanarini, L. Della Ciana, F. Paolucci and A. Roda, Anal. Chem., 2009, 81, 6234–6241 CrossRef CAS PubMed.
- S. Pan, J. Liu and C. M. Hill, J. Phys. Chem. C, 2015, 119, 27095–27103 CrossRef CAS.
- M. J. Zhu, J. B. Pan, Z. Q. Wu, X. Y. Gao, W. Zhao, X. H. Xia, J. J. Xu and H. Y. Chen, Angew. Chem., Int. Ed. Engl., 2018, 57, 4010–4014 CrossRef CAS PubMed.
- A. J. Wilson, K. Marchuk and K. A. Willets, Nano Lett., 2015, 15, 6110–6115 CrossRef CAS PubMed.
- Y. T. Liu, W. Shen, Q. Li, J. N. Shu, L. F. Gao, M. M. Ma, W. Wang and H. Cui, Nat. Commun., 2017, 8, 1003 CrossRef PubMed.
- F. Li, Y. Q. Yu, Q. Li, M. Zhou and H. Cui, Anal. Chem., 2014, 86, 1608–1613 CrossRef CAS PubMed.
- Z. L. Han, J. N. Shu, Q. S. Jiang and H. Cui, Anal. Chem., 2018, 90, 6064–6070 CrossRef CAS PubMed.
- H. L. Zhang and H. Cui, Nanoscale, 2014, 6, 2563–2566 RSC.
- W. J. Kong, X. N. Zhao, Q. J. Zhu, L. F. Gao and H. Cui, Anal. Chem., 2017, 89, 7145–7151 CrossRef CAS PubMed.
- G. H. Thorpe and L. J. Kricka, Methods Enzymol., 1986, 133, 331–353 CAS.
- M. Liu, H. Zhang, J. Shu, X. Liu, F. Li and H. Cui, Anal. Chem., 2014, 86, 2857–2861 CrossRef CAS PubMed.
- F. Ramirez, M. Nowakowski and J. F. Marecek, J. Am. Chem. Soc., 1977, 99, 4515–4517 CrossRef CAS.
- J. L. Tan, J. Tien, D. M. Pirone, D. S. Gray, K. Bhadriraju and C. S. Chen, Proc. Natl. Acad. Sci. U. S. A., 2003, 100, 1484–1489 CrossRef CAS PubMed.
Footnotes |
| † Electronic supplementary information (ESI) available. See DOI: 10.1039/c9sc00954j |
| ‡ Weijun Kong and Qi Li contributed equally to this work. |
| This journal is © The Royal Society of Chemistry 2019 |