 Open Access Article
Mechanistic studies of a “Declick” reaction†
Margaret K.
Meadows‡
a,
Xiaolong
Sun‡
 b,
Igor V.
Kolesnichenko
 c,
Caroline M.
Hinson
 d,
Kenneth A.
Johnson
*e and
Eric V.
Anslyn
 *d
*d
aDepartment of Chemistry, Mercer University, 1501 Mercer University Dr., Macon, Georgia 31207, USA
bThe Key Laboratory of Biomedical Information Engineering of Ministry of Education, School of Life Science and Technology, Xi'an Jiaotong University, Xi'an 710049, P. R. China
cPhotovoltaics & Materials Technology Department, Sandia National Laboratories, PO Box 5800, MS 0734, Albuquerque, New Mexico 87185, USA
dDepartment of Chemistry, University of Texas at Austin, Austin, Texas 78712, USA. E-mail: anslyn@austin.utexas.edu
eInstitute for Cellular and Molecular Biology, Department of Molecular Biosciences, University of Texas, Austin, Texas 78712, USA
First published on 13th August 2019
Abstract
A kinetic analysis of a “declick” reaction is described. Compound 1, previously reported to couple an amine and a thiol (i.e. “click”) under mild aqueous conditions to create 2, undergoes release of the unaltered coupling partners upon triggering with dithiothreitol (DTT). In the study reported herein various aniline derivatives possessing para-electron donating and withdrawing groups were used as the amines. UV/vis spectroscopy of the declick reaction shows time-dependent spectra lacking isosbestic points, implying a multi-step mechanism. Global data fitting using numerical integration of rate equations and singular value decomposition afforded the spectra and time-dependence of each species, as well as rate constants for each step. The kinetic analysis reveals a multi-step process with an intermediate where both thiols of DTT have added prior to expulsion of the aniline leaving group, followed by rearrangement to the final product. Hammett plots show a negative rho value on two of the steps, indicating positive charge building (i.e. reduction of a negative charge) in the step leading to the intermediate and its rate-determining breakdown. Overall, the kinetic study reported herein gives a complete mechanistic picture of the declick reaction.
Introduction
Recently our group reported compound 1, a simple derivative of Meldrum's acid, which is capable of coupling (i.e. clicking) amines and thiols (Scheme 1).1 Using 1, mono-addition of a primary amine followed by exchange of the thiol occurs in a 5![[thin space (1/6-em)]](https://www.rsc.org/images/entities/char_2009.gif) :
:![[thin space (1/6-em)]](https://www.rsc.org/images/entities/char_2009.gif) 1 pH 7 phosphate buffer
1 pH 7 phosphate buffer![[thin space (1/6-em)]](https://www.rsc.org/images/entities/char_2009.gif) :
:![[thin space (1/6-em)]](https://www.rsc.org/images/entities/char_2009.gif) acetonitrile mixture with sparging to give structures such as 2. The amine and thiol can be recovered upon addition of cysteine or dithiothreitol (DTT), what we referred to as a “declick”. This returns the original amine and thiol without modification and generates product 3.
acetonitrile mixture with sparging to give structures such as 2. The amine and thiol can be recovered upon addition of cysteine or dithiothreitol (DTT), what we referred to as a “declick”. This returns the original amine and thiol without modification and generates product 3.
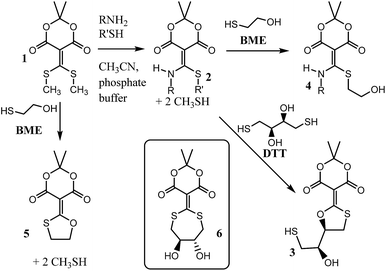 | ||
| Scheme 1 General scheme for the coupling of an amine and thiol using 1, and the “declicking” using DTT or BME. | ||
Interestingly, structure 2 does not declick with β-mercaptoethanol (BME), which is essentially half the structure of DTT. Instead, the thiols exchange to give 4, with no removal of the amine.2 This observation suggests that the second thiol of DTT plays an essential role in the declicking mechanism of 2. This is in contrast to the reaction of 1 with BME, which we previously have shown is a second order reaction, first order in both 1 and BME, in which the UV/vis spectra have two observable species (reactant 1 and product 5) with isosbestic points.2 Thus, while BME can remove two thiols from 1, DTT is required to remove an amine and a thiol from 2.
To explain the difference between the reactivity of 2 with DTT and BME, we previously postulated the intermediacy of a seven-membered ring (i.e.6) that rearranges to 3.1,2 Hence, to study this reaction in detail and confirm or refute such an intermediate, we commenced a mechanistic analysis of the declicking reaction with DTT and several versions of 2 where the R-groups were aniline derivatives (referred to herein as 2Ph-X, where X is a variety of substituents). The study primarily relies on kinetics, which turned out to be more complicated than expected, but which definitely supports a mechanism involving intermediate 6, as well as other unanticipated intermediates and products as described here.
Kinetics play a key role in mechanistic physical organic methods to define the chemical steps involved in complex organic transformations.3,4 Rigorous kinetic analysis can determine the pathway of a reaction and identify intermediates.5,6 In performing kinetic analysis, a common approach is to derive an integrated form of the rate equations. For more complex models, simplifying approximations needed to solve the equations may not be valid and fitting data to multiple exponential functions is unreliable. Fitting data based on numerical (rather than analytical) integration of rate equations overcomes the limitations of conventional fitting and returns intrinsic rate constants rather than eigenvalues.7 In addition, fitting time-dependent spectra based on singular value decomposition allows complex observable spectra to be deconvoluted to reveal the underlying spectra and time-dependence of each species.8–10
Here we combine the use of singular value decomposition (SVD) with numerical integration of rate equations to globally fit time-resolved spectra collected at several concentrations of reactants. The approach provides intrinsic rate constants for each step in the reaction and defines the spectra for each species. Confidence contour analysis provides a robust assessment of the extent to which each rate constant is constrained by the data.11–13
Results and discussion
In our efforts to better understand the declicking mechanism, we employed aniline derivatives of 2 instead of the previously reported primary alkyl amines. This imparted a chromophore to the structures and allowed us to vary the electronics via substituent changes (–X) on the para position (2Ph-X). Aniline adds cleanly to conjugate acceptor 1 in pH 7 phosphate buffer/acetonitrile (5![[thin space (1/6-em)]](https://www.rsc.org/images/entities/char_2009.gif) :
:![[thin space (1/6-em)]](https://www.rsc.org/images/entities/char_2009.gif) 1) to give 2 (R
1) to give 2 (R![[double bond, length as m-dash]](https://www.rsc.org/images/entities/char_e001.gif) Ph, R′
Ph, R′![[double bond, length as m-dash]](https://www.rsc.org/images/entities/char_e001.gif) CH3) in the same fashion as previously reported for primary alkyl amines.1 A range of p-substituted anilines with both electron donating and electron withdrawing groups were tested and each were found to be capable of displacing methyl mercaptan from 1 (Table 1). Full characterization of each derivative 2Ph-X is given in the ESI Section VII.†
CH3) in the same fashion as previously reported for primary alkyl amines.1 A range of p-substituted anilines with both electron donating and electron withdrawing groups were tested and each were found to be capable of displacing methyl mercaptan from 1 (Table 1). Full characterization of each derivative 2Ph-X is given in the ESI Section VII.†
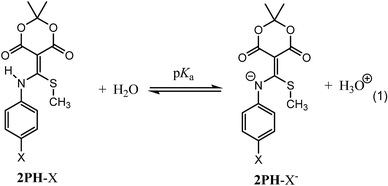
Prior to examining the kinetics of the reactions of 2Ph-X's with DTT, we sought to determine any pH dependence that may be involved. Hence, the pKa of each derivative of 2Ph-X (eqn (1), and Table 1) was determined via standard potentiometric titration in a (2![[thin space (1/6-em)]](https://www.rsc.org/images/entities/char_2009.gif) :
:![[thin space (1/6-em)]](https://www.rsc.org/images/entities/char_2009.gif) 1) H2O/MeOH mixture (ESI Fig. S1 to S6†). The values range between 4.34 and 6.65, with the expected trend of more electron withdrawing groups showing a lower pKa and electron donating groups increasing the pKa. The relationship between these pKa values was described via a Hammett linear free energy relationship (LFER) (Fig. 1).14 This Hammett plot reveals a rho value of 2.4, indicating that the sensitivity of this acid/base reaction is greater than that of the ionization of benzoic acid.
1) H2O/MeOH mixture (ESI Fig. S1 to S6†). The values range between 4.34 and 6.65, with the expected trend of more electron withdrawing groups showing a lower pKa and electron donating groups increasing the pKa. The relationship between these pKa values was described via a Hammett linear free energy relationship (LFER) (Fig. 1).14 This Hammett plot reveals a rho value of 2.4, indicating that the sensitivity of this acid/base reaction is greater than that of the ionization of benzoic acid.
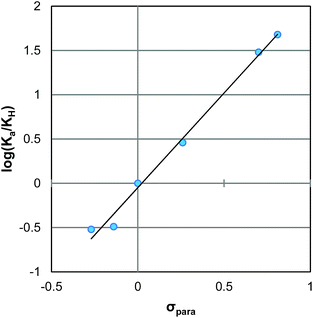 | ||
| Fig. 1 Hammett plot for the ionization of compounds 2Ph-X (Table 1). | ||
As a second control study, prior to the analysis of the kinetics of the aniline derivatives of 2Ph-X with DTT, we confirmed that 2Ph-H would not “declick” the aniline upon reaction with BME, as we previously found would not occur with alkyl amine versions of 2. Indeed, upon stirring 2Ph-H with BME there were only slight UV/vis spectral changes (Fig. S7†), while LCMS detected incorporation of BME in place of methyl mercaptan. Thus, while thiols dynamically scramble with the 2Ph-X compounds, BME does not lead to release of the aniline.
Kinetic analysis of 2Ph-H in detail
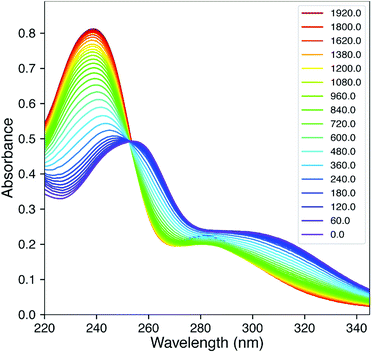
Fig. 2 shows the time-dependent UV/vis traces of the reaction of 2Ph-H with DTT in pH 6.8 (2![[thin space (1/6-em)]](https://www.rsc.org/images/entities/char_2009.gif) :
:![[thin space (1/6-em)]](https://www.rsc.org/images/entities/char_2009.gif) 1) H2O/MeOH mixture. As can be observed, there is a lack of isosbestic points, meaning that one or more intermediates are spectroscopically observable, and the reactions proceed at rates such that the individual steps are not separated cleanly with time during the reaction. Moreover, this means that reactions can be detected that precede the rate-determining step (rds) of the reaction. The time dependent traces of the other 2Ph-X groups are given in the ESI† and are analogous. In an unpublished study using alkylamine versions of 2 rather than anilines, the kinetics is much simpler and shows isosbestic points. To analyze a complex scenario without isosbestic points, we turned to SVD methods,8–10,15,16 that afforded the spectra of each kinetically-significant species and rate constants for each step of the reaction.
1) H2O/MeOH mixture. As can be observed, there is a lack of isosbestic points, meaning that one or more intermediates are spectroscopically observable, and the reactions proceed at rates such that the individual steps are not separated cleanly with time during the reaction. Moreover, this means that reactions can be detected that precede the rate-determining step (rds) of the reaction. The time dependent traces of the other 2Ph-X groups are given in the ESI† and are analogous. In an unpublished study using alkylamine versions of 2 rather than anilines, the kinetics is much simpler and shows isosbestic points. To analyze a complex scenario without isosbestic points, we turned to SVD methods,8–10,15,16 that afforded the spectra of each kinetically-significant species and rate constants for each step of the reaction.
In fitting the data based on SVD, we included independent UV/vis spectra of known species to reduce the number of variables. In particular, we included the spectra of the anilines (An-X), DTT, and the postulated final product 3 (Scheme 1). The spectrum of the reactant is well defined by the data at time = 0, so it was not included as a known entity.
We thus only needed to independently generate 3, which was done through a preparative reaction between 1 and DTT in acetonitrile, followed by isolation and full characterization (see ESI Section III†). The UV/vis spectra of 3 showed a λmax at 290 nm, which was consistent with similar other geminal S- and O-vinylethers of Meldrum's acid we have previously reported.1,2 However, upon monitoring the spectra of 3 at 50 μM in the solvent system in which the reaction of 2Ph-H and DTT was performed in H2O/MeOH (2![[thin space (1/6-em)]](https://www.rsc.org/images/entities/char_2009.gif) :
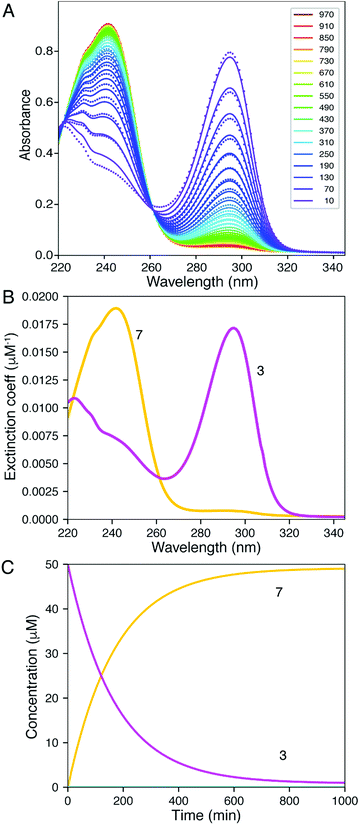
:![[thin space (1/6-em)]](https://www.rsc.org/images/entities/char_2009.gif) 1) pH 6.8, it was observed that spectral changes occurred (Fig. 3), with the λmax shifting from 295 nm to 240 nm over a period of approximately 20 minutes (Fig. 3A, and ESI Fig. S9†).
1) pH 6.8, it was observed that spectral changes occurred (Fig. 3), with the λmax shifting from 295 nm to 240 nm over a period of approximately 20 minutes (Fig. 3A, and ESI Fig. S9†).
The shifting to a lower wavelength is indicative of a lowering of the conjugation where the resulting spectrum was reminiscent of the spectrum of the conjugate base of Meldrum's acid. Thus, we postulated the generation of compound 7 (eqn (2), color coded to match Fig. 3). As a control, we analysed the UV/vis spectra of compound 5 (Scheme 1) under the same conditions, and there was no change with time (ESI Fig. S10†), confirming that the second thiol is involved in the creation of 7. The rate constant for conversion of 3 to 7 is well-defined, 0.006 min−1, but the rate of reaction of 7 to 3 is less well-defined, ∼0.0001 min−1, giving an equilibrium constant of 60 favouring 7.
 | (2) |
To verify that 7 was the species created, we postulated that the equilibrium between 3 and 7 should be pH dependent. Compound 7 was expected to dominate at higher pHs while 3 should dominate at lower pHs (eqn (2)). The pH dependence of this equilibrium should pivot around the pKa of Meldrums acid, i.e. near pHs 5–6. To confirm our hypothesis, we carried out the addition of sodium hydroxide and hydrogen chloride aqueous solutions (Fig. 4). We could switch between a dominance of the λmax at 240 nm (7) to 290 nm (3) depending upon the addition of base or acid, respectively. Importantly, we note that in our previous studies of the reactions of 1 or 2 with DTT we failed to recognize the formation of 7 because the product was always isolated from organic media, where it reverts to structure 3.
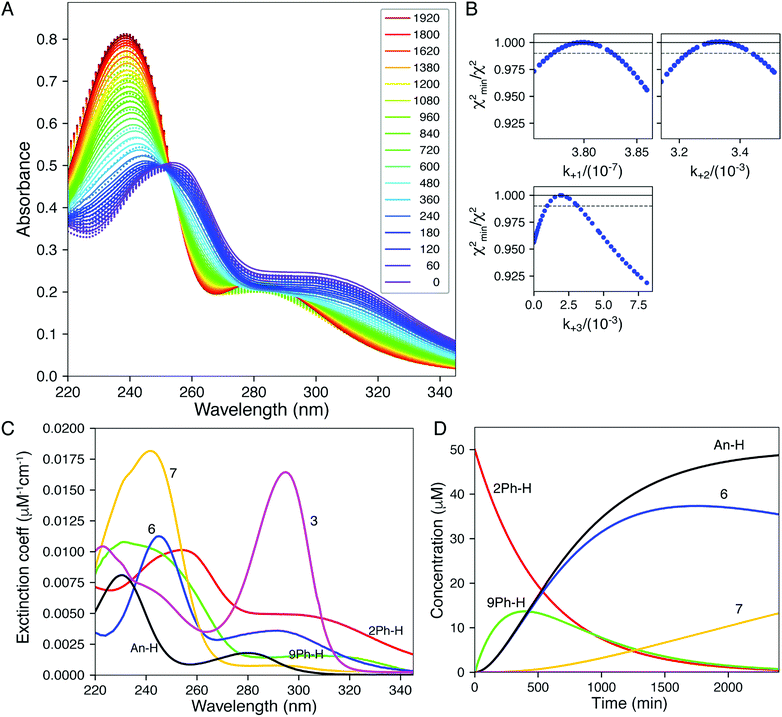 | ||
| Fig. 4 Global fitting of time-resolved spectra. Spectra were collected as a function of time after mixing 1, 2, 5, and 10 mM DTT with 2Ph-H (50 uM) and were fit globally. (A) Time-resolve spectra collected at 5 mM DTT. The dots show the data and the lines give the fitted curve. The inset shows the color-coded time for collection of each spectrum (min). (B) Confidence contour analysis; the dashed line shows the χ2 threshold (0.98) used to establish confidence intervals. (C) Spectra of individual species resolved by global data fitting. (D) Time dependence of individual species predicted by the global fitting. All data were fit globally to derive the rate constants listed in Table 2. Colours correspond to Scheme 2: 2Ph-H (red), 9Ph-H (green), 6 (blue), An-H (black), 7 (yellow) and 3 (magenta). | ||
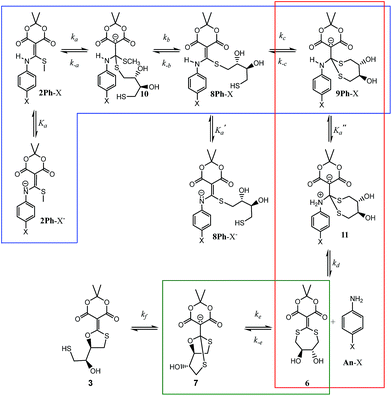
With the knowledge that the actual product was compound 7 wherein two thiols have undergone conjugate addition generating an anionic bicyclic system, we realized that other intermediates analogous to 7 could be present in the mechanism. Thus, a step-by-step picture (minus proton transfers) was generated in advance of kinetic modelling taking this possibility into account (Scheme 2). Further, with this scheme in mind, it seemed evident that the rds of such a process could be the loss of aniline (k2), or potentially the cyclization to 7 (k3). Thus, we expected to observe some of these compounds in the 1H-NMR spectra as they build up prior to the rds. In fact, potentially three structures in addition to the reactant 2Ph-X and products 3/7 would be observable: 8Ph-X, 9Ph-X, and intermediate 6. In actuality, that proved to be the case. When using 2Ph-NO2 (the slowest of the reactants), the 1H-NMR spectra revealed two unknown species, one of which contained aniline, but was not p-nitroaniline, nor the reactants/products (Fig. S10†). Both species build up with time and then decreased as the reaction approached completion. Based upon a kinetic analysis that is best fit with a rapid conversion of 8Ph-X to 9Ph-X (see below), we postulate these species to be 9Ph-X and 6.
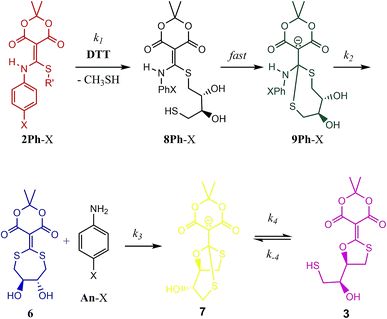 | ||
| Scheme 2 Mechanistic scenario that could be used to properly fit the UV/vis traces (Fig. 2) for the reaction of 2Ph-X and DTT. The structures are color-coded to correspond with their spectra and time course data in Fig. 4 (as well as ESI Fig. S12–S15†). | ||
To analyse the kinetics of the reactions of 2Ph-X's with DTT, we devised a series of mechanistic postulates. Several were tested, but the one that fit the data well is embodied in Scheme 2. In this mechanism, an initial second order reaction with DTT leads to a thiol conjugate addition, undoubtedly in a reversible fashion with CH3SH readdition, but upon loss of methyl mercaptan the reaction is driven in an irreversible direction due to a subsequent rapid first-order intramolecular thiol addition. Thus, we modelled the first conjugate addition and loss of CH3SH together in a single step, as well as the fast cyclization step, as sequential irreversible reactions. The resulting 9Ph-X was postulated to have a long enough lifetime to build up and be spectroscopically observable prior to the step that generates the aniline chromophore, as does 6 before converting to an equilibrium of 3 and 7, and hence the lack of isosbestic points in Fig. 2. After loss of aniline to generate 6, slow intramolecular cyclization occurs to set up the equilibrium between 3 and 7.
Thus, having obtained UV/vis spectra of aniline, as well as products 3 and 7, we set out to fit the spectral data of Fig. 2 in detail using 2Ph-H and including the data in Fig. 3A. In addition, assignment of chemical structures to various intermediates was made by comparisons to analogous isolable structures, as now described.
Here we have used SVD to deconvolute the spectra and time-dependence of species from analysis of time-resolved spectra using KinTek Explorer kinetic modelling software.17 The output of the SVD analysis is a set of vectors defining the amplitude versus time and spectra (absorbance versus wavelength). The product of the amplitude and spectra vectors reconstitutes the matrix to account for the observed data; SVD provides a mathematically sound solution, but one that lacks physical reality.10 We then fit the amplitude vectors based upon the chosen model to derive realistic time dependence of the reaction and spectra of each species.18
Our analysis first focused upon the complete declicking mechanism of 2Ph-X with X = H (i.e.2Ph-H) (50 μM) with DTT at concentrations of 1, 2, 5 and 10 mM. The mechanism was separated into steps analogous to those postulated in Scheme 2, which results in the possibility of several calculated rate constants to be modelled, for example k1, k2, k3, k4 and k−4 (species, spectra, time-courses are color-coded in Fig. 4 to correspond to the colours in Scheme 2). The addition of DTT is a second-order reaction (k1), followed by a cyclization to generate 9Ph-H. Upon attempting to model the kinetics including this cyclization step, a good fit with low residuals (such as that described below) could never be achieved, and the resulting calculated absorbance spectra did not make sense for the expected chromophore that 9Ph-H would show. Thus, we left this step out, meaning that the cyclization is rapid (referred to as fast in Scheme 2). In addition, k4 and k−4 represent the equilibrium between 3 and 7 which was modelled from the data of Fig. 3. These steps were also not necessary for the global fit, likely because this equilibration is past the rds of the mechanism and the equilibrium favours 7.
While the first step of Scheme 2 is undoubtedly an equilibrium, the loss of methyl mercaptan (a gas) from 2Ph-H and the rapid cyclization pushes the equilibria to 8Ph-H. In addition, as discussed in the previous paragraph, intramolecular conjugate addition of the dangling thiol to generate 9Ph-H is postulated to be fast, which is anticipated by the high nucleophilicity and effective molarity of the thiol, pushing this equilibrium to 9Ph-H. Thus, the step from 2Ph-H to 9Ph-H was modelled as a single step. Loss of aniline (An-H) was anticipated to be rate determining (k2). The time-course data reveals that the k1 and k2 steps do not occur as completely distinct steps as a function of time (Fig. 2) because isosbestic points are not observed in the spectra (i.e., no clean 1-to-1 stoichiometric interconversions without accompanying further reactions during the time course of the reaction). After loss of aniline, cyclization occurs to generate 7 (k3) which very slowly forms 3. This equilibrium between 3 and 7 was derived independently, as discussed above. However, although this equilibration is slow on the timescale of data collection, it was still included in fitting the time-resolved spectral data. The data on the conversion of 3 to 7 were included in the global data fitting because they provide their spectra.
The global data fitting revealed that a step past the departure of aniline was required to generate a model with low residuals and spectra that made sense for the various structures depicted in Scheme 2. Yet, this rate constant was not well defined. The best fit settled upon a k3 of 2.00 × 10⁻⁴ min−1, but with large errors. Although k3 was not well-defined, this step was required to achieve a good fit, as evaluated by minimal χ2 and reasonable output spectra. In fitting the data collected using various derivatives, the value of k3 = 2.00 × 10⁻⁴ min−1 was chosen as a maximum value sufficient to give an optimal fit for all experiments. We chose a maximum value, such that greater values improperly fit the data. Lower values had only small effects on χ2, but gave unrealistic spectra. Accordingly, we used the value of k3 = 2.00 × 10⁻⁴ min−1 for all the 2Ph-X species, because this step is common to all the derivatives. The value is smaller than, but similar to, the k2 rate constant (see Table 2) that involves the loss of aniline. Hence, the intermediate 6 is expected to build up, as will be discussed below. The fact that k2 and k3 were very close is part of why k3 was so difficult to define accurately. In summary, the entire kinetic profile of 2Ph-H was nicely fit with k1 and k2 values shown in Table 2.
| k 1 × 10⁻¹ (M−1 min−1) | k 2 × 10⁻³ (min−1) | k 3 × 10⁻⁴ (min−1) | |
|---|---|---|---|
| 2Ph-H | 3.8 ± 0.03 | 3.26 ± 0.01 | 2.00 ± 1.4 |
| 2Ph-OMe | 4.31 ± 0.02 | 3.14 ± 0.01 | [2.00] |
| 2Ph-OH | 4.52 ± 0.06 | 4.5 ± 0.1 | [2.00] |
| 2Ph-Br | 2.77 ± 0.03 | 1.98 ± 0.06 | [2.00] |
| 2Ph-NO2 | 1.94 ± 0.02 | 1.68 ± 0.02 | [2.00] |
The computer derived spectra in Fig. 4A make good chemical sense. For example, the spectra of 9Ph-H (green) and 7 (yellow) are very similar, both analogous to the conjugate base of Meldrum's acid. Further, the spectrum of 3 (magenta) nicely matches the anticipated spectra from Fig. 3. Importantly, the spectrum of 6 (blue) has the greatest difference from the other spectra. While the two maxima of 6 are of similar wavelength to the other species, the absorbance is most like that of compound 1.
The time course of the spectra given in Fig. 4C are also informative. Intermediate 9Ph-H builds up in the beginning (green trace) while intermediate 6 (blue) simultaneously builds with the same rate as the creation of An-H (cyan), just as predicted by the mechanism. Yet, the final products 3 and 7 gradually evolve with a decrease of 6 toward the end of the reaction and are not completely formed even after 2000 minutes (yellow trace). This shows that the rate-determining step for the overall transformation is some combination of k2 and k3, involving the creation of 6 and its first-order rearrangement to 3 and 7. In support, at long time scales (several hours), the 1H-NMR spectra (albeit at different concentrations, see ESI†) show peaks indicative of a highly symmetrical intermediate (i.e.6) that gradually fades to the product (Fig. S10†).
After having achieved a good fit for 2Ph-H, we turned to an analysis of the dependence of the rates upon DTT concentration for all 2Ph-X species. Spectra were collected as a function of time after mixing each 2Ph-X (50 μM) with DTT again at concentrations of 1, 2, 5 and 10 mM (ESI, Fig. S15–S19†). Absorbance spectra of DTT were subtracted from the data at each concentration. The corrected spectra were then subjected to SVD analysis using the KinTek software to derive spectra and amplitude vectors. The amplitude vectors derived at each concentration were then fit globally for all four DTT concentrations used to derive a single set of rate constants for each of the derivatives of 2Ph-X (Table 2), but using the k3 value found for 2Ph-H. The known spectrum of each substituted aniline (An) was included in deriving the best global fit. The spectrum of 2Ph-X was not included because it is well defined by the data at short time intervals. Because the slowest step of the reaction of 2Ph-H was found to be the conversion of 6 to the mixture of products (3 and 7), we simplified the SVD modelling for the other 2Ph-X derivatives to only a two-step mechanism with the set rate constant for step 3. The two rate constants for each derivative are shown in Table 2.
The rho (ρ) values of the Hammett plots are informative as to various aspects of the declick mechanism. The negative ρ (slope) values for k1 (−0.32) and k2 (−0.34) show that the transformations from 2Ph-X species to 9Ph-X species, and from 9Ph-X species to 6 + An-X have an overall decrease of negative charge (Fig. 5). In order to understand these Hammett plots, a detailed analysis of the individual reactions required in the composite steps reflected by the k1 and k2 rate constants is required. An expanded mechanism for DTT-induced declicking is shown in Scheme 3. The blue box indicates the reactions reflected by k1, the red box indicates the reactions involved in k2, and the green box covers the processes involved in k3. A key to the analysis is to realize that the pH used in the kinetics is above the pKa of each of the reactants (see Table 1, where Ka is used in the kinetic expression for eqn (3)). Thus, a significant portion of each 2Ph-X species is ionized at the start of the reaction (2Ph-X−). We can therefore assume that the equilibrium between 2Ph-X− and 2Ph-X commences the reaction with an extent of negative charge on the reactant.
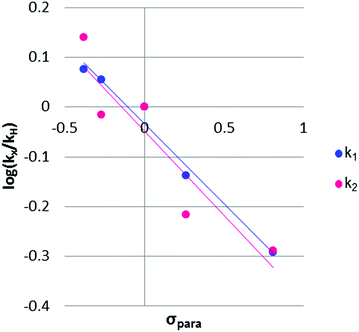 | ||
| Fig. 5 Hammett plots for the two individual rate constants for the 2Ph-X derivatives. Trendlines for k1 (y = −0.32x − 0.033) and k2 (y = −0.34x − 0.047) are shown. | ||
In order for nucleophilic addition of DTT to occur, each 2Ph-X species must be in a neutral form in order to be electrophilic. Hence, in the mechanism there is a negative charge decreasing on the nitrogen of the substituted aniline upon each 2Ph-X− species transforming to a 9Ph-X species. A kinetic expression for this step assuming that the expulsion of CH3SH is not reversible, and using the steady-state approximation (SSA) on 8Ph-X and 10 (Scheme 3), is given in eqn (3) (see ESI† for the derivation). Further, there is an equilibrium between 8Ph-X and 8Ph-X− . However, this is a side equilibrium not involved directly in the mechanism and thus is not relevant to the kinetics. While we fully realize that the SSA for 10 and 8Ph-X is not valid under these circumstances, the mathematical form of the rate law (eqn (3)) reveals the dependence of hydronium, i.e. the addition of a positive charge, thereby revealing the source of the negative rho value. For an alkyamine version of 2, a negative rho value is therefore not expected.
 | (3) |
The rate constant k2 embodies the reactions from 9Ph-X to 6 + An-X (red box). We postulate that a protonation of the aniline nitrogen (11) is required prior to its elimination. Thus, an acid equilibrium constant  is involved, along with an equivalent of hydronium. If we assume a rapidly established acid/base equilibrium with structure 11, we derive eqn (4). The necessary protonation of the aniline leaving group explains the negative rho value. Clearly k2 is dominated by the protonation state changes, as revealed by the negative rho-value. In fact, both k1 and k2 involve a protonation of the aniline, i.e. meaning that the rho values may be expected to be similar – but it is likely a coincidence they are so close. Albeit the protonation of the aniline may dominate the k1 and k2 Hammett rho values, clearly any of the other steps involved in these rate constants will also have an influence, sometimes counter to the influence of protonation on rho. Thus, this Hammett sensitivity parameter reflects several steps.
 | (4) |
Conclusion
A kinetic analysis of the reactions of structures 2Ph-X with DTT for the release of aniline and methyl mercaptan has been performed. The kinetics are complex due to a second order step prior to two first order steps of comparable rates, which together contribute to determine the net rate. This results in UV/vis time-course spectra lacking isosbestic points, thereby reflecting reactions that commence consecutively before the reaction is complete. Data were fit using numerical integration of the rate equations and based on SVD analysis, giving rate constants, spectra of intermediates, and time-course evolution of the intermediates and products that support a proposed mechanism for the “declick” reaction. The data and fitting are consistent with negative Hammett rho values, and a complex mechanism involving intramolecular cyclizations, a 7-membered ring structure 6 as an intermediate, and an equilibrium between a bicyclic and tricyclic equilibrium of the product structures 3 and 7. Importantly, the study highlights the power of a rigorous kinetic analysis to decipher complex chemical mechanisms.Conflicts of interest
Financial conflict of interest statement: KAJ is President of KinTek Corporation which markets the KinTek Explorer software used in this study.Acknowledgements
We gratefully acknowledge the support of the Welch Regents Chair (F-0046) to EVA, NSF CHE-1665037, The Center for Dynamics and Control of Materials supported by the NSF (DMR-1720595), and by The Welch Foundation grant F-1604 to KAJ.Notes and references
- K. L. Diehl, I. V. Kolesnichenko, S. A. Robotham, J. L. Bachman, Y. Zhong, J. S. Brodbelt and E. V. Anslyn, Nat. Chem., 2016, 8, 968 CrossRef CAS.
- X. Sun and E. V. Anslyn, Angew. Chem., Int. Ed., 2017, 56, 9522 CrossRef CAS PubMed.
- E. V. Anslyn and D. A. Dougherty, Modern Physical Organic Chemistry, University Science Books, 2006, pp. 355–487 Search PubMed.
- F. A. Carey and R. J. Sundberg, Advanced Organic Chemistry: Part A: Structure and Mechanisms, Springer Science & Business Media, 2007, pp. 253–388 Search PubMed.
- K. S. Anderson, J. A. Sikorski and K. A. Johnson, Biochemistry, 1988, 27, 7395 CrossRef CAS PubMed.
- K. S. Anderson and K. A. Johnson, Chem. Rev., 1990, 90, 1131 CrossRef CAS.
- K. A. Johnson, Z. B. Simpson and T. Blom, Anal. Biochem., 2009, 387, 20 CrossRef CAS PubMed.
- V. Klema and A. Laub, IEEE Trans. Autom. Control, 1980, 25, 164–176 CrossRef.
- E. R. Henry and J. Hofrichter, Methods Enzymol., 1992, 210, 129 CAS.
- R. W. Hendler and R. I. Shrager, J. Biochem. Biophys. Methods, 1994, 28, 1 CrossRef CAS PubMed.
- K. A. Johnson, Z. B. Simpson and T. Blom, Anal. Biochem., 2009, 387, 30 CrossRef CAS PubMed.
- L. De Lathauwer, B. De Moor and J. Vandewalle, SIAM J. Matrix Anal. Appl., 2000, 21, 1253 CrossRef.
- G. H. Golub and C. Reinsch, Numer. Math., 1970, 14, 403 CrossRef.
- I. M. Kolthoff and M. K. Chantooni, J. Am. Chem. Soc., 1971, 93, 3843 CrossRef CAS.
- O. Alter, P. O. Brown and D. Botstein, Proc. Natl. Acad. Sci. U. S. A., 2000, 97, 10101 CrossRef CAS PubMed.
- O. Troyanskaya, M. Cantor, G. Sherlock, P. Brown, T. Hastie, R. Tibshirani, D. Botstein and R. B. Altman, Bioinformatics, 2001, 17, 520 CrossRef CAS PubMed.
- The KinTek Explorer kinetic modelling software fits kinetic and equilibrium data by nonlinear regression based on numerical integration of rate equations derived from a model input by the user.7 For this study, the software was modified to enable the global fitting of time-resolved spectra collected at multiple concentrations of DTT to a single unifying model to define the pathway and rate constants of the DTT-induced declicking mechanism of 2Ph-X.
- E. Karnas, S. K. Kim, K. A. Johnson, J. L. Sessler, K. Ohkubo and S. Fukuzumi, J. Am. Chem. Soc., 2010, 132, 16617 CrossRef CAS PubMed.
Footnotes |
| † Electronic supplementary information (ESI) available: Characterization, spectra, kinetics, computer fits. See DOI: 10.1039/c9sc00690g |
| ‡ These authors contributed equally. |
| This journal is © The Royal Society of Chemistry 2019 |


