
 Open Access Article
 This Open Access Article is licensed under a Creative Commons Attribution-Non Commercial 3.0 Unported Licence
Hydroxyl-mediated ethanol selectivity of CO2 hydrogenation†
Chengsheng
Yang‡
,
Rentao
Mu‡
,
Guishuo
Wang
,
Jimin
Song
,
Hao
Tian
,
Zhi-Jian
Zhao
and
Jinlong
Gong
 *
*
Key Laboratory for Green Chemical Technology of Ministry of Education, School of Chemical Engineering and Technology, Tianjin University, Collaborative Innovation Center of Chemical Science and Engineering, Tianjin 300072, China. E-mail: jlgong@tju.edu.cn
First published on 11th February 2019
Abstract
Oxide-supported Rh nanoparticles have been widely used for CO2 hydrogenation, especially for ethanol synthesis. However, this reaction operates under high pressure, up to 8 MPa, and suffers from low CO2 conversion and alcohol selectivity. This paper describes the crucial role of hydroxyl groups bound on Rh-based catalysts supported on TiO2 nanorods (NRs). The RhFeLi/TiO2 NR catalyst shows superior reactivity (≈15% conversion) and ethanol selectivity (32%) for CO2 hydrogenation. The promoting effect can be attributed to the synergism of high Rh dispersion and high-density hydroxyl groups on TiO2 NRs. Hydroxyls are proven to stabilize formate species and protonate methanol, which is easily dissociated into *CHx, and then CO obtained from the reverse water–gas shift reaction (RWGS) is inserted into *CHx to form CH3CO*, followed by CH3CO* hydrogenation to ethanol.
Introduction
Carbon dioxide (CO2) is one of the major components of greenhouse gases, which can result in climate change and ocean acidification. Among the different approaches explored for controlling CO2 emission, the chemical conversion of CO2 to high-value-added fuels (oxygenates, alcohols, olefins etc.) has attracted extensive attention.1–4 Compared with C1 products (CO, CH4 and CH3OH), the higher alcohols (C2+OH, especially C2H5OH), which are mostly produced from biological fermentation, are widely applied in industries as indispensable higher-energy-density engine fuels and fuel additives.1 According to thermodynamic analysis, the formation of ethanol from CO2 is limited enormously at 1–30 bar due to the preferential production of CO or CH4, thus the selectivity to ethanol is relatively low.4Therefore, the production of C2+OH by CO2 hydrogenation is appealing but remains very challenging. Previous studies have shown that a Pt/Co3O4 catalyst5 achieved 27.3% selectivity to C2+OH with H2O/DMI as a solvent. Multi-functional composite catalysts, such as CoMoS6 (5.5% selectivity to ethanol), physically mixed Fe-based and Cu-based catalysts7 (17.4% selectivity to ethanol) and K/Cu–Zn–Fe catalysts8,9 (19.5% selectivity to C2+OH and CH3OH), were also used for alcohol synthesis. Particularly, Rh-based catalysts have been evaluated as promising catalysts for the selective synthesis of ethanol.4,10,11 In general, promoters such as Fe and Li are frequently used for enhancing ethanol selectivity via changing the electronic state of Rh and increasing the intensity of bridge-bonded CO species. For example, 5 wt% RhFe10 and RhLi11 supported on SiO2 showed ethanol selectivities of 16.4% and 15.5%, respectively.
However, there are still some limitations for alcohol production through CO2 hydrogenation reaction, such as the difficulties in CO2 activation, high energy barrier for C–O bond scission and the formation of C1 by-products.1 Therefore, the design of efficient heterogeneous catalysts for ethanol production is of great importance. Tuning the particle size of noble metals can often increase the CO2 conversion and product selectivity.12–16 For example, suitable reducible metal oxide supports, such as TiO2 and ZrO2, have been extensively applied to tune the particle size.17,18 The Au/TiO2 catalyst with abundant oxygen vacancies exhibited high selectivity to ethanol from CO2 reduction in DMF solvent.19 The bimetallic Pd2Cu/P25 catalyst also presented an excellent yield of ethanol with the help of water.20 On the other hand, a promotion strategy via hydroxyl groups has also been proved to be an efficient approach towards improving alcohol selectivity in CO hydrogenation.21–23
This work shows that a high yield of ethanol under low pressure can be achieved by the introduction of hydroxyls onto a TiO2 support. First, 1 wt% RhFeLi (Rh![[thin space (1/6-em)]](https://www.rsc.org/images/entities/char_2009.gif) :Fe:Li = 1:1:1) catalysts supported on a series of reducible oxides were prepared. The catalysts supported on TiO2 nanorods (NRs) display the highest selectivity to ethanol. Since TiO2 NRs have been extensively used in a variety of catalytic systems, such as photocatalytic water splitting, CO2 photoreduction and dissociation of CO2 to CO,24–26 we synthesized TiO2 NRs by a modified hydrothermal method. More importantly, high-density surface hydroxyls can be introduced into the catalytic system after reduction of TiO2 NR-supported catalysts in H2. A significant improvement of ethanol yield is observed for Rh-based catalysts supported on TiO2 NRs, which have not been reported in previous studies. Furthermore, the hydroxyl-mediated mechanism of ethanol formation over RhFeLi/TiO2 NRs catalysts is investigated.
:Fe:Li = 1:1:1) catalysts supported on a series of reducible oxides were prepared. The catalysts supported on TiO2 nanorods (NRs) display the highest selectivity to ethanol. Since TiO2 NRs have been extensively used in a variety of catalytic systems, such as photocatalytic water splitting, CO2 photoreduction and dissociation of CO2 to CO,24–26 we synthesized TiO2 NRs by a modified hydrothermal method. More importantly, high-density surface hydroxyls can be introduced into the catalytic system after reduction of TiO2 NR-supported catalysts in H2. A significant improvement of ethanol yield is observed for Rh-based catalysts supported on TiO2 NRs, which have not been reported in previous studies. Furthermore, the hydroxyl-mediated mechanism of ethanol formation over RhFeLi/TiO2 NRs catalysts is investigated.
Results and discussion
Catalyst structure
The morphology of the synthesized TiO2 NRs is shown in Fig. 1a and S1.† The length and diameter of TiO2 NRs are 50–200 nm and 10–20 nm, respectively. The specific surface area of TiO2 NRs is determined to be 23.6 m2 gcat−1, which is close to that of commercial TiO2 (TiO2 Com, 18.2 m2 gcat−1) (Table S1†). The Rh-based catalysts supported on TiO2 NRs and TiO2 Com were prepared by incipient wetness impregnation. The Rh nanoparticles on TiO2 NRs present uniform size distribution with an average diameter of 2.3 ± 1.0 nm (Fig. 1a, c and e). The high-resolution images of Rh nanoparticles shown in Fig. 1c and d present a lattice distance of 0.23 nm, corresponding to Rh (111) planes.27 In contrast, two-times-larger (∼4.0 nm) Rh nanoparticles in the range of 1–7 nm are observed on TiO2 Com (Fig. 1b, d and f). TEM studies indicate that TiO2 NRs can prevent the severe agglomeration of Rh nanoparticles after the reduction at 400 °C in a H2 atmosphere.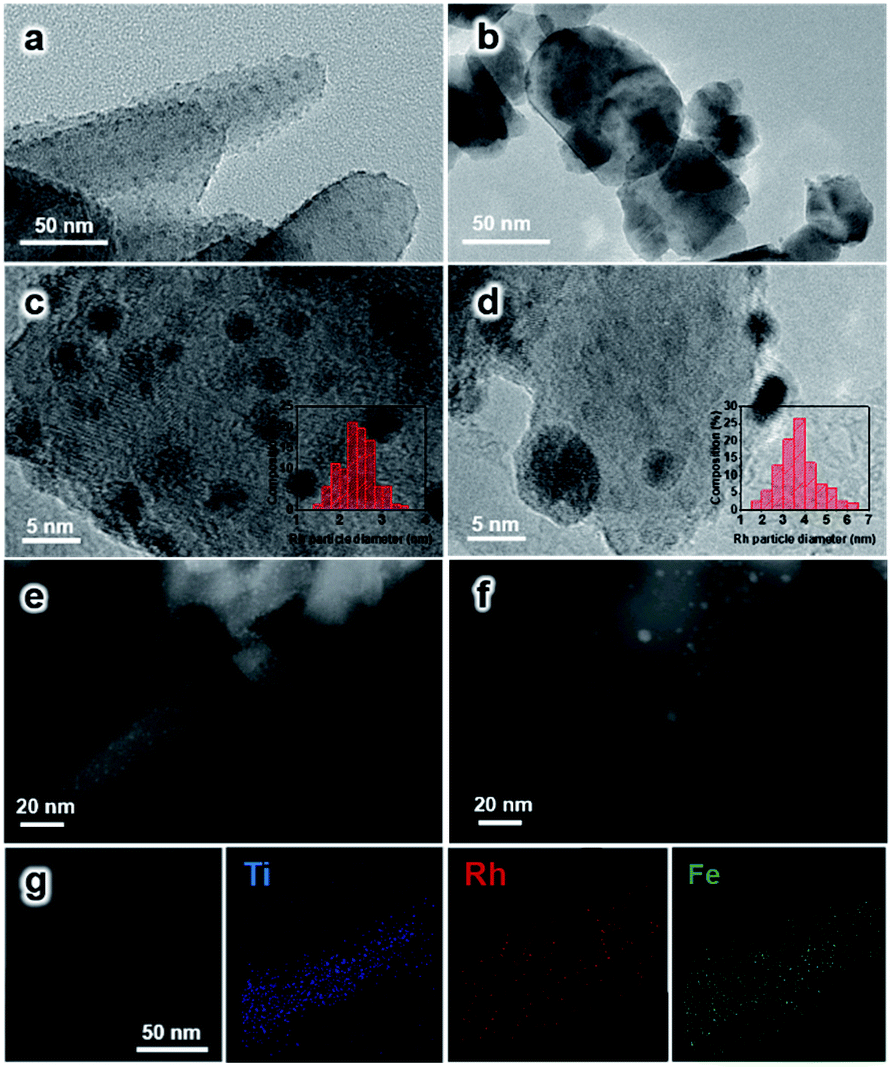 | ||
| Fig. 1 (a and b) TEM; (c and d) HRTEM images, particle size distributions (inset figures) and (e and f) HAADF-STEM images of catalysts after reaction. (a, c and e) 2.5 wt% RhFeLi supported on TiO2 NRs and (b, d and f) 2.5 wt% RhFeLi supported on TiO2 Com. (g) STEM-EDS elemental mapping of 2.5 wt% RhFeLi supported on TiO2 NRs. | ||
In XRD measurements, no characteristic peak of Fe2O3 can be found for RhFeLi/TiO2 Com and RhFeLi/TiO2 NRs when the loading of Fe is relatively low (∼1 wt%) (Fig. 2). When the loading of Fe is increased to 2.5 wt%, the diffraction peak of Fe2O3 at 33.2° can be seen for TiO2 Com. However, the diffraction peak of Fe2O3 does not appear for TiO2 NRs even though the loading of Fe is increased to 5 wt% (Fig. 2). XRD results indicate that the dispersion of FeOx over TiO2 NRs is higher than that over TiO2 Com. EDS elemental mapping of RhFeLi/TiO2 NRs also shows that the FeOx species are well dispersed on TiO2 NRs (Fig. 1g). We note that no Raman shift of TiO2 can be observed for all catalysts (Fig. S2†), indicating that the FeOx species are deposited on the surface rather than being doped into TiO2 bulk. The H2 temperature-programmed reduction (H2-TPR) results of FeOx/TiO2 show that the reduction temperature of FeOx over TiO2 NRs is 100 °C higher than the reduction temperature of FeOx over TiO2 Com (Fig. S3a†), suggesting that the FeOx species are better dispersed on TiO2 NRs compared with TiO2 Com.
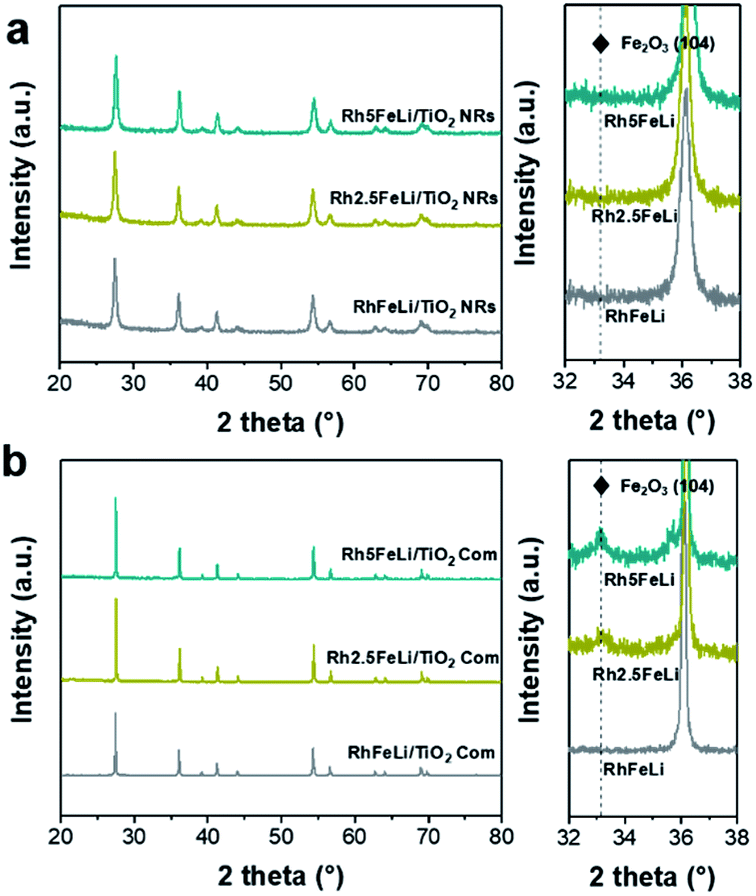 | ||
| Fig. 2 (a) XRD spectra of 2.5 wt% RhFeLi/TiO2 NRs with different Fe loadings. (b) XRD spectra of 2.5 wt% RhFeLi/TiO2 Com with different Fe loadings. The figures on the right of (a) and (b) show the enlarged XRD patterns. | ||
H2-TPR studies of RhFeLi/TiO2 NRs and RhFeLi/TiO2 Com were also carried out to investigate the interfacial interaction between Rh and oxide promoters (Fig. S3b†). According to previous studies,10 the peaks below 200 °C can be ascribed to the reduction of Rh2O3, while the broad peak appearing at higher temperature (300–500 °C) can be assigned to the reduction of Fe2O3. We find that the reduction temperature of Rh2O3 for RhFeLi/TiO2 NRs is 50 °C higher than that on RhFeLi/TiO2 Com, illustrating smaller Rh size on TiO2 NRs.14 As such, the higher dispersion of Rh-based nanoparticles on TiO2 NRs should increase the number of interfacial sites between Rh and oxide promoters, where C–C coupling occurs via reaction between CO and *CHx.5–7
To further illustrate the surface structure of RhFeLi/TiO2 NRs and RhFeLi/TiO2 Com catalysts, CO titration experiments were conducted. The active loop volume of CO for RhFeLi/TiO2 Com (0.09 cm3 g−1), which is consumed by CO adsorption on Rh, is much smaller than that for RhFeLi/TiO2 NRs (0.69 cm3 g−1) (Table S2†). The observed low adsorption amount of CO on RhFeLi/TiO2 Com may be due to the partial encapsulation of Rh sites by oxide overlayers. The TEM image also shows that the Rh nanoparticles are decorated by oxide overlayers in the RhFeLi/TiO2 Com catalyst (Fig. 1d). Quantitative XPS analysis was also conducted to investigate the surface structure of Rh-based catalysts (Table S3†). The surface molar ratio of Rh:Fe in RhFeLi/TiO2 NRs is determined to be 58:42, which is close to the bulk molar ratio of Rh:Fe measured by ICP-AES (48:52) and the initial feed ratio. For RhFeLi/TiO2 Com, XPS investigations show that the surface molar ratio of Rh:Fe is 29:71. However, the bulk molar ratio of Rh:Fe determined by ICP-AES (Rh:Fe = 50:50) still agrees with the initial feed ratio, suggesting that the Rh nanoparticles should be partially covered by the FeOx species. Note that the binding energy (BE) of Rh 3d5/2 locates at ∼307.0 eV (Fig. S4b†), corresponding to the metallic state of Rh.28
Catalytic performance
The catalytic performance of Rh-based catalysts supported on different oxide supports in CO2 hydrogenation is studied. The TiO2 NR-supported catalysts present the highest ethanol yield (Fig. S5†). Additionally, a series of Rh-based catalysts with different promoters were synthesized. Compared with the mono-component Rh/TiO2 catalyst, the selectivity of RhFe/TiO2 for ethanol is improved significantly (16% for RhFe/TiO2 Com and 25% for RhFe/TiO2 NRs, Fig. S6†). With an increase of the loading of Fe, CO2 conversion and the selectivity to ethanol and CH4 decreased while the selectivity to CO increased (Fig. S7†). Since FeOx could catalyze the reverse water–gas shift reaction (RWGS) to produce CO, the changes of CO2 conversion and product distribution indicate that the excess Fe species has a passive effect on CO2 conversion and ethanol synthesis by blocking the active Rh sites.10 This blocking effect may be caused by the encapsulation of Rh sites by FeOx species, which has been proven by XPS measurements combined with CO chemisorption (Table S2†). On the other hand, the addition of Li can increase the CO2 conversion on Rh/TiO2 by 5%, while the selectivity to ethanol does not change (Fig. S6c†). Based on these results, we conclude that the addition of Fe can promote the ethanol selectivity, while the addition of Li as an electronic promoter accelerates the CO2 conversion. As such, higher ethanol selectivity and CO2 conversion are obtained by adding binary promoters i.e., Fe and Li (Fig. S6d†).More interestingly, we show that the ethanol selectivity and CO2 conversion over RhFeLi/TiO2 NRs are much higher than those over RhFeLi/TiO2 Com at 250 °C (Fig. S7†). For example, the 2.5 wt% RhFeLi/TiO2 NR (Rh:Fe:Li = 1:1:1) catalyst presents more than 30% ethanol selectivity and 15% CO2 conversion, which is about seven-fold higher ethanol yield than that on 2.5 wt% RhFeLi/TiO2 Com (Fig. 3). The catalytic performance of RhFeLi/TiO2 NRs remains stable in a 20 h stability test (Fig. S7†). The superior reactivity and long-term stability of RhFeLi/TiO2 NRs catalysts provide an inspiration for their potential industrial application.
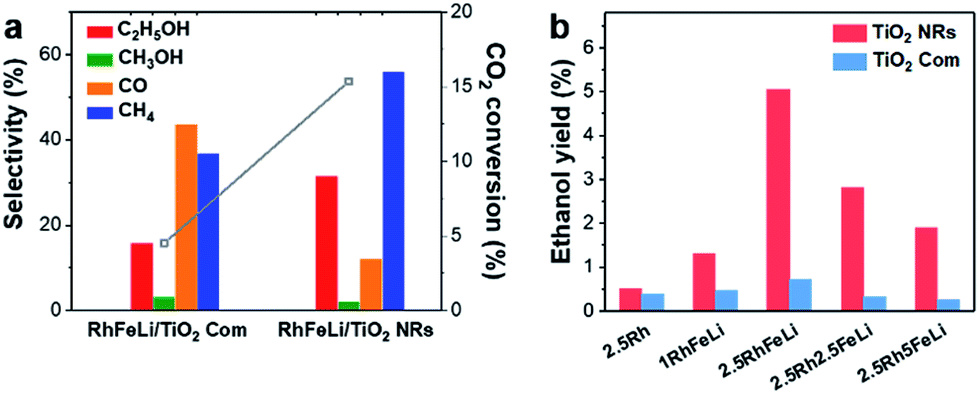 | ||
| Fig. 3 (a) The CO2 conversion (grey) and product selectivity of 2.5 wt% RhFeLi/TiO2 NRs and 2.5 wt% RhFeLi/TiO2 Com. (b) The ethanol yield of the Rh-based catalyst supported on TiO2 NRs and TiO2 Com. | ||
Promotion effects of the hydroxyl groups
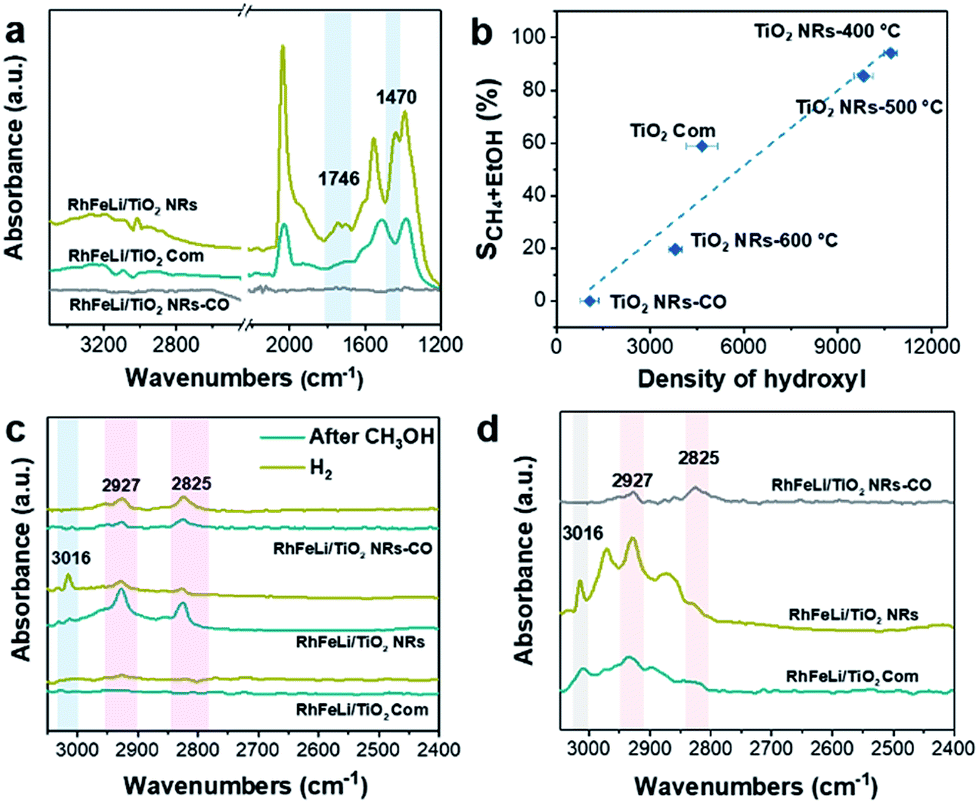
First, the hydroxyl groups were introduced by pre-reduction of RhFeLi/TiO2 NRs and RhFeLi/TiO2 Com catalysts in a H2 atmosphere at 400 °C. Fourier transform infrared (FTIR) experiments were carried out to characterize the surface hydroxyl groups on RhFeLi/TiO2 catalysts. As shown in Fig. S8,† the broad band at 3450 cm−1 and the sharp peak at 1640 cm−1 are assigned to the stretching and bending vibrations of associated hydroxyls, respectively.29 The density of hydroxyl groups on RhFeLi/TiO2 NRs is much higher than that on RhFeLi/TiO2 Com (Fig. 4a), suggesting that high-density hydroxyl groups could be introduced into the catalytic system by using TiO2 NRs. Subsequently, the catalytic properties of the hydroxyls on TiO2 NRs are characterized by CO temperature-programmed desorption (CO-TPD). A sharp signal peak of CO2 (m/z = 44) at ∼0 °C is observed in CO-TPD profiles for both RhFeLi/TiO2 NRs and pure TiO2 NRs (Fig. 4b and S8a†). As reported previously, the CO2 may originate from the water–gas shift process, in which the CO adsorbed on Rh sites reacts with hydroxyl groups.29,30 However, a small CO2 peak at ∼0 °C is observed for RhFeLi/TiO2 Com and pure TiO2 Com due to the lack of hydroxyls (Fig. 4c and S8a†). | ||
| Fig. 4 (a) The peak area of hydroxyls in FTIR normalized by SBET (×103) on 2.5 wt% RhFeLi/TiO2 NRs, 2.5 wt% RhFeLi/TiO2 Com and 2.5 wt% RhFeLi/TiO2 NRs-CO. (b) CO-TPD profiles of 2.5 wt% RhFeLi/TiO2 NRs. Pretreatment: H2 reduction at 400 °C. (c) CO-TPD profiles of 2.5 wt% RhFeLi/TiO2 Com. Pretreatment: H2 reduction at 400 °C. (d) CO-TPD profiles of 2.5 wt% RhFeLi/TiO2 NRs. Pretreatment: CO reduction at 350 °C. | ||
The TOF of ethanol formed over RhFeLi/TiO2 NRs is determined to be 0.12 h−1, which is much higher than that over RhFeLi/TiO2 Com or RhFeLi/SiO2 (0.08 h−1) (Table S2†). Therefore, we suggest that the surface hydroxyl groups may play an important role in ethanol formation via CO2 hydrogenation. To verify the role of hydroxyls in ethanol formation, the RhFeLi/TiO2 NR catalyst was pre-treated in a CO atmosphere (RhFeLi/TiO2 NRs-CO). The removal process of hydroxyl groups in CO was monitored by in situ diffuse reflectance infrared Fourier transform spectroscopy (DRIFTS, Fig. S9a†).31 We find that the IR peak of hydroxyl stretching vibrations (3450 cm−1) disappears gradually in CO at 350 °C. The hydroxyls can be removed completely after ∼12 minutes of CO-feeding (Fig. S9b†). After the pre-treatment in CO flow at 350 °C, the CO2 peak at ∼0 °C isn't observed in the CO-TPD profile (Fig. 4d), and RhFeLi/TiO2 NR-CO catalysts with a hydroxyl-deficient surface are prepared (Fig. 4a and S8b†). Compared with RhFeLi/TiO2 NRs reduced with H2, the RhFeLi/TiO2 NRs-CO catalyst exhibits much lower CO2 conversion (4.7%) and produces almost no ethanol (Fig. 5a). The selectivity to CO reaches ∼80% among the products and the selectivity to CH4 decreases from 53.9% to 9.6%. In the TEM images (Fig. S10†), RhFeLi/TiO2 NRs and RhFeLi/TiO2 NR-CO catalysts show similar size distribution. Besides, there is no BE shift of the XPS Rh 3d peak for RhFeLi/TiO2 NR-CO compared with RhFeLi/TiO2 NRs (Fig. S11, Table S4†). Therefore, the influences of the size effect and chemical state of Rh can be excluded. Instead, the decrease of the selectivity to CH4 and ethanol should be attributed to the lack of hydroxyls. When hydroxyl groups are re-introduced by H2 exposure (Fig. 5b and S8b†), promoted catalytic performance is achieved (35% ethanol selectivity and 18% CO2 conversion), which is very similar to that of fresh RhFeLi/TiO2 NRs reduced with H2. These results further indicate that hydroxyls play an important role in tuning product distribution and promoting ethanol synthesis through CO2 hydrogenation.
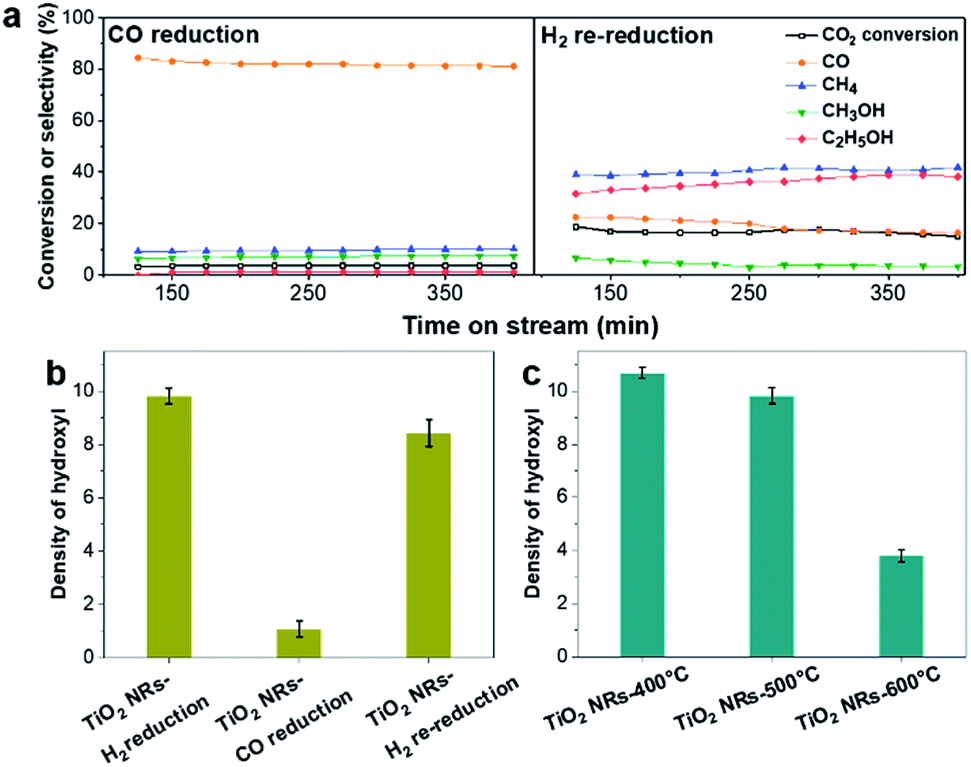 | ||
| Fig. 5 (a) CO2 conversion and product selectivity versus time obtained from 2.5 wt% RhFeLi/TiO2 NRs. CO reduction was conducted at 350 °C for 0.5 h. Re-reduction in H2 was carried out at 400 °C for 1 h. Reaction conditions: P = 30 atm, T = 250 °C, GHSV = 6000 h−1, CO2/H2 = 1/3. (b) The peak area of hydroxyls in FTIR normalized by SBET (×103) on 2.5 wt% RhFeLi/TiO2 NRs pretreated under different reduction atmospheres. (c) The peak area of hydroxyls in FTIR normalized by SBET (×103) on 2.5 wt% RhFeLi/TiO2 NRs calcined at different temperatures. | ||
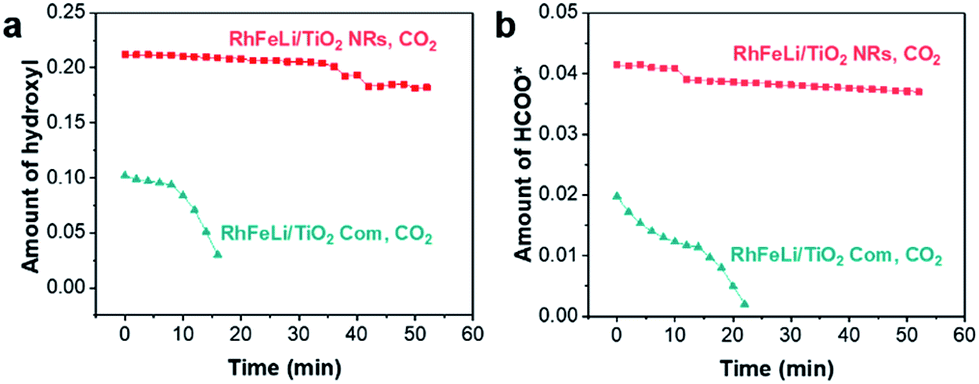
In sequential experiments, a mixture of CO2 and H2 (CO2:H2 = 1:3) is first introduced into an in situ cell at 250 °C, followed by a switch to pure CO2 flow to investigate the stability of hydroxyls and formate species. In a CO2 + H2 atmosphere (CO2:H2 = 1:3) at 250 °C, the bands at 3016, 2965 and 2880 cm−1 in the νC–H region appear to be stemming from gaseous CH4 (3016 cm−1) and adsorbed formate species, respectively. In the O–C–O stretching region between 1650 and 1200 cm−1, the bands at 1520 and 1390 cm−1 are assigned to carbonate, while the rest of the peaks may stem from adsorbed formate (1595 and 1370 cm−1, Table S5†).32–34 The absorbance intensities of the dissociated hydroxyl stretching vibrations at 3600 cm−1 and OCO asymmetric stretching vibration at 1595 cm−1 in DRIFTS are used to represent the amount of hydroxyls and formate, respectively.34 As shown in Fig. 6, the changes of the hydroxyl amount and the formate amount are plotted as a function of time when switching the CO2 + H2 flow to pure CO2 flow at 250 °C. We find that the amounts of hydroxyls and formate species on RhFeLi/TiO2 NRs remain almost unchanged under pure CO2 flow for 40 min (Fig. 6, S12a and c†). In contrast, the hydroxyls and formate adsorbed on RhFeLi/TiO2 Com disappear rapidly within 20 min (Fig. 6, S12b and d†). We suggest that the abundant hydroxyl groups on RhFeLi/TiO2 NRs can stabilize the formate species, which has been proposed to be one of the intermediates of methanation via formate hydrogenation and then scission of C–O in *CHx–O.18,35
 | ||
| Fig. 6 (a) The absorbance intensity of hydroxyls at 3600 cm−1 in DRIFTS of 2.5 wt% RhFeLi/TiO2 NRs and 2.5 wt% RhFeLi/TiO2 Com versus time after switching the CO2 + H2 + Ar (CO2:H2 = 1:3) flow to pure CO2 flow at 250 °C. (b) The absorbance intensity of formate at 1595 cm−1 in DRIFTS of 2.5 wt% RhFeLi/TiO2 NRs and 2.5 wt% RhFeLi/TiO2 Com versus time after switching the CO2 + H2 + Ar (CO2:H2 = 1:3) flow to pure CO2 flow at 250 °C. | ||
In situ DRIFTS was further carried out to investigate the catalytic role of hydroxyls in ethanol formation. In contrast to RhFeLi/TiO2 Com, additional bands at 1470 cm−1 and 1746 cm−1 are observed for RhFeLi/TiO2 NRs under a CO2 + H2 atmosphere (CO2:H2 = 1:3) at 250 °C (Fig. 7a). The existence of the band at 1746 cm−1 has been reported for Rh/Al2O3 (ref. 35) and Ru/Al2O3 (ref. 36) catalysts, which can be attributed to adsorbed formyl (CHO*) species. It is believed that the formation of CHO* is the rate-limiting step of ethanol synthesis (Scheme S1†).12 Also, CHO* is thermodynamically more favored to be dissociated into *CHx than into CO.21–23,37 As expected, significant amounts of *CH3 species (1470 cm−1) are observed on the surface of RhFeLi/TiO2 NRs (Fig. 7a).17,18 Subsequently, CO can be inserted into these abundant adsorbed *CH3 species on RhFeLi/TiO2 NRs, which may be responsible for the high ethanol yield.38 Based on the above analysis, a mechanism that hydroxyls stabilize the formate and accelerate the scission of CHx–O to produce *CH3 species is proposed (Scheme 1).
 | ||
| Fig. 7 (a) In situ DRIFTS of 2.5 wt% RhFeLi/TiO2 NRs, 2.5 wt% RhFeLi/TiO2 Com and 2.5 wt% RhFeLi/TiO2 NRs-CO under a CO2 + H2 + Ar (CO2:H2 = 1:3) atmosphere at 250 °C. (b) The summed selectivity to CH4 and ethanol as a function of the peak area of hydroxyls normalized by SBET of the samples obtained from 2.5 wt% RhFeLi supported on different TiO2 supports. (c) In situ DRIFTS of 2.5 wt% RhFeLi/TiO2 NRs, 2.5 wt% RhFeLi/TiO2 Com and 2.5 wt% RhFeLi/TiO2 NRs-CO after CH3OH + Ar adsorption followed by H2 adsorption at 250 °C. (d) In situ DRIFTS of 2.5 wt% RhFeLi/TiO2 NRs, 2.5 wt% RhFeLi/TiO2 Com and 2.5 wt% RhFeLi/TiO2 NRs-CO under a CO + H2 + Ar (CO:H2 = 1:2) atmosphere at 250 °C. | ||
 | ||
| Scheme 1 Schematic of CO2 hydrogenation over the Rh-based catalyst with or without hydroxyl groups on TiO2. The hydroxyls play an important role in accelerating the scission of CHx–O* and promote the formation of ethanol. | ||
With increasing the calcination temperature from 400 to 600 °C, the normalized peak area of associated hydroxyl vibration bands for RhFeLi/TiO2 NRs decreases gradually, indicating that the density of hydroxyls is decreased (Fig. 5c and S8c†). In addition, the summed selectivity and TOF of CH4 and ethanol show a downward trend with increasing the calcination temperature of TiO2 NRs (Tables S2 and S6†). Since the RhFeLi nanoparticles show a similar size distribution (Fig. S10†) and the same electronic state of Rh and Fe as that for TiO2 NRs calcined at various temperatures (Fig. S11, Table S4†), the differences in catalytic performance should be attributed to the changes of surface hydroxyls. It is noteworthy that the catalytic performance of RhFeLi/TiO2 NRs-600 °C is comparable to that of the RhFeLi/TiO2 NRs-CO catalyst, because there are few hydroxyls on their surfaces. Similarly, changing the support from TiO2 NRs to TiO2 Com can also generate a hydroxyl-deficient surface, causing the selectivity for ethanol and CH4 to be reduced largely (Table S6†). To display the relationship between hydroxyl groups and catalytic performance directly, we take the summed amount of CH4 and ethanol as the total amount of *CH3, because these two products stem from *CH3 hydrogenation and CO insertion, respectively.39 As shown in Fig. 7b, the amount of *CH3 exhibits a linear correlation with the density of hydroxyls, illustrating that hydroxyls may accelerate the scission of the C–O bond to form the *CH3 species.
The reactions of CH3OH and H2 over RhFeLi/TiO2 were conducted as well to elucidate the role of hydroxyls. The DRIFTS data were obtained after pre-treatment with CH3OH and subsequent feeding with H2 at 250 °C (Fig. 7c). Upon the feeding of CH3OH, all the samples show similar CH3O* (2825 and 2927 cm−1) species.40–42 After the feeding of H2, the IR peak intensity of CH3O* in RhFeLi/TiO2 NRs decreases. Simultaneously, an obvious IR peak of gaseous CH4 (3016 cm−1) can be observed for RhFeLi/TiO2 NRs. The formation of CH4 could be attributed to the C–O bond scission in CH3O* followed by *CH3 hydrogenation. The hydroxyl groups on RhFeLi/TiO2 NRs are suggested to promote the C–O bond scission in CH3O* to produce the *CH3 intermediate. In contrast, the IR peak intensity of CH3O* does not decrease, and CH4 is hardly found for RhFeLi/TiO2 Com and RhFeLi/TiO2 NRs-CO after H2 feeding. Therefore, it is reasonable to infer that the hydroxyls on RhFeLi/TiO2 NRs could protonate CH3O*, i.e., promoting C–O bond scission in CH3O* to form *CH3. A similar phenomenon is observed under CO and H2 at 250 °C (Fig. 7d). A sharp CH4 peak emerges for RhFeLi/TiO2 NRs, which is accompanied by formate (2880 and 2965 cm−1) and CH3O* (2825 and 2927 cm−1). In contrast, we find only CH3O* species adsorbed on RhFeLi/TiO2 NRs-CO. The IR peaks of gaseous CH4 and formate are undetectable for RhFeLi/TiO2 NRs-CO and RhFeLi/TiO2 Com, which could be attributed to the removal of hydroxyls after CO treatment.
Previous studies have proposed that ethanol can be synthesized by CO insertion into *CH3 species to form CH3CO*, followed by CH3CO* hydrogenation.37,38 To verify this route of ethanol formation, the DRIFTS data of RhFeLi/TiO2 NRs and RhFeLi/TiO2 NRs-CO were obtained after pre-treatment with CH3OH and subsequent feeding with CO + H2 (CO:H2 = 1:1) at 250 °C (Fig. S13a†). Both gaseous and liquid products were analyzed in the reaction of CH3OH + CO + H2 at 250 °C (Fig. S13b†), and ethanol is the only C2+ product. Hence, the appearance of the methylene peak (2858 cm−1) for RhFeLi/TiO2 NRs indicates the C–C coupling and formation of ethanol.43 However, methylene, i.e., ethanol is not formed over RhFeLi/TiO2 NRs-CO. According to these data, the high ethanol selectivity of RhFeLi/TiO2 NRs might be attributed to the high-density hydroxyls, which enhance the C–O bond scission to produce *CHx intermediates for the CO insertion.
Surface functionalization with hydroxyls is frequently applied to promote the catalytic performance of catalysts.44–47 The role of surface hydroxyls has often been considered to modulate the local concentration of hydrophilic reactants, such as alcohols, around the active sites. For example, the hydrophobic treatment of Pd/MOF improves its catalytic activity for styrene hydrogenation by increasing the interaction between hydrophobic reactants and Pd sites.48 In formaldehyde oxidation reaction, the abundant hydroxyl groups nearby the Pt active sites can also facilitate formate oxidation through the formation of the Pt/Ni(OH)x interface.49 In CO2 hydrogenation reaction, hydroxyl groups on hydrophilic SiC quantum dots can promote methanol formation via a H-transfer mechanism, in which the diffusion of H from hydroxyl groups to CO2 assists the formation of the intermediate HCOO*.50 Here, our work clearly demonstrates the catalytic role of hydroxyl groups in ethanol synthesis via CO2 hydrogenation. We show that the surface hydroxyl species on RhFeLi/TiO2 NRs can protonate methanol and reduce the energy barrier for C–O bond scission, facilitating the generation of *CH3 species. Accordingly, CO obtained from RWGS can be inserted into abundant *CH3 species to form CH3CO*, followed by CH3CO* hydrogenation to ethanol.
Conclusions
In conclusion, we have demonstrated the crucial role of surface hydroxyls on the RhFeLi/TiO2 NR catalyst in the synthesis of ethanol from CO2 hydrogenation. Based on in situ spectroscopic characterization, we propose two advantages of the TiO2 NR support for CO2 hydrogenation to ethanol: (i) Rh-based nanoparticles are highly dispersed on TiO2 NRs due to the strong interaction between the catalyst and TiO2 NR support, thus displaying high activity; (ii) abundant hydroxyls on TiO2 NRs can protonate methanol, which is easily dissociated into *CHx, thus favoring the formation of ethanol upon CO insertion. This work not only provides the detailed understanding of the catalytic role of hydroxyls in heterogeneous catalysis but also opens an avenue for developing efficient catalysts for CO2 conversion.Experimental section
Chemicals
TiO2 NRs were prepared by hydrothermal treatment of a mixture of titanium tetrachloride, nitric acid and water.51,52 Briefly, titanium tetrachloride (TiCl4, Shanghai Chemical Reagent Co., 98%) was dissolved in ultrapure water in an ice-water bath to obtain a 3 M TiCl4 solution. Subsequently, 35 mL aliquot of concentrated nitric acid (HNO3, 15 M) was refluxed in a silicone oil bath and heated to 200 °C gradually, and then 20 mL of the 3 M titanium tetrachloride solution was rapidly injected into nitric acid under vigorous stirring. After aging for 20 h, the autoclave was cooled to room temperature. The obtained precipitates were centrifuged and washed several times with deionized water and ethanol. The filtered solid was dried at 100 °C in a vacuum overnight and calcined at 300, 400, 500 and 600 °C for 4 h, respectively (denoted as TiO2 NRs-x °C). Unless otherwise specified, TiO2 NRs are denoted as TiO2 NRs-500 °C. The commercial TiO2 (TiO2 Com) was purchased from Alfa Aesar Chemical Co. Ltd for comparison.RhCl3·nH2O (Huaweiruike Chemical Co., 99%), LiNO3 (Alfa Aesar Chemical Co. Ltd., 98%) and Fe(NO3)3·9H2O (Alfa Aesar Chemical Co. Ltd., 98%) were used as precursors and a series of reducible metal oxides (MO) were used as the support. MO (1 g) were impregnated with distilled water (1 mL) containing the precursor by using ultrasonication for 1 h. Generally, the molar ratio of Rh and promoters was 1:1 unless specified. Subsequently, the sample was dried at room temperature overnight and then at 80 °C for 10 h. Finally, the sample was calcined in air at 300–500 °C for 4 h and reduced in pure H2 at 400 °C for 2 h. The element loading was based on the weight ratio of Rh and Fe with respect to MO supports.
Hydrogenation of CO2
All the catalytic reactions were carried out in a fixed-bed micro-reactor. In a typical experiment, 300 mg of each catalyst with a 20–40 mesh size distribution was mixed with 2.0 g of quartz particles (SiC: granulation of 0.075–0.4 mm) to avoid hot spots and pressure drop across the bed and packed in a stainless steel (ϕ 8 × 400 mm) tubular reactor. Prior to each experiment, the catalyst was activated by reduction in a H2 atmosphere (99.99%) with a flow rate of 30 mL min−1 and a temperature of 400 °C for 1 h. The RhFeLi/TiO2 NRs-CO sample was obtained from RhFeLi/TiO2 NRs-500 °C reduced under CO flow at 350 °C for 0.5 h. After the reduction of the catalyst, the reactor was cooled down to reaction temperature. Then the reactant gases (CO2 and H2 with a molar ratio of 1:3, 30 bar) were introduced into the reactor. The gas hourly space velocity (GHSV) was set at 6000 h−1. The product gas was analyzed with an online gas chromatograph (GC, Agilent 7890B) equipped with two detectors. One is a flame ionization detector (FID) with a HP-FFAP column using H2 as a carrier gas to analyze the organic species such as alcohols, oxygenates and hydrocarbons. The other one is a thermal conductivity detector (TCD) with columns of MS-5A and Hayesep Q using He as a carrier gas to monitor the non-condensable gas species including H2, CO2, N2, CO and CH4. All the flows between the reactor and the GC were heated and maintained beyond 150 °C, to avoid the liquefaction of the alcohol products.
Conflicts of interest
There are no conflicts to declare.Acknowledgements
This work was financially supported by the National Key R&D Program of China (2016YFB0600901), the National Natural Science Foundation of China (21525626, 21603159, 21676181), and the Program of Introducing Talents of Discipline to Universities (B06006).References
- M. Aresta, A. Dibenedetto and A. Angelini, Chem. Rev., 2014, 114, 1709–1742 CrossRef CAS PubMed.
- W. Wang, S. Wang, X. Ma and J. Gong, Chem. Soc. Rev., 2011, 40, 3703–3727 RSC.
- H. Yang, C. Zhang, P. Gao, H. Wang, X. Li, L. Zhong, W. Wei and Y. Sun, Catal. Sci. Technol., 2017, 7, 4580–4598 RSC.
- A. Swapnesh, V. C. Srivastava and I. D. Mall, Chem. Eng. Technol., 2014, 37, 1765–1777 CrossRef CAS.
- Z. He, Q. Qian, J. Ma, Q. Meng, H. J. Zhou, H. J. Song, Z. Liu and B. Han, Angew. Chem., Int. Ed., 2016, 128, 747–751 CrossRef.
- D. L. S. Nieskens, D. Ferrari, Y. Liu and R. Kolonko, Catal. Commun., 2011, 14, 111–113 CrossRef CAS.
- T. Inui, T. Yamamoto, M. Inoue, H. Hara, T. Takeguchi and J. B. Kim, Appl. Catal., A, 1999, 186, 395–406 CrossRef CAS.
- M. Takagawa, A. Okamoto, H. Fujimura, Y. Izawa and H. Arakawa, Stud. Surf. Sci. Catal., 1998, 114, 525–528 CrossRef CAS.
- S. Li, H. Guo, C. Luo, H. Zhang, L. Xiong, X. Chen and L. Ma, Catal. Lett., 2013, 143, 345–355 CrossRef CAS.
- H. Kusama, K. Okabe, K. Sayama and H. Arakawa, Energy, 1997, 22, 343–348 CrossRef CAS.
- H. Kusama, K. Okabe, K. Sayama and H. Arakawa, Catal. Today, 1996, 28, 261–266 CrossRef CAS.
- Y. Choi and P. Liu, J. Am. Chem. Soc., 2009, 131, 13054–13061 CrossRef CAS PubMed.
- N. Yang, A. J. Medford, X. Liu, F. Studt, T. Bligaard, S. F. Bent and J. K. Norskov, J. Am. Chem. Soc., 2016, 138, 3705–3714 CrossRef CAS PubMed.
- Y. Wang, H. Luo, D. Liang and X. Bao, J. Catal., 2000, 196, 46–55 CrossRef CAS.
- R. G. Zhang, M. Peng and B. J. Wang, Catal. Sci. Technol., 2017, 7, 1073–1085 RSC.
- J. C. Matsubu, V. N. Yang and P. Christopher, J. Am. Chem. Soc., 2015, 137, 3076–3084 CrossRef CAS PubMed.
- S. Kattel, W. Yu, X. Yang, B. Yan, Y. Huang, W. Wan, P. Liu and J. G. Chen, Angew. Chem., Int. Ed., 2016, 55, 7968–7973 CrossRef CAS PubMed.
- S. Kattel, P. Liu and J. G. Chen, J. Am. Chem. Soc., 2017, 139, 9739–9754 CrossRef CAS PubMed.
- D. Wang, Q. Bi, G. Yin, W. Zhao, F. Huang, X. Xie and M. Jiang, Chem. Commun., 2016, 52, 14226–14229 RSC.
- S. Bai, Q. Shao, P. Wang, Q. Dai, X. Wang and X. Huang, J. Am. Chem. Soc., 2017, 139, 6827–6830 CrossRef CAS PubMed.
- R. Burch and M. J. Hayes, J. Catal., 1997, 165, 249–261 CrossRef CAS.
- J. Xu, X. Su, H. Duan, B. Hou, Q. Lin, X. Liu, X. Pan, G. Pei, H. Geng, Y. Huang and T. Zhang, J. Catal., 2016, 333, 227–237 CrossRef CAS.
- R. Zhang, B. Wang, H. Liu and L. Ling, J. Phys. Chem. C, 2011, 115, 19811–19818 CrossRef CAS.
- J. Lee, D. C. Sorescu and X. Y. Deng, J. Am. Chem. Soc., 2011, 133, 10066–10069 CrossRef CAS PubMed.
- L. Liu, C. Zhao and Y. J. Li, J. Phys. Chem. C, 2012, 116, 7904–7912 CrossRef CAS.
- J. Z. Y. Tan, Y. Fernández, D. Liu, M. Maroto-Valer, J. Bian and X. Zhang, Chem. Phys. Lett., 2012, 531, 149–154 CrossRef CAS.
- J. C. Matsubu, S. Zhang, L. DeRita, N. S. Marinkovic, J. G. Chen, G. W. Graham, X. Pan and P. Christopher, Nat. Chem., 2017, 9, 120–127 CrossRef CAS PubMed.
- T. Huizinga, H. F. J. van 'T Blik, J. C. Vis and R. Prins, Surf. Sci., 1983, 135, 580–596 CrossRef CAS.
- Z. Xu, J. Yu and M. Jaroniec, Appl. Catal., B, 2015, 163, 306–312 CrossRef CAS.
- T. Yang, Y. Huo, Y. Liu, Z. Rui and H. Ji, Appl. Catal., B, 2017, 200, 543–551 CrossRef CAS.
- X. Zou, Z. Rui, S. Song and H. Ji, J. Catal., 2016, 338, 192–201 CrossRef CAS.
- J. Graciani, K. Mudiyanselage, F. Xu, A. E. Baber, J. Evans, S. D. Senanayake, D. J. Stacchiola, P. Liu, J. Hrbek, J. Fernandez Sanz and J. A. Rodriguez, Science, 2014, 345, 546–550 CrossRef CAS PubMed.
- X. Wang, Y. Hong, H. Shi and J. Szanyi, J. Catal., 2016, 343, 185–195 CrossRef CAS.
- X. Wang, H. Shi and J. Szanyi, Nat. Commun., 2017, 8, 513 CrossRef PubMed.
- D. Heyl, U. Rodemerck and U. Bentrup, ACS Catal., 2016, 6, 6275–6284 CrossRef CAS.
- P. S. Eckle, H.-G. Anfang and R. J. Behm, J. Phys. Chem. C, 2011, 115, 1361–1367 CrossRef.
- R. Zhang, G. Wang, B. Wang and L. Ling, J. Phys. Chem. C, 2014, 118, 5243–5254 CrossRef CAS.
- Y. H. Zhao, K. Sun, X. Ma, J. Liu, D. Sun, H. Y. Su and W. X. Li, Angew. Chem., Int. Ed. Engl., 2011, 50, 5335–5338 CrossRef CAS PubMed.
- G. Prieto, P. Concepción, A. Martínez and E. Mendoza, J. Catal., 2011, 280, 274–488 CrossRef CAS.
- J. Wang, G. Li, Z. Li, C. Tang, Z. Feng, H. An, H. Liu, T. Liu and C. Li, Sci. Adv., 2017, 3, e1701290 CrossRef PubMed.
- I. A. Fisher and A. T. Bell, J. Catal., 1997, 172, 222–237 CrossRef CAS.
- A. Goguet, F. C. Meunier, D. Tibiletti, J. P. Breen and R. Burch, J. Phys. Chem. B, 2004, 108, 20240–20246 CrossRef CAS.
- M. A. Natal-Santiago and J. A. Dumesic, J. Catal., 1998, 175, 252–268 CrossRef CAS.
- Y. Dai, S. Liu and N. Zheng, J. Am. Chem. Soc., 2014, 136, 5583–5586 CrossRef CAS PubMed.
- Q. Sun, B. Aguila, G. Verma, X. Liu, Z. Dai, F. Deng, X. Meng, F.-S. Xiao and S. Ma, Chem, 2016, 1, 628–639 CAS.
- F. Liu, W. Kong, C. Qi, L. Zhu and F.-S. Xiao, ACS Catal., 2012, 2, 565–572 CrossRef CAS.
- J.-D. Lin, Q.-Y. Bi, L. Tao, T. Jiang, Y.-M. Liu, H.-Y. He, Y. Cao and Y.-D. Wang, ACS Catal., 2017, 7, 1720–1727 CrossRef CAS.
- G. Huang, Q. Yang, Q. Xu, S. Yu and H. Jiang, Angew. Chem., Int. Ed., 2016, 55, 7379–7383 CrossRef CAS PubMed.
- T. Yang, Y. Huo, Y. Liu, Z. Rui and H. Ji, Appl. Catal., B, 2017, 200, 543–551 CrossRef CAS.
- Y. H. Peng, L. B. Wang, Q. Q. Luo, Y. Cao, Y. Z. Dai, Z. L. Li, H. L. Li, X. S. Zheng, W. S. Yan, J. L. Yang and J. Zeng, Chem, 2018, 4, 613–625 CAS.
- Q. Huang and L. Gao, Chem. Lett., 2003, 32, 638–639 CrossRef CAS.
- Q. Zhang and L. Gao, Langmuir, 2003, 19, 967–971 CrossRef CAS.
Footnotes |
| † Electronic supplementary information (ESI) available: Experimental details and supporting figures and tables. See DOI: 10.1039/c8sc05608k |
| ‡ These authors contributed equally to this work. |
| This journal is © The Royal Society of Chemistry 2019 |