
 Open Access Article
 This Open Access Article is licensed under a Creative Commons Attribution-Non Commercial 3.0 Unported Licence
Facet-dependent photocatalytic hydrogen production of metal–organic framework NH2-MIL-125(Ti)†
Fan
Guo
,
Jin-Han
Guo
,
Peng
Wang
,
Yan-Shang
Kang
,
Yi
Liu
,
Jing
Zhao
 * and
Wei-Yin
Sun
*
* and
Wei-Yin
Sun
*
Coordination Chemistry Institute, State Key Laboratory of Coordination Chemistry, School of Chemistry and Chemical Engineering, Nanjing National Laboratory of Microstructures, Collaborative Innovation Center of Advanced Microstructures, Nanjing University, Nanjing 210023, China. E-mail: jingzhao@nju.edu.cn; sunwy@nju.edu.cn; Tel: +86 25 89683485
First published on 1st April 2019
Abstract
Facet-dependent catalytic activity of hard materials such as metals and metal oxides is well recognized in previous works. However, it has rarely been established for metal–organic frameworks (MOFs), possibly because the soft crystals of MOFs are conceptually different from the hard solids. In this work, the surface structure of the MOF NH2-MIL-125(Ti) has been investigated by density functional theory (DFT) calculations for the first time. These calculations predict that the {110} facet has a surface energy of 1.18 J m−2, which is superior to those of the {001}, {100} and {111} facets. This difference can be attributed to the larger percentage of exposed metal clusters, which can act as active sites in catalysis. Thus, we have devised and successfully obtained a series of nanoscaled NH2-MIL-125(Ti) MOFs with controlled facets both experimentally and theoretically. The sample containing the {110} facet exhibits the highest photocatalytic hydrogen production activity and apparent quantum yield, which are approximately three times those of the sample with a dominant {111} facet.
Introduction
Controlled facets of nanocatalysts have become important because of the putative correlation between surfaces and catalytic activity.1–7 Since the pioneering work of Yang et al. on high-quality anatase TiO2 single crystals with exposed {001} facets,8 the exposure of reactive facets, facet-dependent catalytic activity and the mechanism associated with hard materials, including metals like Pt and metal-containing compounds like Ag3PO4, have been studied.9–11 These types of nanomaterials can usually sense dangling bonds and engineer a corresponding surface reconstruction.12 Nanoscaled metal–organic frameworks (MOFs), a unique new family of hybrid nanomaterials, can combine the beneficial characteristics of MOFs and nanomaterials,13–16 and they have been regarded as highly efficient heterogeneous catalysts during the past decade.17–21 Compared with the well-recognized facet-controlled fabrication of nanomaterials, studies on soft crystals of MOFs have mainly focused on their structures and properties.22 To date, only a few efforts have been initiated to explore the mechanism of surface termination for MOFs.23,24 Due to the variety and complexity of crystal structures and the coexistence of various types of chemical bonds, establishing surface slabs for MOFs remains challenging.In the case of titanium-based MOFs, NH2-MIL-125(Ti), one of the most thoroughly investigated MOF systems, has been revealed to have several semiconductor behaviours, including electron transfer from the photo-excited organic linkers to the metal-oxo clusters.25 Due to the efficiency and universality of catalytic processes, researchers have been inspired to explore NH2-MIL-125(Ti) and have already used this material for optical response,26 photocatalytic CO2 reduction,27 and oxidation of amines to imines.28 In these cases, the morphology of NH2-MIL-125(Ti) is one-fold, indicating its preference for the increased stability of the less reactive facet. Importantly, the growth of a MOF crystal surface is through a two-dimensional surface nucleation or a “birth and spread” growth mechanism. The height of each additional layer is that of a cluster or ligand.29 Jiang and Zheng et al. reported that the metal clusters played a significant role acting as active sites for the photocatalytic activity of catalysts.30,31 As a consequence, when a larger proportion of metal clusters exists on one surface, the facet possesses a higher activity and surface energy.
In this paper, the surface energies of different facets of NH2-MIL-125(Ti) were examined by density functional theory (DFT) calculations. The DFT theoretical calculations predict that the surface energy of the {110} facet is as high as 1.18 J m−2, and more clusters are exposed on that surface than on the {001}, {100} and {111} facets. We designed and accomplished a facile approach for the synthesis of nanoscaled NH2-MIL-125(Ti) with controlled facets and successfully incorporated the more reactive {110} facet. Electrochemical and photochemical measurements as well as control experiments have been carried out. The truncated tetragonal-like plates containing the {110} facet exhibit notable photoelectric correlation performance and the highest photocatalytic hydrogen generation activity, which is three times greater than that of octahedrons with dominant {111} facets. The apparent quantum yield (AQY) at 420 nm is as high as 3.60%. This is the first attempt to investigate the nature of photocatalytic activities from different facets of MOF materials by combining theoretical and experimental methods.
Results and discussion
As shown in Fig. S1,† the {001}, {110}, {100}, and {111} facets of the original NH2-MIL-125(Ti) possess distinct surface structures. Compared with noble metal or inorganic semiconductors, which can easily react with dangling bonds, multiple bonds such as hydrogen bonds, coordination bonds, and covalent bonds are present in NH2-MIL-125(Ti). The general principle of creating surface slabs for MOFs requires the minimal consumption of energy in breaking bonds.23 The surface energies of the facets for MOF NH2-MIL-125(Ti) were studied theoretically with DFT calculations, and the detailed method of creating as-cut surfaces is given in the ESI.† In Fig. 1, all of the surfaces considered in this work are shown by a line, representing the slicing plane. Two surfaces with different positions of the –NH2 groups are constructed for {100} with labels “{100}a” and “{100}b” (Fig. 1c). Apparently, more metal clusters existed on the {110} facet than on the others. In addition, a schematic view of the creation of as-cut surfaces for the facets listed above is shown in Fig. S2.† In these cases, all of the facets can be constructed with a minimal number of coordination bonds per surface area and no broken covalent bonds. Meanwhile, the surface energy (γ) of each facet was calculated with the following formula:where Esurf is the total energy of the relaxed (hkl) surface slab supercell, Ebulk is the total energy of the segment that corresponds to the surface slab in the original bulk crystal, Emol is the energy from the terminal acetate and the exchange energy between HOAc and 2-amino-1,4-benzenedicarboxylic acid (H2bdc-NH2) (see ESI†), and A is the surface area in the surface slab supercell. The theoretically calculated surface energies are as follows: {111} (0.51) < {001} (0.74) < {100}a (0.80), {100}b (0.81) < {110} (1.18) in J m−2. The larger percentage of metal clusters exposed on the {110} facet can contribute to the higher surface energy, and this facet should therefore be more reactive than the others.

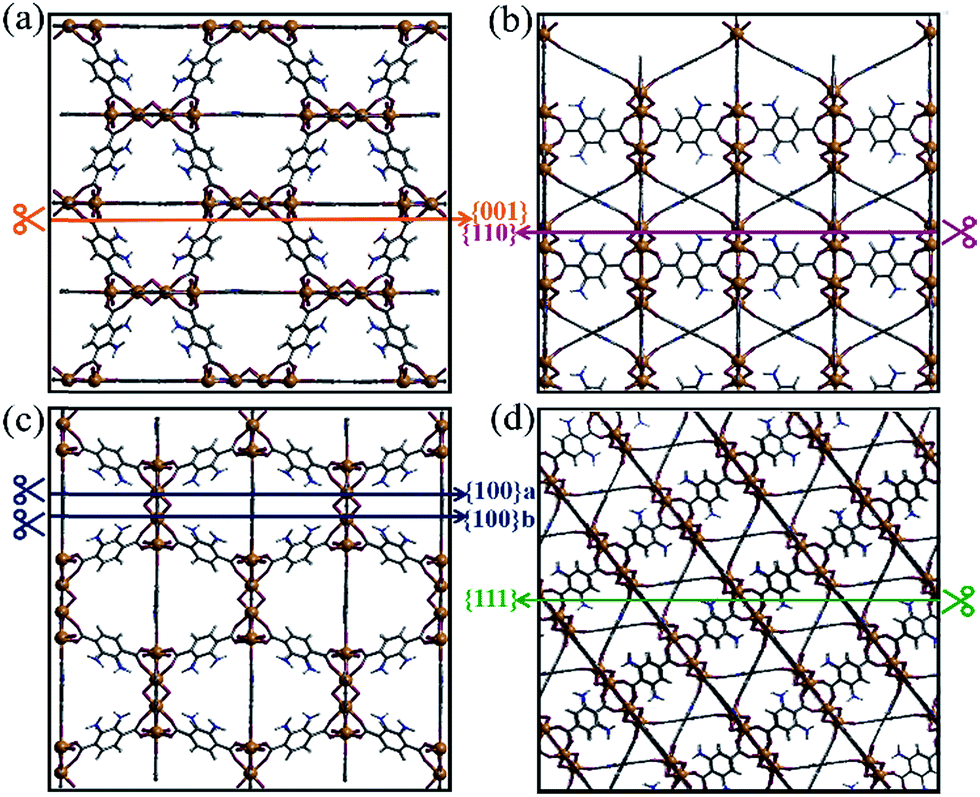 | ||
| Fig. 1 The creation of as-cut planes for the facets (a) {001}, (b) {110}, (c) {100} and (d) {111} by different coloured lines. | ||
Inspired by the theoretical results, we set out to design and synthesize a series of NH2-MIL-125(Ti) crystals with different facets by varying the concentration of the structure-capping surfactant cetyltrimethylammonium bromide (CTAB) in a DMF–CH3OH solution. Scanning electron microscopy (SEM), enlarged SEM, transmission electron microscopy (TEM) images and the corresponding 3D geometric models shown in Fig. 2 revealed that different morphologies of NH2-MIL-125(Ti) were generated depending upon the amount of CTAB used. In the absence of the surfactant CTAB, the products are disk-like plates with two {001} facets, and the average diameter and thickness are estimated as 800 and 200 nm, respectively (Fig. 2a). Under the same reaction conditions, with the addition of 1 mM CTAB, facets of {001} still remained, but the morphology was changed to rounded rectangle-like plates (Fig. 2b). After increasing the concentration of CTAB to 2 mM, the appearance of eight {110} and eight {111} facets was noted, as shown in Fig. 2c. The morphology was changed to truncated tetragon-like plates, the mean particle size is approx. 600 nm, and the thickness remains at 200 nm. The angle of 77.36° in the equilateral triangle between two adjacent rectangles (Fig. 2c-enlarged SEM image) corresponds to the obtuse angle in the {110} facet between two {111} facets (Fig. 2c, 3D geometry model). Fig. 2d shows that the morphology of the sample has evolved into truncated octahedrons consisting of two {001}, four {100}, and eight {111} facets. The mean particle size, however, was maintained at approximately 600 nm when the concentration of CTAB was increased to 3 mM. The {110} facet disappeared because facets with a high surface energy tend to diminish rapidly during the crystal growth process so as to minimize the total crystal energy.8 When the concentration of CTAB was further increased to 4 mM, other facets disappeared, and octahedral nanoparticles with only {111} facets were obtained (Fig. 2e). The results demonstrate that by increasing the concentration of CTAB, an evolution of the nanoscaled NH2-MIL-125(Ti) morphology was observed, from disk-like plates, to rounded rectangle-like plates, to truncated tetragonal-like plates, to truncated octahedrons and finally to octahedrons. These samples are denoted as T001-1, T001-2, T110, T100, and T111, respectively, where T represents Ti, and 001/110/100/111 are the dominant facets. According to the SEM images in Fig. 2c–e, the average percentages of different facets are calculated for samples T110, T100, and T111 from the surface area of each facet and are given in Table S1.†32 SEM energy-dispersive spectra (SEM-EDS) elemental mapping images of the samples ensure the spatial distribution of Ti (Fig. S3†).
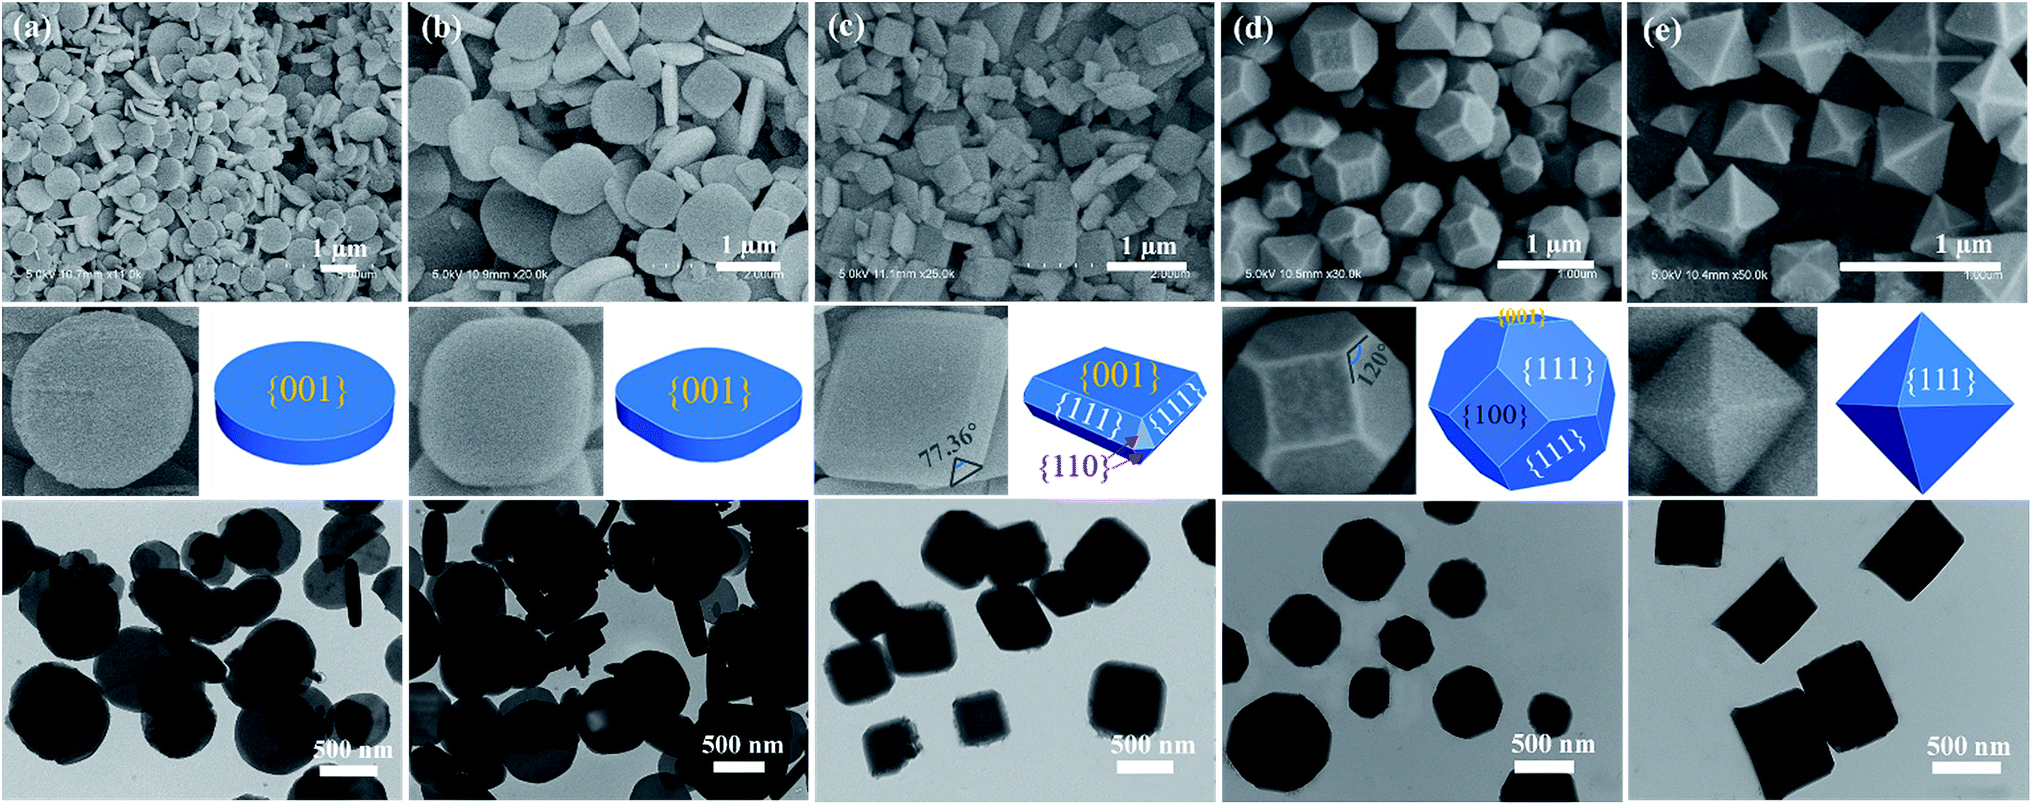 | ||
| Fig. 2 SEM, enlarged SEM, TEM images and the corresponding 3D geometry models of as-synthesized NH2-MIL-125(Ti) obtained under different concentrations of CTAB: (a) 0, (b) 1 mM, (c) 2 mM, (d) 3 mM and (e) 4 mM. | ||
Powder X-ray diffraction (PXRD) data for the products are in good agreement with the simulated MIL-125(Ti), indicating that the framework structures are not influenced by the use of H2bdc-NH2 as an organic linker (Fig. S4†). It is noteworthy that the diffraction intensity ratio for the {110} and {220} facets in the PXRD pattern of sample T110 is obviously higher than those of the others, suggesting that the T110 has a greater possibility of exposing the {110} facet. Likewise, T001-1 and T111 generate the highest diffraction intensity ratio for the {002} and {222}, respectively. Therefore, the surfaces of T001-1 and T111 are dominated by {001} and {111} facets, severally.33 The results imply that the samples exhibit facet-dependent PXRD patterns, which is consistent with the crystal shapes observed by SEM results. Fourier transform infrared (FT-IR) spectra of NH2-MIL-125(Ti) samples have similar characteristic bands, and no cetyltrimethyl groups were detected (Fig. S5†). Similarly, X-ray photoelectron spectroscopy (XPS) data gave no signal for Br− (Fig. S6†), confirming that the samples are surfactant-free. In addition, the atomic concentrations of the samples examined by XPS, which is widely accepted as a surface analysis-based technique, are listed in Table S2.† The Ti 2p concentration of T110 is higher than other samples, indicating that there are more metal clusters on the outer surface of T110 than others. Thermogravimetric (TG) curves show the thermal stability of the samples (Fig. S7†). To ensure the porous structure of the as-synthesized NH2-MIL-125(Ti), N2 adsorption isotherms were measured at 77 K (Fig. S8†). Characteristic type-I sorption isotherms indicate that the samples are microporous materials with high amounts of N2 adsorption. The increase at pressures P/P0 = 0.9–1.0 might be attributed to the inter-particle adsorption that occurs in nanoscaled MOFs.34 The Brunauer–Emmett–Teller (BET) surface areas of these samples were calculated from the N2 adsorption isotherms (Fig. S8†). The results show that the samples exhibit morphology (facet)-dependent sorption properties. In addition, CO2 adsorption data were measured at 273 K (Fig. S9†), and a comparison of the CO2 adsorption with other amine-functionalized MOFs is provided in Table S3.†
To investigate the optical responses of the above samples, corresponding measurements were examined. UV-visible diffuse reflectance spectra show that all samples had a shift of light absorption from the UV to the visible region (Fig. 3a). Photoluminescence (PL) spectra for the products were measured under excitation at 326 nm (Fig. 3b). The steady-state PL spectra show that the PL band centred at approx. 420 nm is strong for T001-1 and T111, while it becomes weak for T001-2 and T100, and it is the weakest for T110. The evident PL quenching indicates that the most rapid and efficient electron transfer is in T110 among the above samples. Moreover, the photoresponsive properties were measured by the photocurrent–time curves, and all of the samples exhibit a clear photocurrent response under visible light irradiation (λ > 400 nm) at a pulse of 40 s (Fig. 3c). T110 in particular was found to have better photoresponse capability and interface charge separation efficiency than other samples. In addition, these results are also supported by electrochemical impedance spectroscopy (EIS). Fig. 3d shows that the capacitance arc for T110 is the smallest, indicating that it has the lowest charge-transfer resistance. It is well established that the different optical and electrochemical properties among the samples suggest their difference in driving the photocatalytic process.
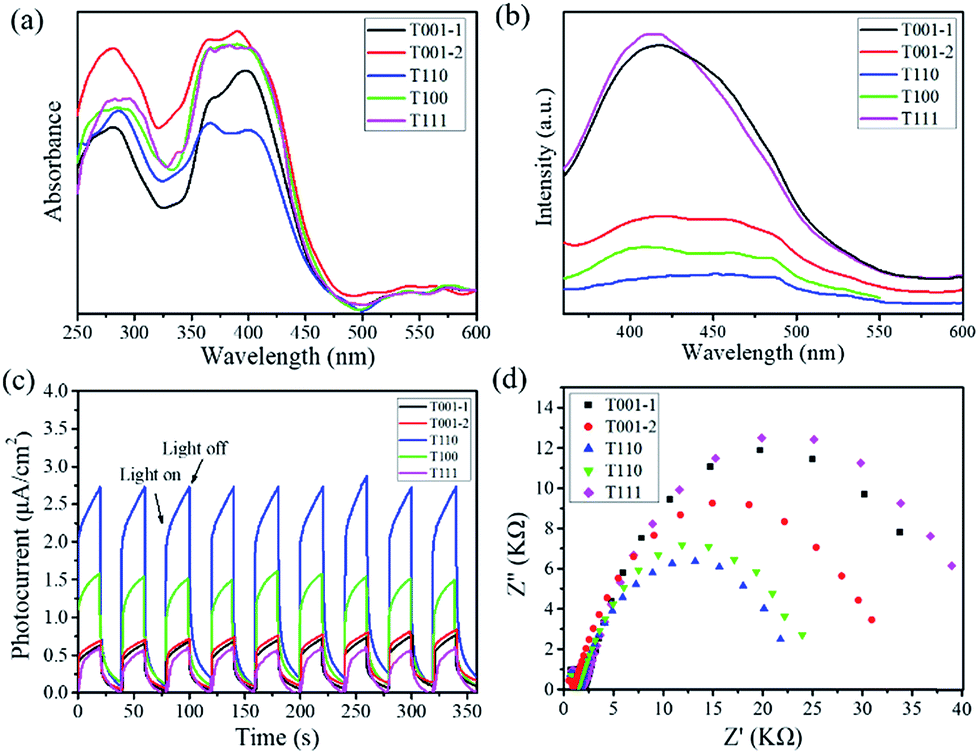 | ||
| Fig. 3 (a) UV-visible diffuse reflectance spectra, (b) PL emission spectra, (c) photocurrent responses, and (d) EIS Nyquist plots for NH2-MIL-125(Ti) with different morphologies. | ||
To assess the photocatalytic ability of NH2-MIL-125(Ti) nanomaterials for visible-light-driven hydrogen evolution, photocatalyst T001-1, T001-2, T110, T100 or T111 was added to a Pyrex reaction vessel containing a mixture of CH3CN and deionized water with triethanolamine (TEOA) as a sacrificial electron donor, and it was exposed to visible-light illumination. Fig. 4a shows the hydrogen evolution rates of photocatalytic hydrogen production under visible light irradiation for each of the five samples. T111 is able to generate a minimal amount of hydrogen, while the T001-1 and T001-2 samples give higher hydrogen production than T111 under identical conditions. Among these varied morphologies, the T110 sample displays the highest hydrogen production rate (60.8 μmol g−1 h−1), which is more than three times that of the T111 sample. More importantly, T110 exhibits almost constant activity even after 30 h during the recycling experiments for up to three cycles, demonstrating its high recyclability and stability for visible-light-driven hydrogen production (Fig. 4b). The SEM image (Fig. S10†) and PXRD pattern of T110 (Fig. S11†) after three catalytic recycles confirmed that the sample maintains its structure, suggesting its high stability under the photocatalytic conditions. Ligand-to-metal charge transfer occurs in NH2-MIL-125(Ti) with T110 as a photocatalyst, and this was confirmed by electron paramagnetic resonance (EPR) spectra (Fig. S12†).35,36 To examine the origin of the hydrogen, D2O was used in the photocatalytic reaction with the other experimental conditions remaining unchanged. The mass spectrometry data show that the resulting gas is a mixture of D2, HD and H2 (Fig. S13†), implying that the origin of hydrogen is from H2O and that the exchange of H+ between H2O and TEOA in the solution may occur. The time-dependence of the rates of hydrogen evolution of the photocatalysts is shown in Fig. S14,† and the hydrogen evolution rates with the previously reported NH2-MIL-125(Ti) and other MOF-based photocatalysts are summarized in Table S4.† It is clear that nanoscaled NH2-MIL-125(Ti) MOFs with definite facets lead to significantly enhanced photocatalytic activity compared to the reported NH2-MIL-125(Ti) materials and even to some MOF-based noble metal-hybrid photocatalysts. To better clarify the photocatalytic performance, the AQY for the hydrogen production37,38 of T110 was calculated to be 3.60% at 420 nm, while the AQY values of other samples including T001-1, T001-2, T100, and T111 are approximately 2.40%, 2.88%, 3.12%, and 1.44%, respectively. An AQY of 3.60% is higher than those of some inorganic semiconductors and correlative composites (Table S5†). The combination of theoretical simulations and experimental investigations suggested that the vital factor for the higher photocatalytic performance of T110 is the superior surface properties of the {110} facet.
 | ||
| Fig. 4 (a) Photocatalytic hydrogen production using NH2-MIL-125(Ti) with different morphologies. (b) Recycling tests using T110. | ||
Conclusions
In summary, we have shown that a facile approach to the synthesis of nanoscaled NH2-MIL-125(Ti) with controlled facets can be realized simply by altering the concentration of CTAB. Electrochemical and photochemical measurements have been carried out. The sample of truncated tetragonal-like plates containing {110} facets exhibits the highest photocatalytic hydrogen production and AQY. By means of DFT calculations of the surface energy on different facets, the higher photocatalytic hydrogen generation could be ascribed primarily to the higher surface activity, which is due to the high percentages of metal clusters. This work provides the first example that facet engineering is one of the most effective strategies for achieving improved and advanced photocatalytic performance of MOF materials.Conflicts of interest
There are no conflicts to declare.Acknowledgements
We gratefully acknowledge the National Basic Research Program of China (grant no. 2017YFA0303504) and the National Natural Science Foundation of China (grant no. 21573106) for financial support of this work. This work was also supported by a Project Funded by the Priority Academic Program Development of Jiangsu Higher Education Institutions.Notes and references
- N. Tian, Z. Y. Zhou, S. G. Sun, Y. Ding and Z. L. Wang, Science, 2007, 316, 732–735 CrossRef CAS PubMed.
- B. Lim, M. Jiang, P. H. C. Camargo, E. C. Cho, J. Tao, X. Lu, Y. Zhu and Y. Xia, Science, 2009, 324, 1302–1305 CrossRef CAS PubMed.
- G. Li, H. Kobayashi, S. Dekura, R. Ikeda, Y. Kubota, K. Kato, M. Takata, T. Yamamoto, S. Matsumura and H. Kitagawa, J. Am. Chem. Soc., 2014, 136, 10222–10225 CrossRef CAS PubMed.
- T. Chen, S. Chen, P. Song, Y. Zhang, H. Su, W. Xu and J. Zeng, ACS Catal., 2017, 7, 2967–2972 CrossRef CAS.
- S. Ghosh, P. Roy, N. Karmodak, E. D. Jemmis and G. Mugesh, Angew. Chem., Int. Ed., 2018, 57, 4510–4515 CrossRef CAS PubMed.
- X. Wang, W. Wang, M. Qiao, G. Wu, W. Chen, T. Yuan, Q. Xu, M. Chen, Y. Zhang, X. Wang, J. Wang, J. Ge, X. Hong, Y. Li, Y. Wu and Y. Li, Sci. Bull., 2018, 63, 1246–1253 CrossRef CAS.
- X. Sun, X. Luo, X. Zhang, J. Xie, S. Jin, H. Wang, X. Zheng, X. Wu and Y. Xie, J. Am. Chem. Soc., 2019, 141, 3797–3801 CrossRef CAS PubMed.
- H. G. Yang, C. H. Sun, S. Z. Qiao, J. Zou, G. Liu, S. C. Smith, H. M. Cheng and G. Q. Lu, Nature, 2008, 453, 638–641 CrossRef CAS PubMed.
- K. Song, J. Jung, M. Park, H. Park, H. J. Kim, S. I. Choi, J. Yang, K. Kang, Y. K. Han and Y. M. Kang, ACS Catal., 2018, 8, 9006–9015 CrossRef CAS.
- G. Liu, H. G. Yang, J. Pan, Y. Q. Yang, G. Q. Lu and H. M. Cheng, Chem. Rev., 2014, 114, 9559–9612 CrossRef CAS PubMed.
- Y. Hu, G. Chen, C. Li, Y. Zhou, J. Sun, S. Hao and Z. Han, J. Mater. Chem. A, 2016, 4, 5274–5281 RSC.
- S. Bai, L. Li, Z. Wang and Y. Xiong, Adv. Sci., 2017, 4, 1600216 CrossRef PubMed.
- N. Stock and S. Biswas, Chem. Rev., 2012, 112, 933–969 CrossRef CAS PubMed.
- J. Yang, X. Chen, Y. Li, Q. Zhuang, P. Liu and J. Gu, Chem. Mater., 2017, 29, 4580–4589 CrossRef CAS.
- Y. Qu, Z. Li, W. Chen, Y. Lin, T. Yuan, Z. Yang, C. Zhao, J. Wang, C. Zhao, X. Wang, F. Zhou, Z. Zhuang, Y. Wu and Y. Li, Nature Catalysis, 2018, 1, 781–786 CrossRef.
- Y. S. Kang, Y. Lu, K. Chen, Y. Zhao, P. Wang and W. Y. Sun, Coord. Chem. Rev., 2019, 378, 262–280 CrossRef CAS.
- Z. Li, M. Shao, L. Zhou, R. Zhang, C. Zhang, M. Wei, D. G. Evans and X. Duan, Adv. Mater., 2016, 28, 2337–2344 CrossRef CAS PubMed.
- X. Kang, H. Liu, M. Hou, X. Sun, H. Han, T. Jiang, Z. Zhang and B. Han, Angew. Chem., Int. Ed., 2016, 55, 1080–1084 CrossRef CAS PubMed.
- S. N. Zhao, X. Z. Song, S. Y. Song and H. J. Zhang, Coord. Chem. Rev., 2017, 337, 80–96 CrossRef CAS.
- H. Zhang, T. Wang, J. Wang, H. Liu, T. D. Dao, M. Li, G. Liu, X. Meng, K. Shi, L. Chang, T. Nagao and J. Ye, Adv. Mater., 2016, 28, 3703–3710 CrossRef CAS PubMed.
- L. Han, X. Y. Yu and X. W. Lou, Adv. Mater., 2016, 28, 4601–4605 CrossRef CAS PubMed.
- D. Zacher, R. Schmid, C. Woll and R. A. Fischer, Angew. Chem., Int. Ed., 2011, 50, 176–199 CrossRef CAS PubMed.
- S. Amirjalayer, M. Tafipolsky and R. Schmid, J. Phys. Chem. Lett., 2014, 5, 3206–3210 CrossRef CAS PubMed.
- M. J. Van Vleet, T. Weng, X. Li and J. R. Schmidt, Chem. Rev., 2018, 118, 3681–3721 CrossRef CAS PubMed.
- S. Y. Han, D. L. Pan, H. Chen, X. B. Bu, Y. X. Gao, H. Gao, Y. Tian, G. S. Li, G. Wang, S. L. Cao, C. Q. Wan and G. C. Guo, Angew. Chem., Int. Ed., 2018, 57, 9864–9869 CrossRef CAS PubMed.
- C. H. Hendon, D. Tiana, M. Fontecave, C. Sanchez, L. D'Arras, C. Sassoye, L. Rozes, C. Mellot-Draznieks and A. Walsh, J. Am. Chem. Soc., 2013, 135, 10942–10945 CrossRef CAS PubMed.
- Y. Fu, D. Sun, Y. Chen, R. Huang, Z. Ding, X. Fu and Z. Li, Angew. Chem., Int. Ed., 2012, 51, 3364–3367 CrossRef CAS PubMed.
- D. Sun, L. Ye and Z. Li, Appl. Catal., B, 2015, 164, 428–432 CrossRef CAS.
- M. Shoaee, M. W. Anderson and M. P. Attfield, Angew. Chem., Int. Ed., 2008, 47, 8525–8528 CrossRef CAS PubMed.
- Q. Yang, Q. Xu and H. L. Jiang, Chem. Soc. Rev., 2017, 46, 4774–4808 RSC.
- Z. H. Yan, M. H. Du, J. Liu, S. Jin, C. Wang, G. L. Zhuang, X. J. Kong, L. S. Long and L. S. Zheng, Nat. Commun., 2018, 9, 3353 CrossRef PubMed.
- J. Pan, G. Liu, G. Q. Lu and H. M. Cheng, Angew. Chem., Int. Ed., 2011, 50, 2133–2137 CrossRef CAS PubMed.
- Y. Liu, S. Liu, D. He, N. Li, Y. Ji, Z. Zheng, F. Luo, S. Liu, Z. Shi and C. Hu, J. Am. Chem. Soc., 2015, 137, 12697–12703 CrossRef CAS PubMed.
- T. Rodenas, I. Luz, G. Prieto, B. Seoane, H. Miro, A. Corma, F. Kapteijn, F. X. Llabrés i Xamena and J. Gascon, Nat. Mater., 2014, 14, 48–55 CrossRef PubMed.
- M. B. Chambers, X. Wang, L. Ellezam, O. Ersen, M. Fontecave, C. Sanchez, L. Rozes and C. Mellot-Draznieks, J. Am. Chem. Soc., 2017, 139, 8222–8228 CrossRef CAS PubMed.
- Z. Li, J. D. Xiao and H. L. Jiang, ACS Catal., 2016, 6, 5359–5365 CrossRef CAS.
- Z. Wang, Y. Inoue, T. Hisatomi, R. Ishikawa, Q. Wang, T. Takata, S. Chen, N. Shibata, Y. Ikuhara and K. Domen, Nature Catalysis, 2018, 1, 756–763 CrossRef.
- S. Chen, T. Takata and K. Domen, Nat. Rev. Mater., 2017, 2, 17050 CrossRef CAS.
Footnote |
| † Electronic supplementary information (ESI) available: XPS spectra, TG, PXRD, N2 adsorption and desorption isotherms, CO2 adsorption, SEM, EPR spectra, hydrogen production rate, surface structures, creating as-cut surfaces, and average percentages of different facets. Comparison tables regarding the CO2 adsorption, photocatalytic hydrogen production performances, and AQY of this work with other MOF photocatalysts reported in the literature. See DOI: 10.1039/c8sc05060k |
| This journal is © The Royal Society of Chemistry 2019 |