
 Open Access Article
 This Open Access Article is licensed under a Creative Commons Attribution-Non Commercial 3.0 Unported Licence
Linear-hairpin variable primer RT-qPCR for MicroRNA†
Lin
Lan
a,
Qiuping
Guo
acd,
Hemin
Nie
 a,
Chang
Zhou
e,
Qingyun
Cai
bc,
Jin
Huang
*bcd and
Xiangxian
Meng
*a
a,
Chang
Zhou
e,
Qingyun
Cai
bc,
Jin
Huang
*bcd and
Xiangxian
Meng
*a
aCollege of Biology, Hunan University, Changsha, P. R. China. E-mail: xxmeng@hnu.edu.cn
bCollege of Chemistry and Chemical Engineering, Hunan University, Changsha, P. R. China. E-mail: jinhuang@hnu.edu.cn
cState Key Laboratory of Chemo/Biosensing and Chemometrics, P. R. China
dKey Laboratory for Bio-Nanotechnology and Molecular Engineering of Hunan Province, P. R. China
eSchool of Life Sciences, Hunan Normal University, Changsha, P. R. China
First published on 4th December 2018
Abstract
Here, we present a highly specific, sensitive and cost-effective system to quantify microRNA (miRNA) expression based on two-step RT-qPCR with EvaGreen detection chemistry, called linear-hairpin variable primer RT-qPCR. It takes advantage of the novel designed variable primer, which is initially designed to be linear, extending to form a hairpin structure and replacing the target miRNA for cyclic RT. Then the RT product is quantified by conventional EvaGreen based qPCR. The results show that this method has a dynamic range of 8 logs and the sensitivity is sufficient to directly detect down to 4 target miRNA molecules with a total analysis time of less than 2 hours. It is capable of discriminating between similar miRNAs, leading to an accurate representation of the mature miRNA content in a sample. The RT step can be multiplexed and the 8 miRNA profiles measured in 7 mouse tissues by this method show an excellent correlation with the commercial standard TaqMan RT-qPCR assays (r2 = 0.9881).
Introduction
MicroRNAs (miRNAs) are a family of small non-coding RNA molecules (19–24 nt) that function in RNA silencing and regulation of gene expression.1–4 There is growing evidence that miRNAs can be identified as new types of biomarkers for diagnosis and gene therapy.5–8 Nevertheless, it remains a huge challenge due to the natural characteristics of miRNAs, such as small size, low abundance, and highly similar sequences within the family members. To date, miRNA expression has been measured by many techniques, such as Northern blotting,9 DNA microarray analysis,10 reverse transcription quantitative polymerase chain reaction (RT-qPCR),11 various enzyme or nanomaterial-based amplification assays,12–18 and even direct sequencing. Among these techniques, RT-qPCR is the most widely accepted method when only a small number of targets are quantified due to the limited material.However, significant technical challenges exist when RT-qPCR is used for miRNA expression profiling. First, miRNA molecules are so short that they are the same length as a traditional PCR primer. Second, miRNAs are so similar within the same family that sometimes even only one base is different. To solve these problems, several methods based on RT-qPCR have been developed to quantify miRNAs. The basic idea is to reverse transcribe the target miRNA to a longer cDNA by using extended primers. Generally, we can divide these methods into two types. For the first type of methods, an identical tail was used to elongate miRNA which was primed into cDNA by reverse transcription.19–21 However, these methods have high background and usually need extra enzymatic steps. The second type of methods is to design specific RT primers for each target miRNA. These primers usually can be designed into linear primers22,23 and non-linear primers.24–26 For example, Sharbati-Tehrani et al. reported a linear primer based RT-PCR for miRNA expression profiling in a complex sample.23 Chen et al. developed a stem-loop primer based RT-PCR, which proved to have better specificity than the linear primer.25 Overall, for linear primers, the specificity is insufficient; for nonlinear primers being usually designed as hairpins, the background signals are relatively high for using the commercial double-stranded DNA sensitive dye inserting hairpin primers.
In order to integrate the advantages of the two types of primers, here, we have described a novel sensitive and specific method to quantify miRNA expression that utilizes specially designed linear-hairpin variable primers and EvaGreen based qPCR named “linear-hairpin variable primer RT-qPCR”. The core of this idea is that the variable primer is initially designed to be linear, extending to form a hairpin structure and replacing the target for next reverse transcription to realize cyclic RT. Then the amplification RT products are quantified by conventional EvaGreen based qPCR to perform sensitive and specific detection. Thus, the method has low background due to the fact that the dye cannot insert the designed linear primer effectively and has high specificity owing to a hairpin structure formed only in presence of target.
Results
The working principle of the linear-hairpin variable primer RT-qPCR for the miRNA assay is presented in Fig. 1. The linear-hairpin variable RT primer is designed, which consists of parts ‘a*’, ‘b’ and ‘c’. Among them, part ‘a*’ is used to recognize the target sequence and to serve as the loop of the subsequently formed hairpin structure. The sequence of part ‘b’ is the same as the 5′-terminal region of the target. When the variable primer is extended to be ‘b*’, part ‘b’ can hybridize with ‘b*’ to serve as the stem of the subsequently formed hairpin structure. In addition, the newly generated ‘b*’ can serve as a foothold for the forward primer of real-time PCR. Part ‘c’ is usually long and extends the length of cDNA and serves as a foothold for the reverse primer of real-time PCR. During the RT reaction (Step 1), the linear-hairpin variable primer (c–b–a*) is recognized by target miRNA (b–a). In the presence of reverse transcriptase, the linear primer is extended based on the miRNA to be an incomplete hairpin structure (c–b–a*–b*), which displaces the target miRNA. At the same time, the incomplete hairpin (c–b–a*–b*) continues to extend to be a complete hairpin structure (c–b–a*–b*–c*) by using itself as a template to further extend the length of cDNA. In this way, the target miRNA can be reused in the next reverse transcription. For real-time PCR (Step 2), the cDNA product (c–b–a*–b*–c*) is quantified by conventional EvaGreen based qPCR using two specific primers (forward primer and reverse primer).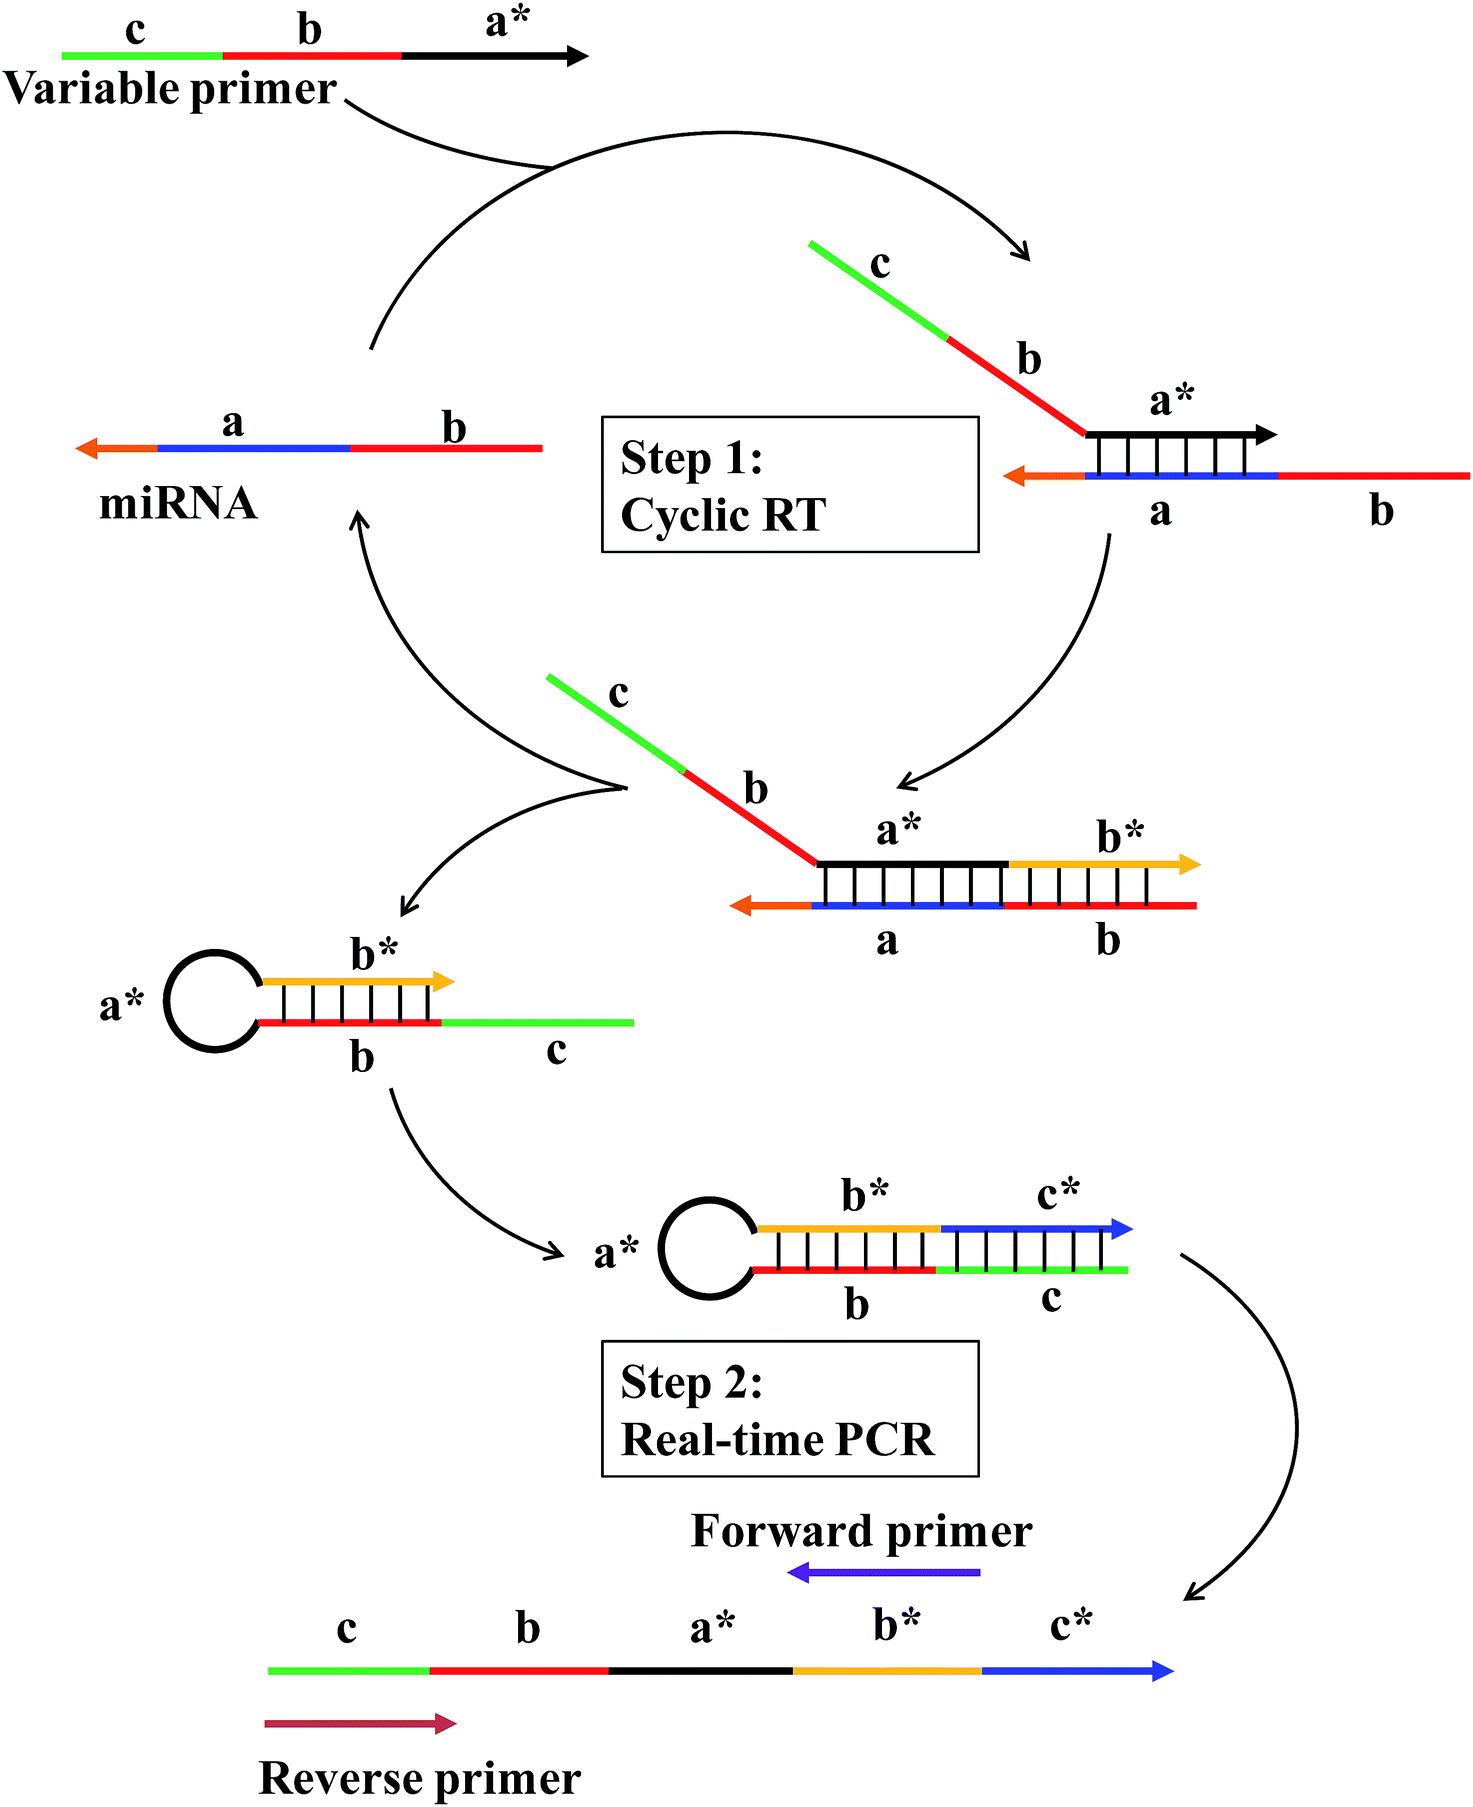 | ||
| Fig. 1 Schematic of the linear-hairpin variable primer RT-qPCR for miRNA. Letters marked with * are complementary to the corresponding unmarked letter. The direction of the arrow represents 5′–3′ of the sequence. Step (1) The variable primer (c–b–a*) is recognized by fragment “a” of target miRNA (b–a) and elongated to be an incomplete hairpin structure (c–b–a*–b*), which displaces the target miRNA for the cyclic RT. Then, the incomplete hairpin (c–b–a*–b*) continues to extend to be a complete hairpin structure (c–b–a*–b*–c*) by using itself as a template to further extend the length of cDNA. Step (2) The cDNA product (c–b–a*–b*–c*) is quantified by EvaGreen based qPCR using two specific primers (forward primer and reverse primer). | ||
In general, the specially designed linear-hairpin variable primer has four functions: (1) it acts as a primer for specifically reverse transcription of the target miRNA; (2) it extends to form a hairpin structure enabling the target miRNA to be recycled; (3) it makes the cDNA long enough for PCR amplification; (4) it contains the same sequence of the reverse primer. We reasoned that the introduction of part ‘b’, the same as the 5′-terminal region of the target, will significantly increase the sensitivity and specificity of the RT reaction, as it is conducive to the formation of hairpins and results in the displacement of the target miRNA to participate in another reverse transcription. Also, part ‘a’ with a recognizing target sequence can be designed to be longer (7–8 nt), providing more bases to hybridize with the miRNA target. The long hybridization of the primer with the target means that the RT reaction can still be performed at 42 °C (optimal reaction temperature for the reverse transcriptase) to ensure the specificity and efficiency of reverse transcription. Part ‘b’ also helps to improve the discrimination between highly similar targets that differ in only one base of the miRNA sequence. The reason is that the sequences of target miRNAs are double checked: first in the RT and then in the qPCR.
To test this concept, we designed two RT primers with different lengths of ‘b’: one with a ‘b’ part of 10 nt (variable primer), and the other of 0 nt (linear primer). The results showed that the linear primer gave a significantly higher qPCR Cq value (Cq = 15.02) than that of the variable primer (Cq = 22.83) (Fig. 2(a)); and the fluorescence of variable primer RT-qPCR was obviously larger than that of linear primer RT-qPCR (Fig. S1†), suggesting the function of ‘b’ towards the sensitivity of the system. Furthermore, we verified that the variable primer extends to produce a free RT product (hairpin structure), resulting in the target miRNA indeed being replaced as shown in the principle of the method. We compared the RT reaction process of the above-mentioned variable primer and linear primer by native PAGE (Fig. 2(b)) and denaturing PAGE (Fig. S2†) experiments. These results showed that the variable primer produces a new band compared to the linear primer. This new band is the RT product formed by the variable primer elongation. It can exist independently, indicating that it has been separated from the target miRNA, and the free miRNA can be used for another reverse transcription to realize cyclic RT.
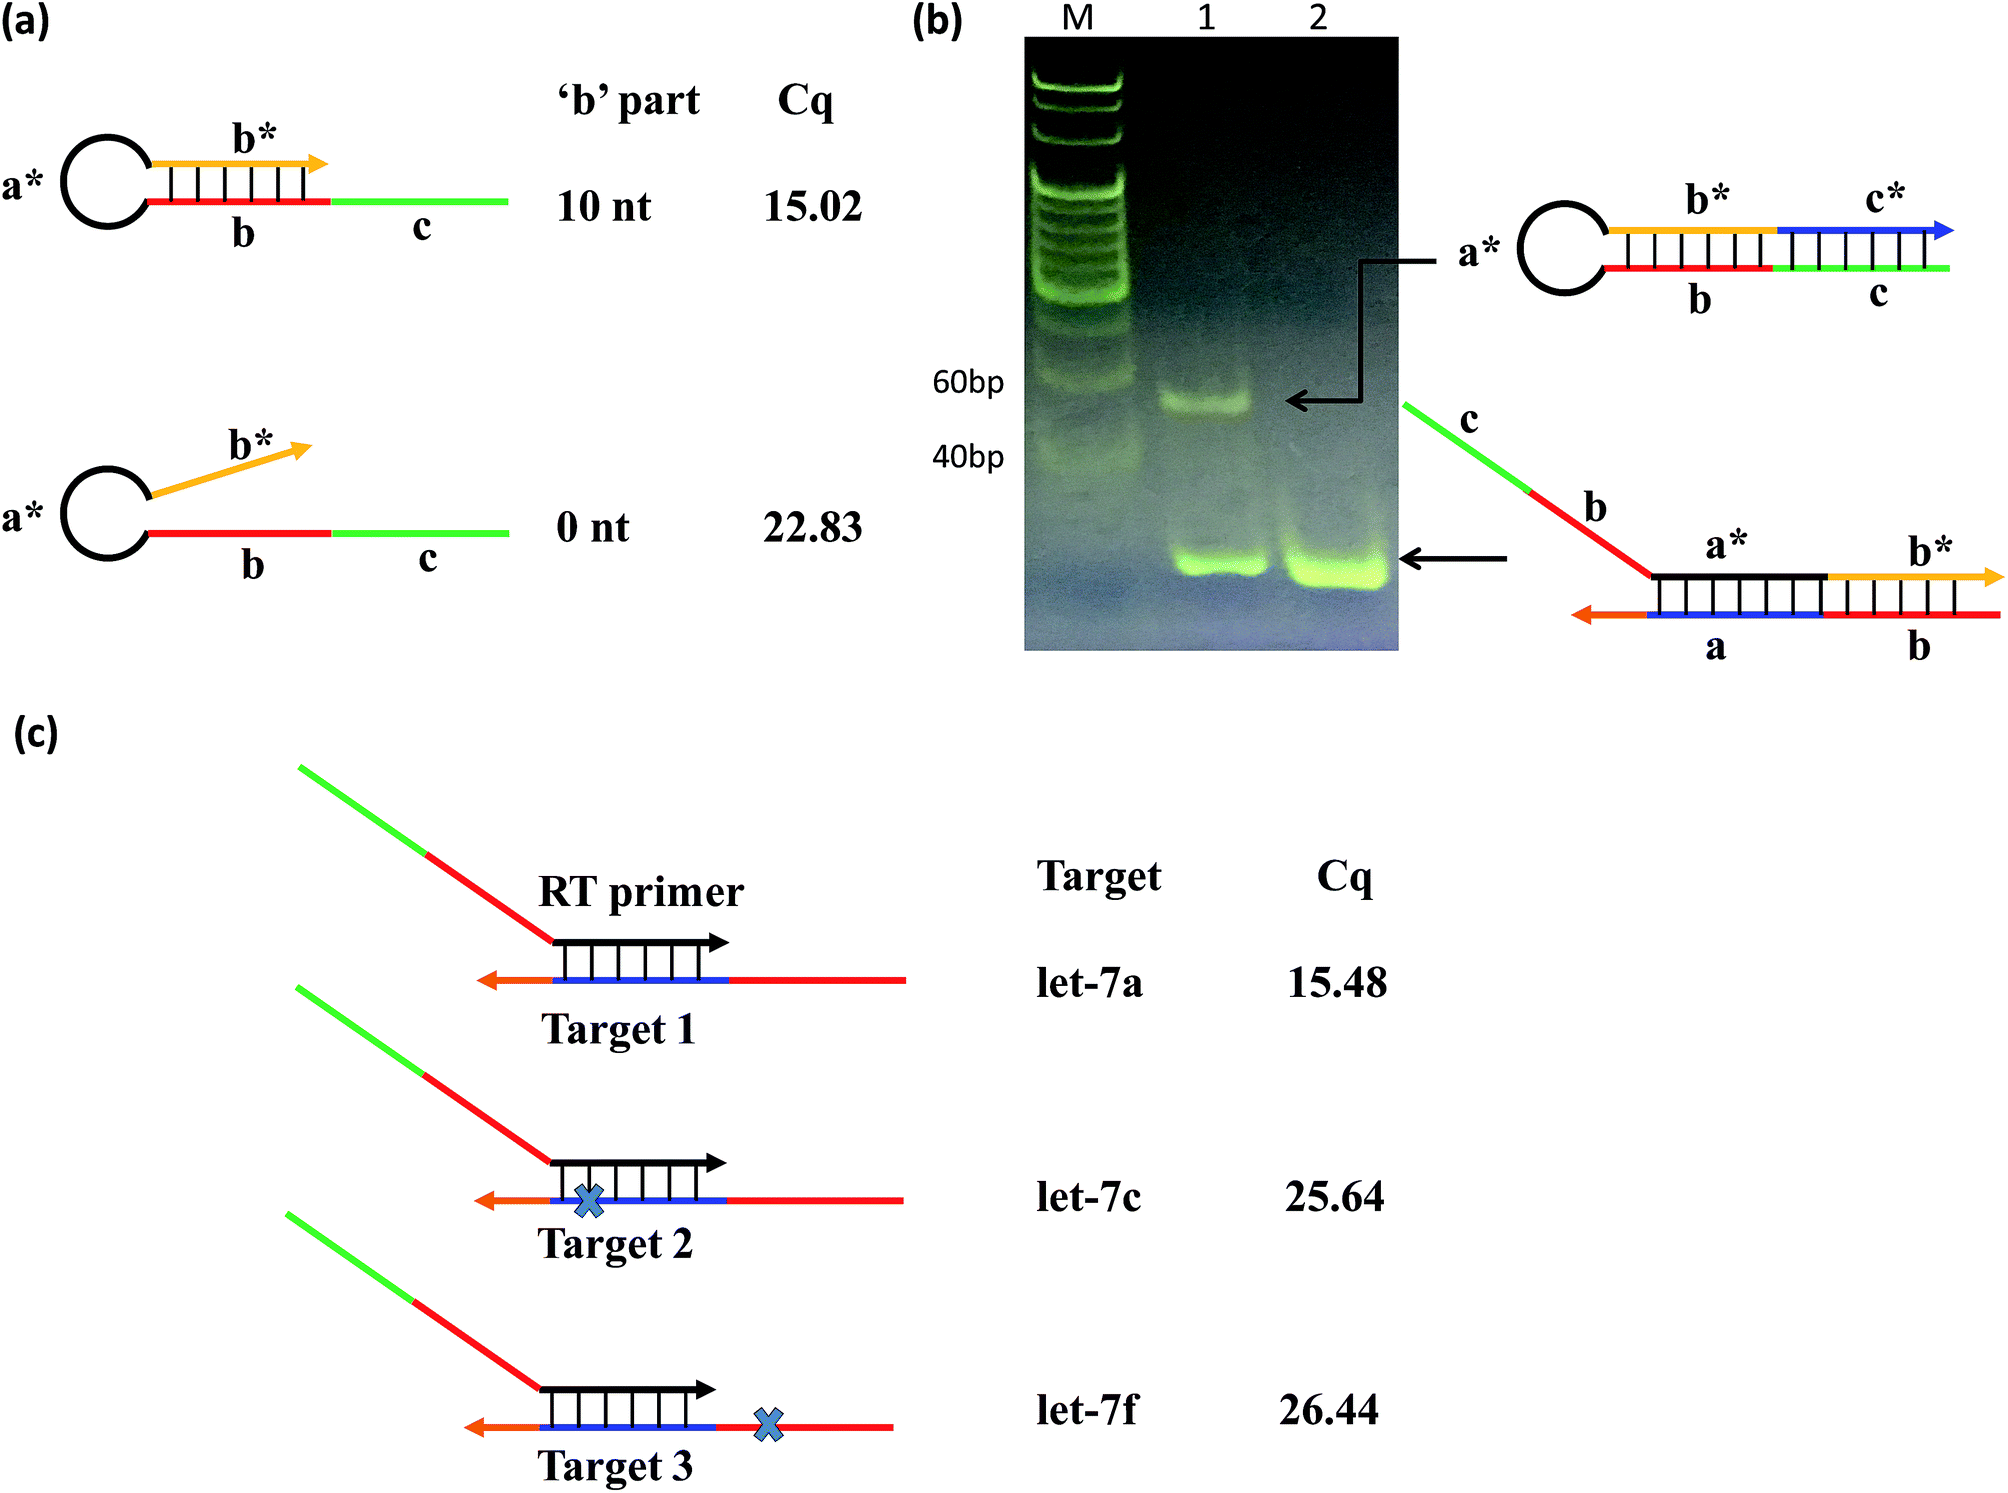 | ||
| Fig. 2 (a) The RT products with the linear-hairpin variable primer (‘b’ = 10 nt) and linear primer (‘b’ = 0 nt), as well as the corresponding Cq values. (b) Native PAGE analysis of the RT stage between that using the variable primer (lane 1) and linear primer (lane 2), respectively (‘a’ = ‘a*’ = 8 nt; ‘b’ = ‘b*’ = 10 nt; ‘c’ = ‘c*’ = 26 nt). The samples with 50 nM variable primer (lane 1) or linear primer (lane 2) and 1.5 nM let-7d were incubated for 45 min at 42 °C, and then inactivated for 5 min at 85 °C. (c) The linear-hairpin variable primers are used to assay targets that differ in one nucleotide, where the cross marks denote the variation positions. | ||
To test the contribution of ‘a*’ and ‘b’ to the specificity, we compared three variable RT primers for their ability to discriminate between two sets of the Let-7miRNA family: let-7a vs. let-7c, and let-7a vs. let-7f. The let7a and let7c differ only in one base in the ‘a’ region. The let7a and let7f differ only in one nucleotide located in the ‘b’ region. The results showed that a single base difference, whether it's in position ‘a’ or position ‘b’, gave significantly higher qPCR Cq values (Fig. 2(c)). This means that the high specificity of the variable RT primer with ‘a*’ and ‘b’ is effective in the identification of similar targets, even with a single base difference.
From the principle of Fig. 1, the amplification of the linear-hairpin variable primer RT-qPCR depends on the structure of the variable primer. In this case, it is crucial to design the lengths of ‘a*’ and ‘b’ in the variable primer to achieve the desired degree of amplification. For the length of ‘a*’, adequate length is needed to ensure that the RT reaction temperature reaches the optimum temperature (42 °C) of the RT enzyme, but if it is too long, it would restrain the conformational change of the RT polymerized product. For the length of ‘b’, if it is too long, it would reduce the length of ‘a*’, and if it is too short, it blocks the formation of hairpins, thereby inhibiting the target miRNA replacement. Thus, we designed the variable primers with the lengths of ‘a*’ being 6 nt, 7 nt, 8 nt and 9 nt, respectively (Table S1(a) in the ESI†). The results of the Cq values demonstrated that the optimal length of ‘a*’ is 8 nt (Fig. 3(a)). In order to see how the RT works, we did the real-time monitoring of the RT process (Fig. S3†). In the initial period of the reaction, there was no obvious signal increase. After about 14 minutes, the signal increased rapidly. We found that, in the RT process, the primer and target were hybridized based on eight bases, which may be unstable. In this dynamic process of hybridization and dehybridization, transcriptional polymerization occurs during hybridization, and polymerization stops during dehybridization. This may be the reason why there is no significant signal growth in the process of the initial RT process. When the polymerization reaches a certain length, a relatively stable hybridization will be formed. The RT will be accelerated and the signal rise will be enhanced significantly. Meanwhile, different lengths of ‘b’, containing 7 nt, 8 nt, 9 nt, 10 nt and 11 nt, are tested (Table S1(b) in the ESI†). The 10 nt length of ‘b’ showed the minimum Cq (15.02), which is far less than the other lengths. The results showed that the optimal length of ‘b’ is 10 nt (Fig. 3(b)). These optimum conditions were used for the following experiments.
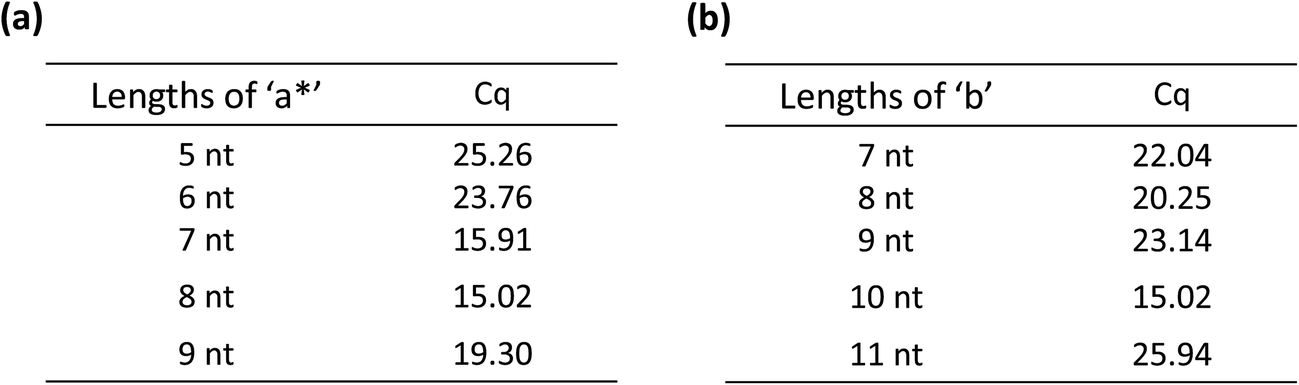 | ||
| Fig. 3 (a) The linear-hairpin variable primer RT-qPCR with different lengths of ‘a*’ and the corresponding Cq values. (b) The linear-hairpin variable primer RT-qPCR with different lengths of ‘b’ and the corresponding Cq values. | ||
The sensitivity of the linear-hairpin variable primer RT-qPCR assay for miRNA quantification was evaluated using a synthetic let-7d miRNA as the target. Synthetic let-7d RNA was prepared ranging from 1.6 × 10 to 1.6 × 10⁸ copies per RT reaction (Fig. 4(a)). The linear-hairpin variable primer RT-qPCR assay exhibited a good linear relationship between the logarithm of miRNA input and Cq values over 8 orders of magnitude in both the single system and complex yeast RNA system. The LOD of the method for let-7d miRNA was estimated to be 4 miRNA molecules. Here, we estimate the LOD at the lowest concentration, which produces 95% positive replicates.27 To further compare the sensitivity and dynamic range of the linear-hairpin variable primer RT-qPCR to those of other methods, we used the hairpin primer RT-qPCR and TaqMan RT-qPCR to analyze the same target let-7d miRNA. The comparative standard curves showed that the variable primer RT-qPCR exhibited better sensitivity than the other two methods (Fig. 4(b)).
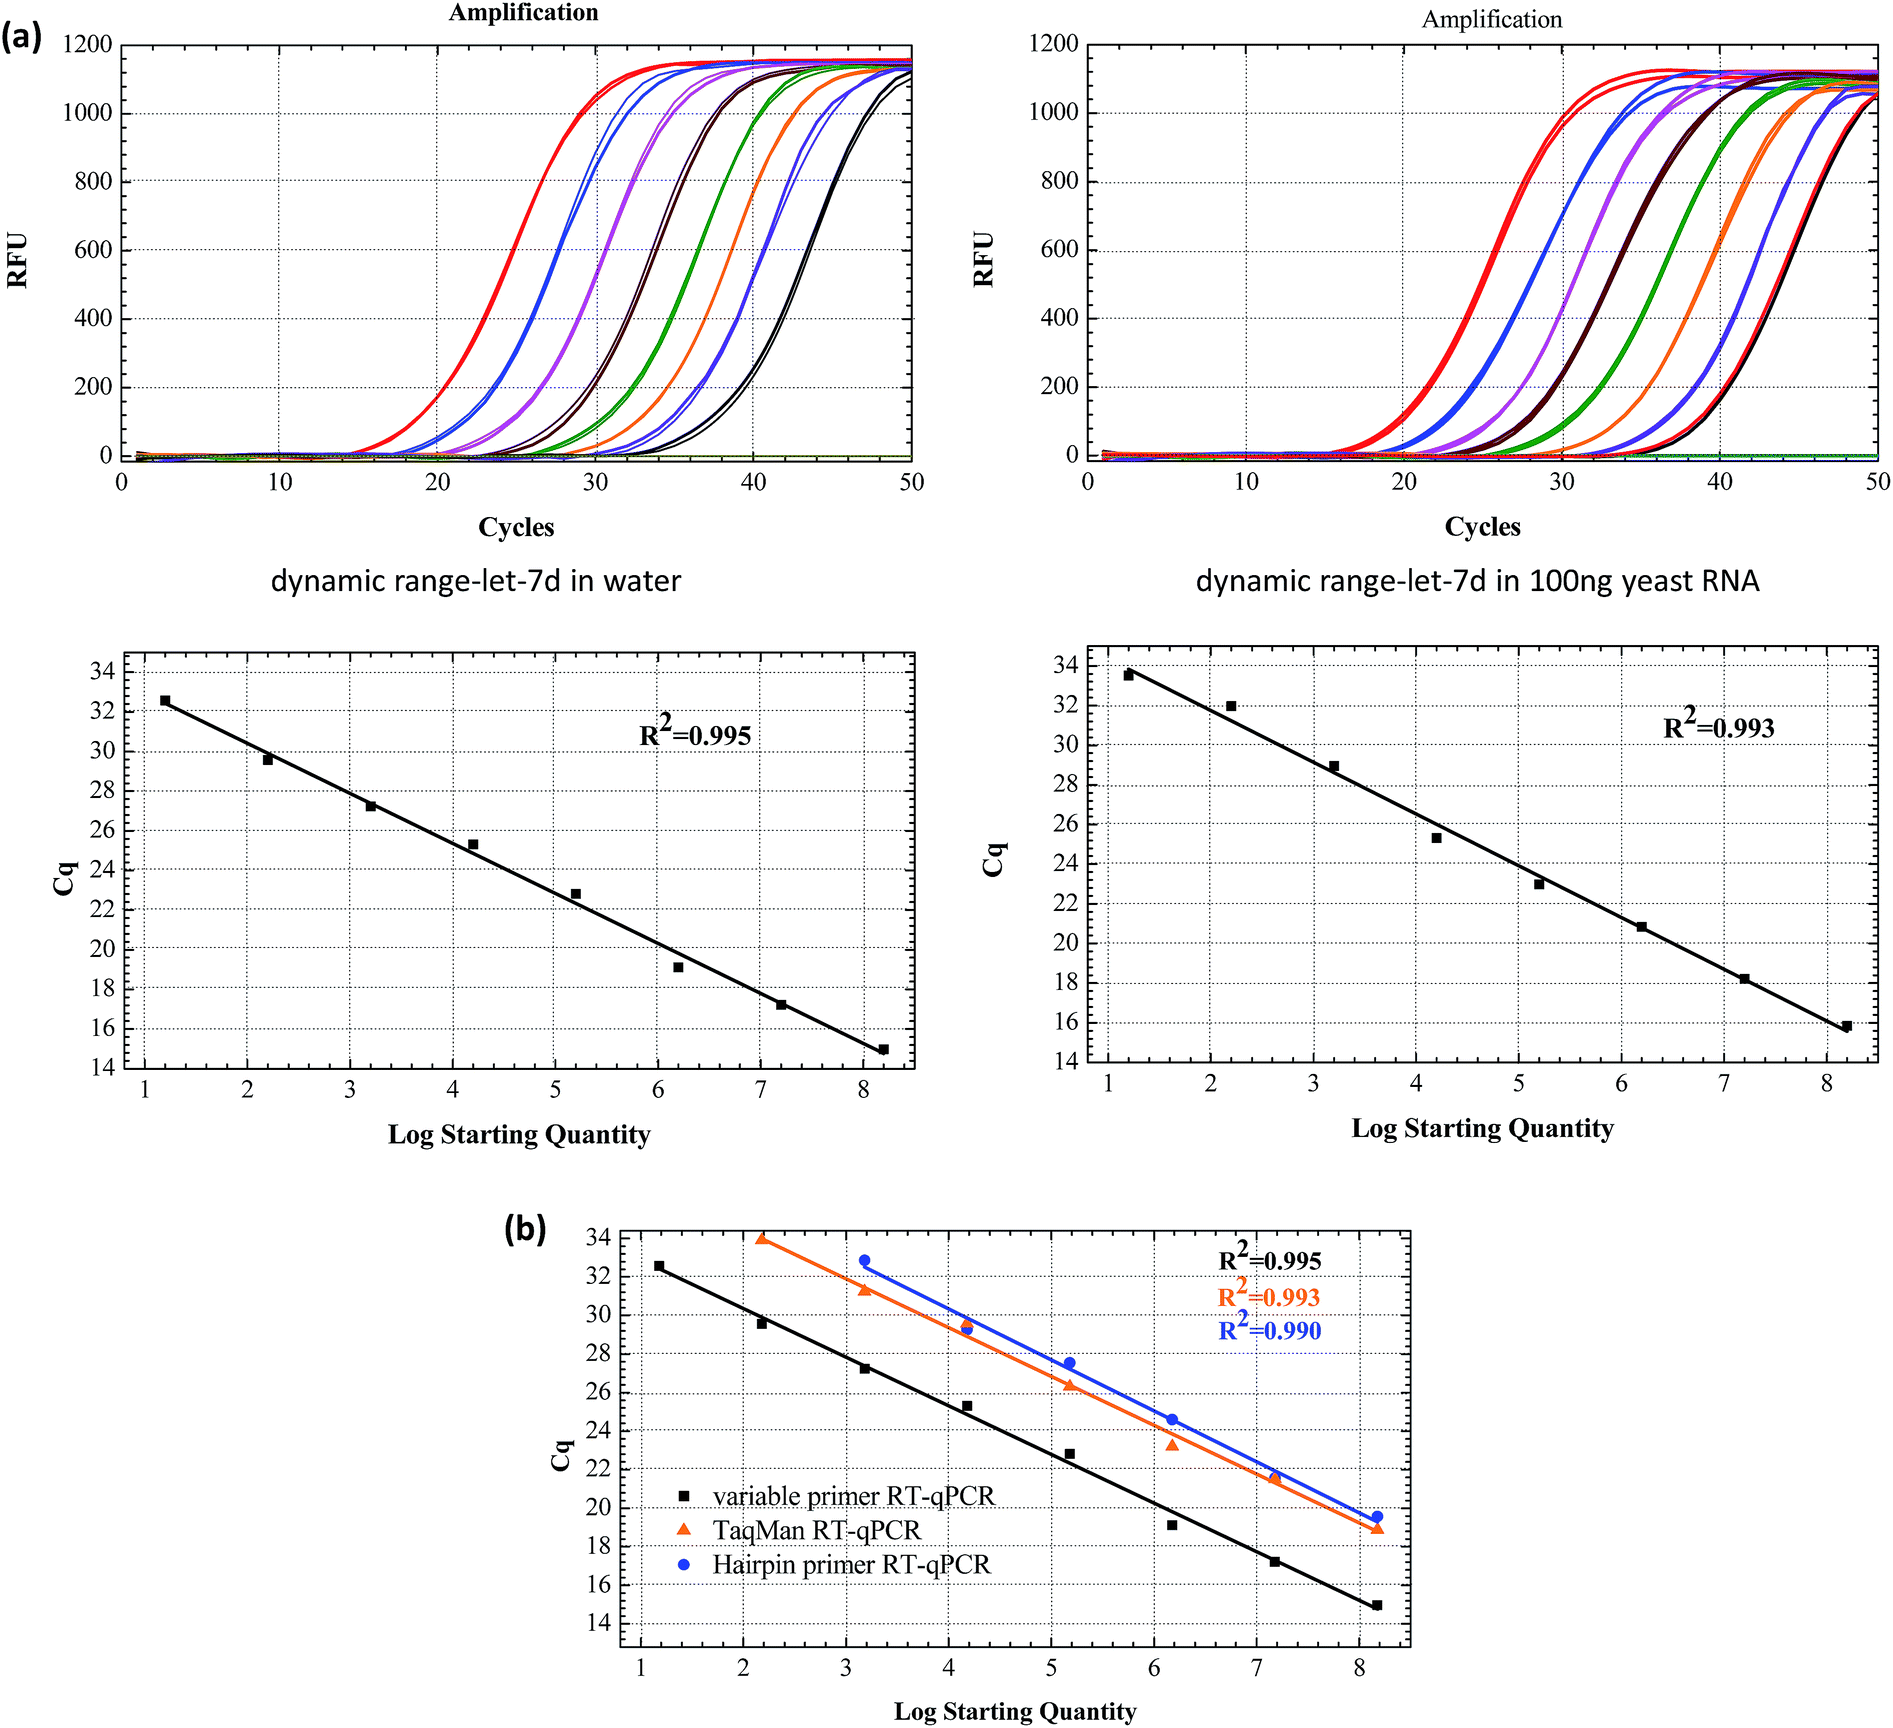 | ||
| Fig. 4 (a) The amplification plot and standard curves of let-7d miRNA assayed by using the linear-hairpin variable primer RT-qPCR. The target let-7d miRNA in water and total yeast RNA ranged from 1.6 × 10 to 1.6 × 10⁸ copies. (b) Standard curves of let-7d assayed with the linear-hairpin variable primer RT-qPCR, the hairpin primer RT-qPCR and TaqMan RT-qPCR, respectively. | ||
To demonstrate the selectivity of the method, the capability of discriminating between similar sequences with the linear-hairpin variable primer RT-qPCR was tested on the let-7 miRNA family. The detection method for let-7a, let-7c, let-7d, and let-7f miRNAs was used to test each miRNA sequence, which contains eight synthetic miRNAs of let-7a, let-7b, let-7c, let-7d, let-7e, let-7f, let-7g and let-7i (Fig. 5(a)). If assuming that the efficiency of perfect matching is 100%, we can calculate the relative detection efficiency according to the Cq differences between perfectly matched and mismatched targets. The results of Fig. 5(b) showed that very low levels of non-specific signals were observed, revealing the excellent specificity of the method. To test if the linear-hairpin variable primer RT-qPCR assay can distinguish mature miRNA from its precursor, we tested the same amount of mature let-7a, let-7c, let-7d, let-7f and their related precursor miRNAs. It showed 0.18% for pre-let7a, 0.21% for pre-let7c, 0.4% for pre-let7d, and 0.37% for pre-let7f, demonstrating that the linear-hairpin variable primer RT-qPCR assay specifically quantifies the amounts of mature miRNAs (Fig. 5(b)).
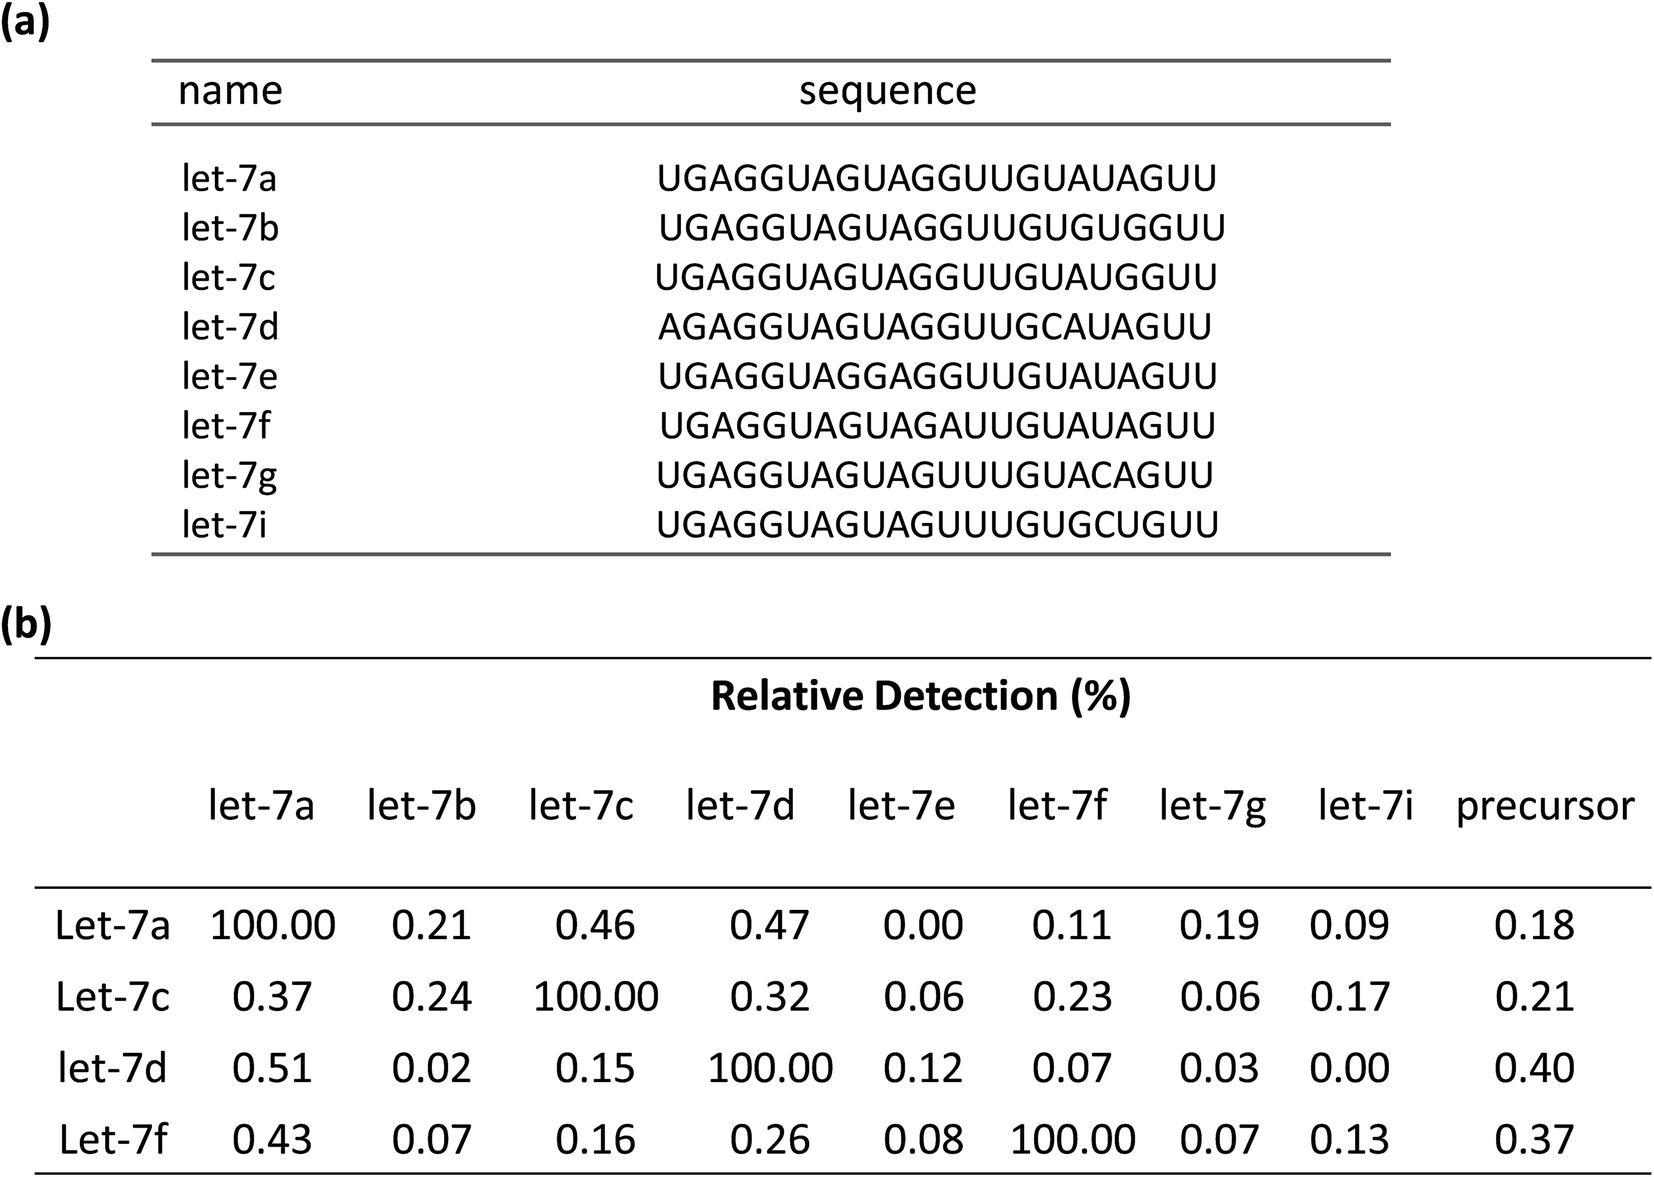 | ||
| Fig. 5 (a) Sequences of eight members of the let-7 family. (b) Measured false-positive levels of let-7 miRNA family members expressed and related precursors relative to the level of the targeted members let-7a, let-7c, let-7d and let-7f miRNAs by the linear-hairpin variable primer RT-qPCR. | ||
In order to demonstrate the reliability of the method, we tested the linear-hairpin variable primer RT-qPCR assays on biological samples. Here, the expression of 8 miRNAs (let-7a, miR-1a-3p, miR-21a-5p, miR-24-3p, miR-30c-1-3p, miR-122-5p, miR-196a and miR-199a) across 7 mouse tissues (heart, brain, kidney, lung, muscle, liver and cereb) was measured and compared with measurements using TaqMan RT-qPCR assays (the sequences used in these two methods are shown in Tables S3 and S4 in the ESI†). The results of Fig. 6(a) show the relative expression levels across the tissues by the two different methods, which were calculated from the relative Cq values (Tables S5 and S6 in the ESI†). The results were in agreement with previous reports, in which miR-122-5p is highly expressed in the liver, and miR-1a-3p is highly expressed in the heart and muscle.22,28
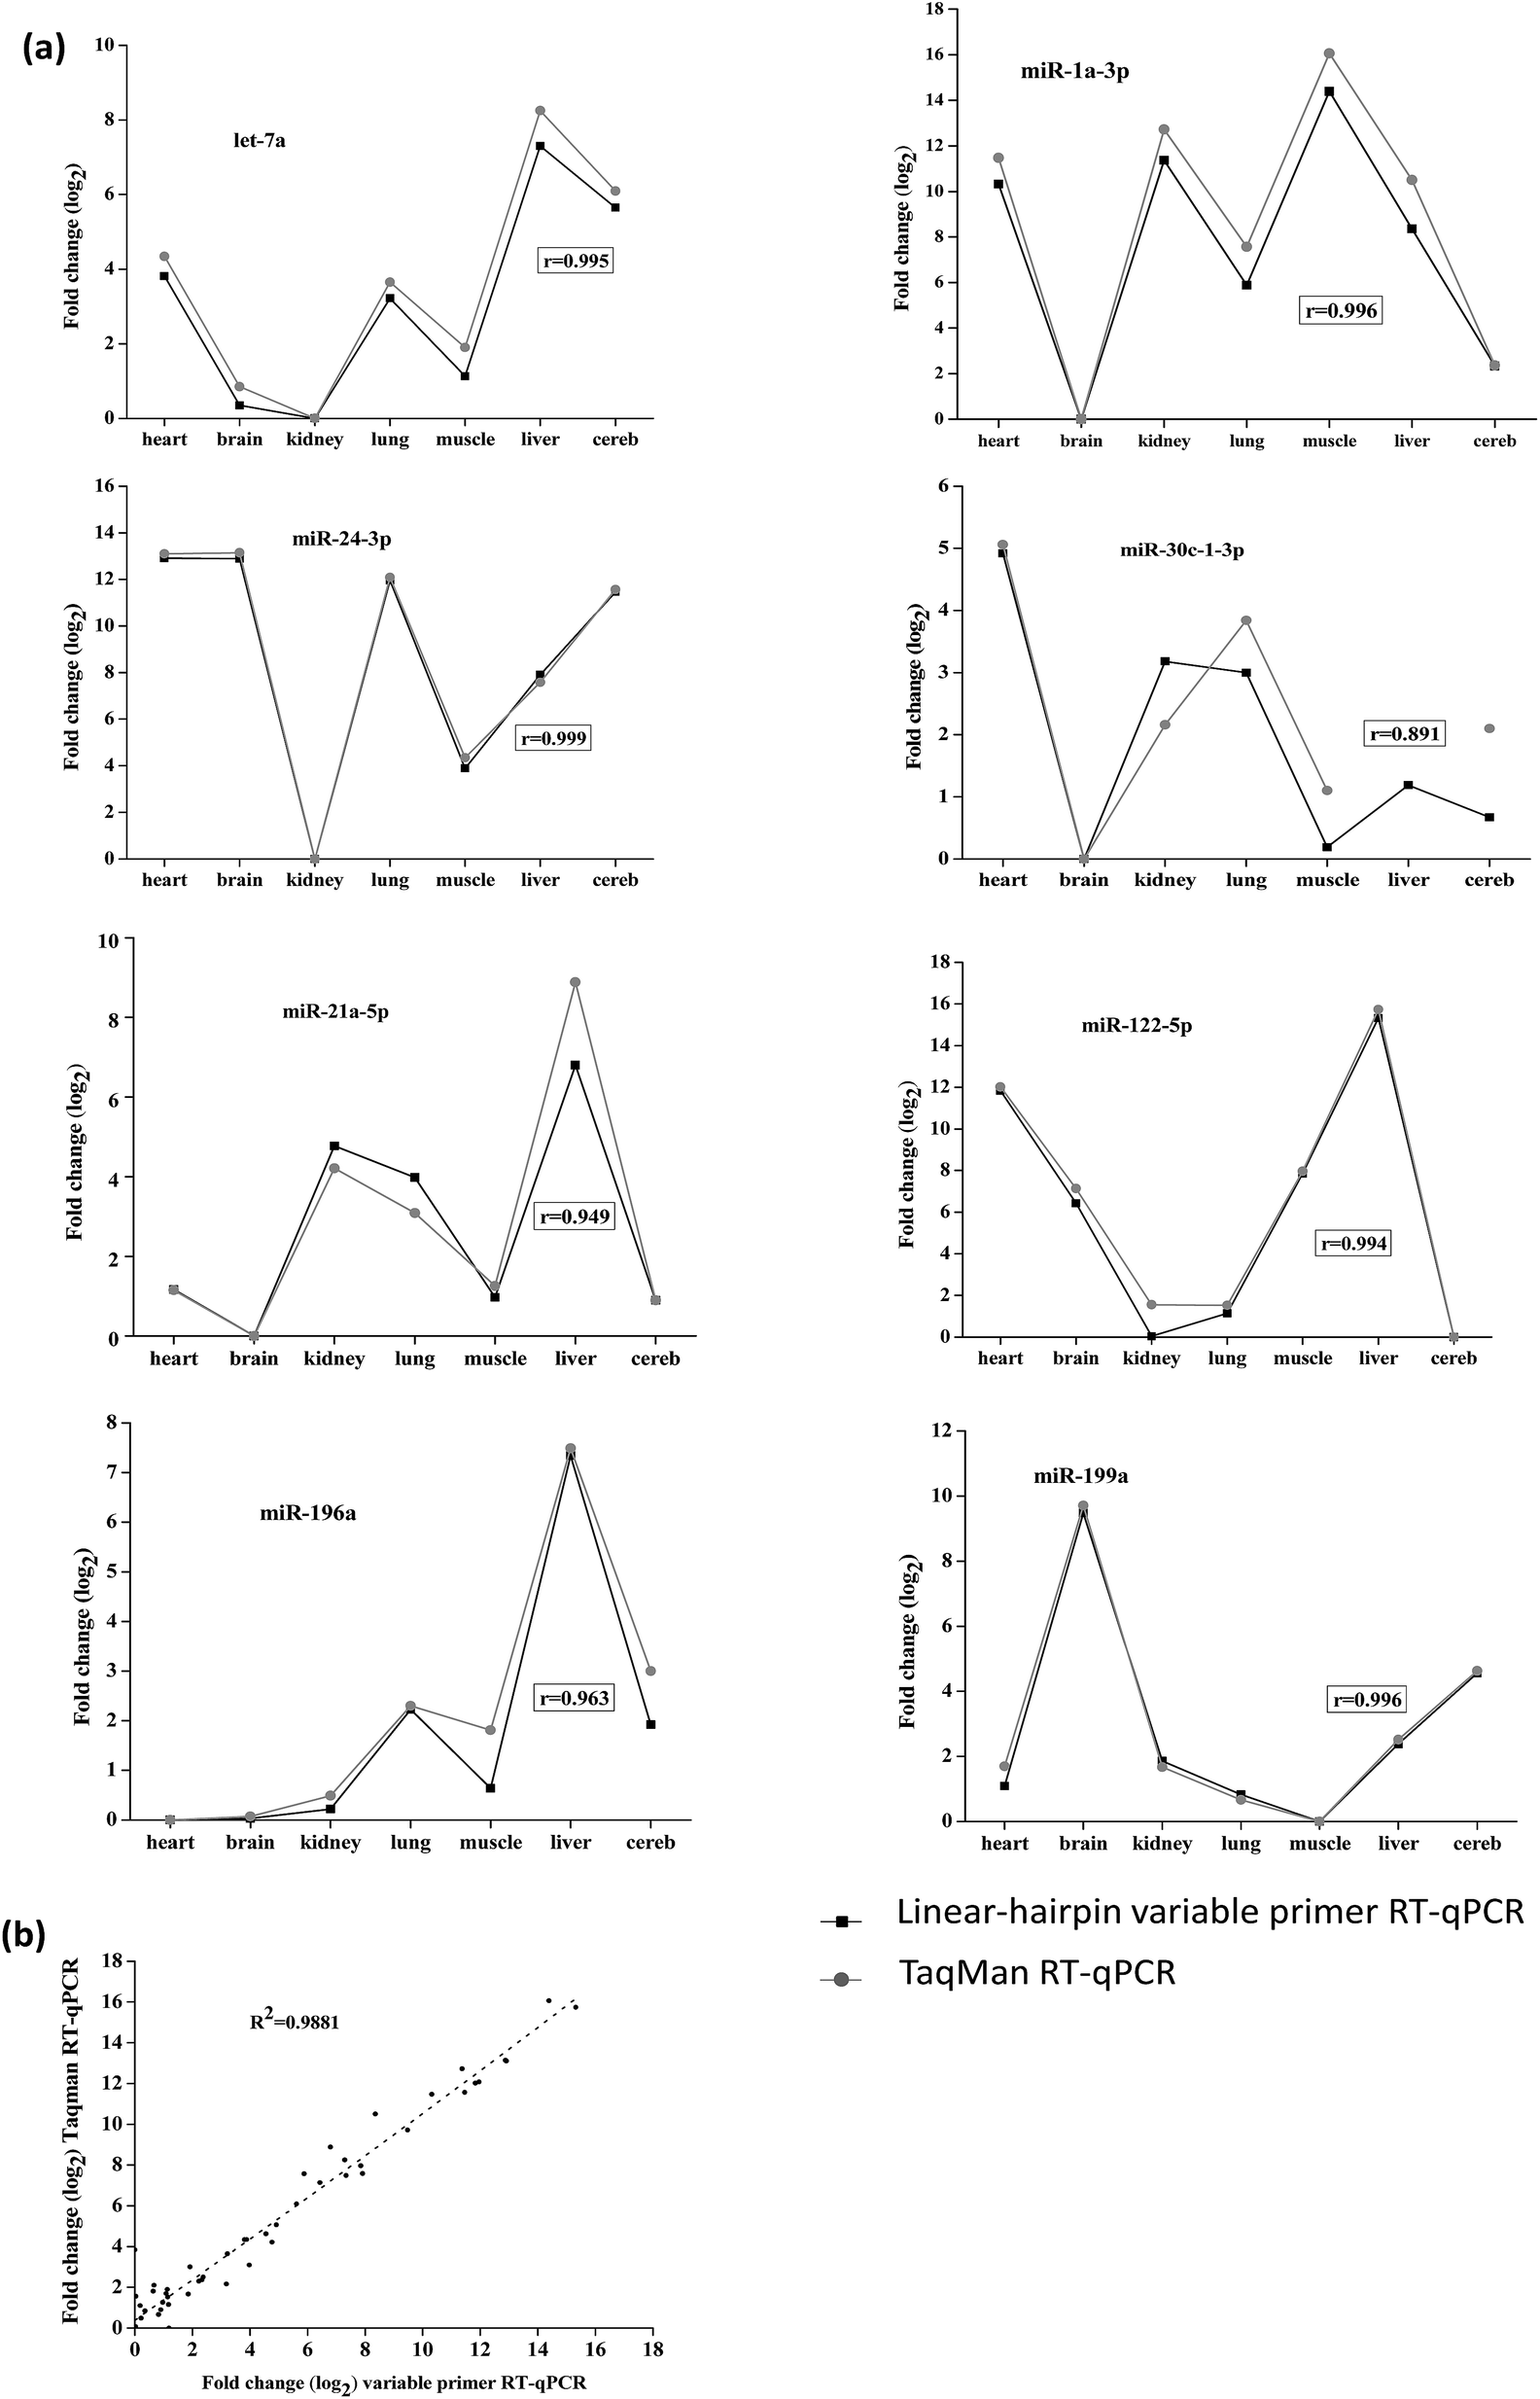 | ||
| Fig. 6 Comparison of expression profiles measured with two different methods. (a) The expression of 8 miRNAs (let-7a, miR-1a-3p, miR-21a-5p, miR-24-3p, miR-30c-1-3p, miR-122-5p, miR-196a and miR-199a) across 7 mouse tissues (heart, brain, kidney, lung, muscle, liver and cereb) measured by the linear-hairpin variable primer RT-qPCR assay and TaqMan RT-qPCR assay, respectively. (b) Overall correlation of the relative expression changes measured with the two methods. Cq values are presented as the average of 2 qPCR replicates. | ||
The overall correlation of the relative expression changes was measured with the two methods, including the variable primer RT-qPCR assays and the TaqMan miRNA assays (Fig. 6(a)). Except for the detection of miR-30c-1-3p, all the measured targets showed very high Pearson correlation coefficients (r) between the variable primer RT-qPCR assays and the TaqMan miRNA assays. This relatively lower correlation (0.874) for miR-30c-1-3p detection may be due to the TaqMan miR-30c-1-3p assay, which produced very high and therefore uncertain Cq values (33.85–36.33). Considering all the measured data the correlation between the variable primer RT-qPCR and the TaqMan miRNA assays was excellent (R2 = 0.985, Fig. 6(b)), suggesting the reliability of the linear-hairpin variable RT-qPCR assay.
Finally, we tested multiplexing the RT step with the variable primer RT-qPCR assays. Here, eight miRNA targets across seven mouse tissues were measured. Eight variable RT primers were added to a certain amount of total mouse RNAs for reverse transcription. And then, a certain amount of the produced cDNA was separated for each qPCR with specific PCR primers (the sequences shown in Table S3†). The relative expression of miRNA levels was calculated by the Cq values. Finally, we compared the expression levels between singleplex and multiplex protocols. Except miR-1a, miR-21a and let-7a, there was no significant difference in Cq values between the singleplex and multiplex protocols (Δq < 0.2) (Fig. 7(a)). For miR-1a, miR-21a and let-7a, the shift was constant and could be repeated across samples, so it did not affect the calculation of relative expression levels. The overall correlation of the relative expression changes measured between singleplex and multiplex protocols was excellent (r2 = 0.9849, Fig. 7(b)).
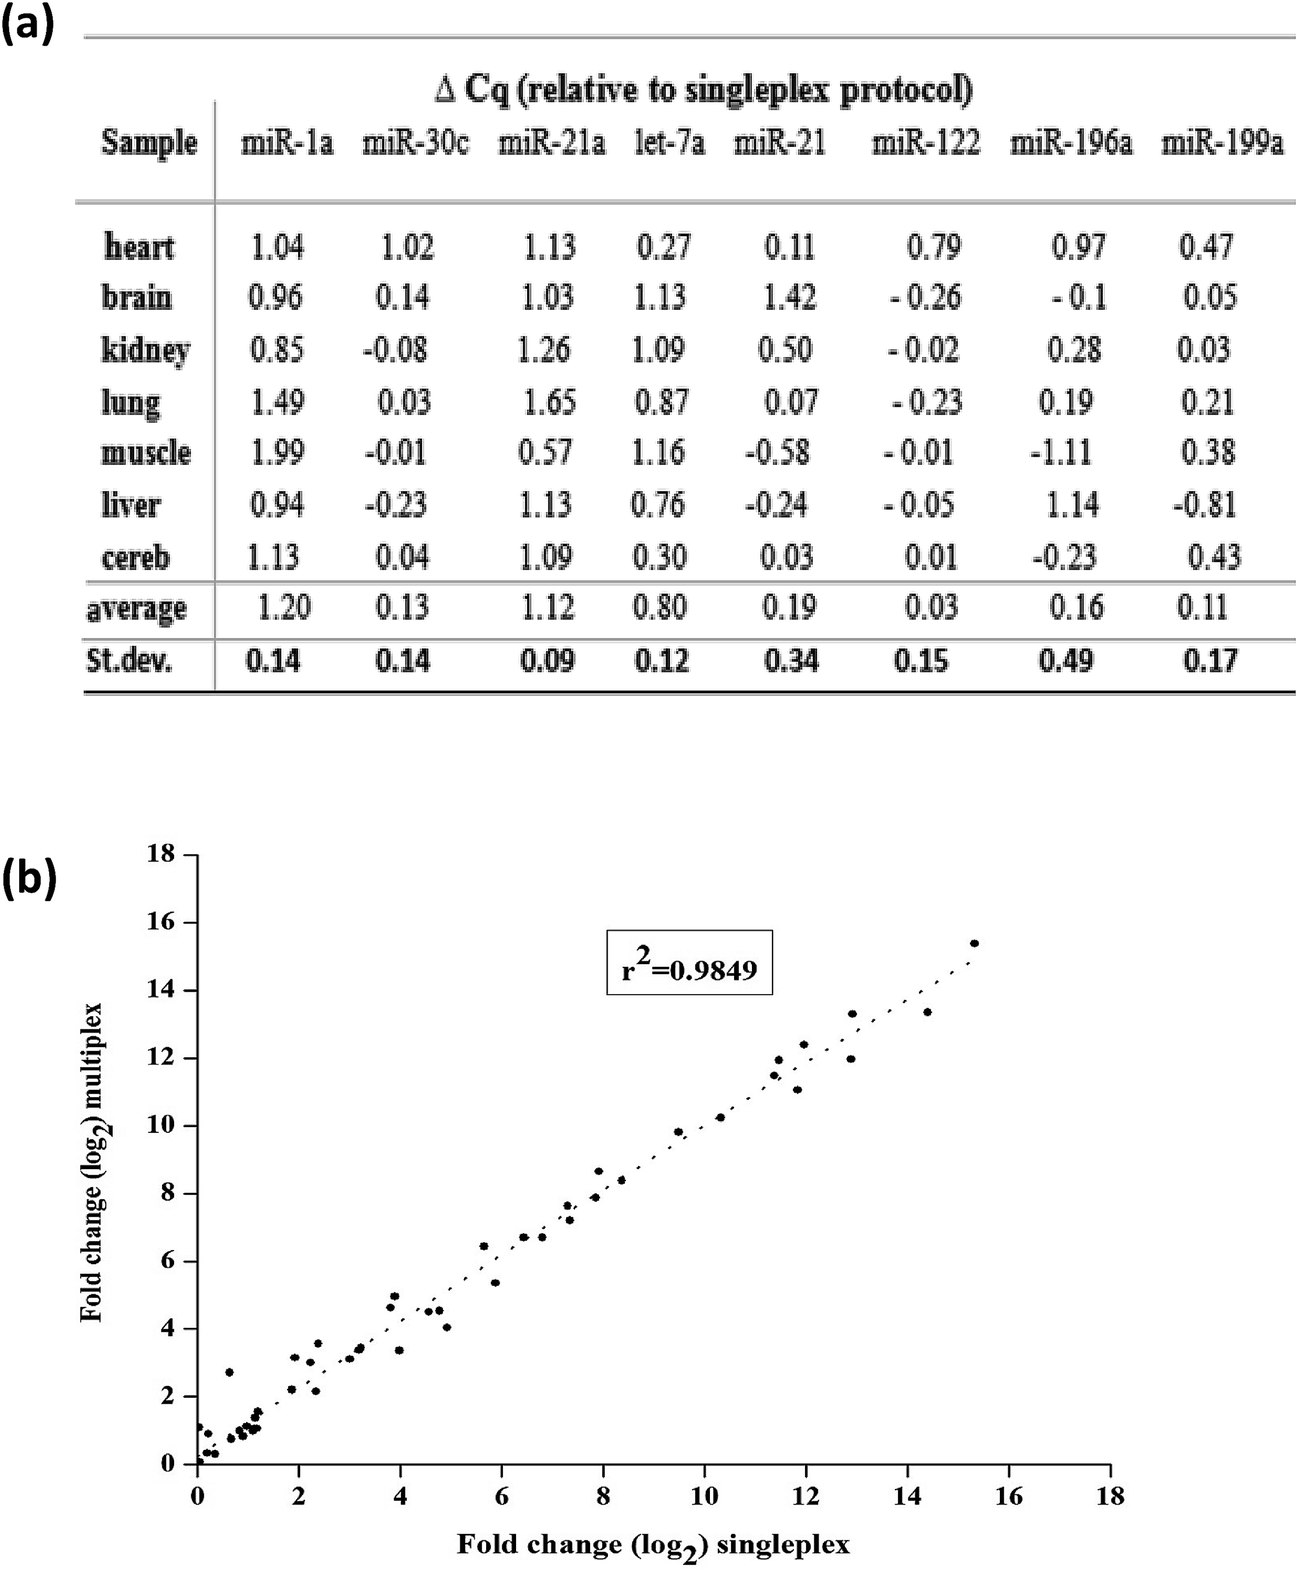 | ||
| Fig. 7 (a) Comparison of singleplex and multiplex linear-hairpin variable RT-qPCR assays. ΔCq = Cqmultiplex − Cqsingleplex. (b) Overall correlation of the relative expression changes measured between tissues measured with the singleplex and multiplex protocols. | ||
Discussion
It is proved that the miRNA family could act as disease or tissue specific biomarkers because of its specific functions in gene regulation.1–8,29 Thus, it is very important to develop methods for sensitive and selective quantification of miRNAs. So far, the RT-qPCR is the most widely applied technique for miRNA quantification. However, the short length of miRNAs requires the use of extended primers. Current methods, both linear primers and nonlinear primers, have their inherent drawbacks. Here, we have developed a new method for the quantification of miRNAs, which is called linear-hairpin variable primer RT-qPCR. The key innovation of this method is the design of the novel linear-hairpin variable primer. The primer is initially designed to be linear, extending to form a hairpin structure and replacing the target for cyclic RT. Then the amplified and prolonged cDNA (RT product) is quantified by conventional EvaGreen based qPCR (Fig. 1).In this design, the variable primer maintained a linear state at the beginning, which could result in a very low fluorescence background if the double-stranded DNA sensitive dye EvaGreen was used in this case. After adding target miRNA, the linear primer turned into a hairpin structure, replacing the target for reuse (Fig. 2(b)), where one miRNA target could produce lots of prolonged cDNA, resulting in higher sensitivity. The results (Fig. 4) showed that we could detect as low as four target miRNA molecules, requiring only 10% amplified and prolonged cDNA (RT product) for downstream qPCR, which exhibited better sensitivity than the conventional RT-qPCR. By strategic design of the length of ‘a*’ and ‘b’ in the variable primer (loop and stem in the hairpin structure), the selectivity of the linear-hairpin variable primer RT-qPCR could be maximized, which is likely due to the spatial constraint of the hairpin structure and the base stacking.25 In addition, the intelligently designed RT primer enables a RT reaction at high temperature (42 °C), providing the optimum reaction temperature for the RT enzyme and ensuring the RT efficiency and specificity. The selectivity experimental results (Fig. 5) showed that this method could discriminate the target let-7d miRNAs among the let-7 miRNA family, in which the members of this family are highly similar, posing a major challenge for specific quantification. Furthermore, it is an important indicator of a miRNA detection method for distinguishing between the mature miRNAs and their precursors. Because the sequences of the precursors contain the mature miRNAs,30 RT-qPCR designed for mature RNA detection may also amplify their precursors. Usually, the precursors exist at much lower levels than the mature miRNAs in cells.31–34 In the scheme of the linear-hairpin variable primer RT-qPCR method, it can only detect the 5′-termini of the target sequence, instead of the intermediate sequence. Therefore, this method is specific for detecting mature miRNAs and excluding the precursors. The results of Fig. 5 show that the method could successfully distinguish between the mature let-7d and its corresponding precursor miRNA. In addition, the reliability of the method was proved on a biological sample by using commercially available TaqMan RT-qPCR assays (Fig. 6). However, a common fault of the target specific priming of RT is that each target needs a separate RT reaction. To solve the problem, multiplexing RT could be employed to simultaneously detect 8 miRNAs across 7 mouse tissues (Fig. 7), which achieved similar effects to the singleplex protocol. The multiplexing protocol could increase the throughput, reduce the sample amount, and simplify operations.
Overall, we have developed a new method, called linear-hairpin variable primer RT-qPCR, for amplified detection of 5′-termini of the target sequence. It combines numerous advantages of the linear primer and non-linear primer based RT-qPCR. As a demonstration, it successfully profiles miRNA expression in mouse tissues. We think that this method can contribute significantly to future advances in research of other small fragment RNAs.
Experimental section
Materials
All sequences used in this paper are listed in the ESI,† and were synthesized by Sangon Biotech Co., Ltd. (Shanghai, China). The Bst 2.0 WarmStartTM DNA polymerase (8 U μL−1) and related buffers were purchased from New England Biolabs. EvaGreen was purchased from Bridgen (Beijing, China). All other chemicals were of analytical grade and purchased from Sangon Biotech (Shanghai, China) unless otherwise indicated. Deionized water was obtained through a Nanopure Infinity ultrapure water system (Barnstead/thermolyne Corp, Dubuque, IA) and had an electric resistance >18.3 MW.Reverse transcriptase (RT) reactions
RT reactions were performed with a First Strand cDNA Synthesis Kit (MBI). The reaction mixture contains either 1.85 ng of total RNA or 1.5 nM synthetic miRNA template, 0.5 mM each of dNTPs, and 0.5 μL RT enzyme, 0.05 μM variable primer and 5 U RNase inhibitor. The 10 μL RT reactions were incubated in a T100 thermal cycler (Bio-Rad) for 45 min at 42 °C, 5 min at 85 °C and then held at 4 °C. Real-time monitoring of the RT process was performed at 42 °C on a CFX 96TM Real Time PCR detection system.Quantitative PCR
The real-time PCR was performed on a CFX 96TM Real Time PCR detection system (Bio-Rad CFX Manager3.0). The 25 μL PCR including 1× High Fidelity PCR Master Mix, 0.5× EvaGreen, 0.4 μM forward and reverse primer and the RT product was diluted at least 10×. The reactions were incubated in a 96-well plate at 94 °C for 4 min, followed by 50 cycles of 94 °C for 30 s and 56 °C for 30 s. The qPCR with hairpin miRNA assay was performed in almost the same manner as the reactions mentioned above with adding their respective primers. The qPCR with TaqMan miRNA assay was performed according to the manufacturers' protocols in a total reaction volume of 10 μL containing 1× TaqMan Fast qPCR Master Mix, 0.2 μM Taqman probe, 0.4 μM forward and reverse primer and the RT product diluted at least 10×. Reactions were incubated at 95 °C for 10 min, followed by 50 cycles of 95 °C for 15 s and 60 °C for 45 s. All reactions were run in triplicate.Gel electrophoresis
An 8% native PAGE gel was prepared using 1× TBE buffer (89 mM Tris Borate, 2.0 mM Na2EDTA, pH 8.3). The mixture of a 10 μL RT product for a variable primer or linear primer, 2 μL SABY Gold dye and 2 μL loading buffer were added to the glue hole. The gel was run at 120 V for 60 min in 1× TBE buffer. When bromophenol blue is added to 3/4 of the gel, electrophoresis was terminated, and finally the gel was photographed using a Bioanalytical Imaging system (Azure Biosystems, Inc, American). For denaturing PAGE, the 10 μL RT product was separated by electrophoresis through 8% polyacrylamide-7M urea gels. Bands were analyzed through the silver-staining method.MiRNA profiling in mouse tissues
All animal operations were in accord with institutional animal use and care regulations, according to protocol no. SYXK (Xiang) 2013-0001, approved by the Laboratory Animal Center of Hunan. Mouse tissue samples were dissected, placed into TRI Reagent, and immediately frozen on dry ice. Before use, the samples were thawed and homogenized using the Tissue Lyser and total RNA was extracted with TRI Reagent according to the manufacturer's protocol. Finally, adding 20 μL DEPC water to dissolve and total dilution RNA to 1 μg μL−1. RNA quantity and purity were assessed using a NanoDrop 2000 spectrophotometer (Thermo Fisher).Conflicts of interest
There are no conflicts to declare.Acknowledgements
This work was supported by the National Natural Science Foundation of China (21275043, 21735002, 21874036, and 21874038).Notes and references
- V. Ambros, Nature, 2004, 431, 350–355 CrossRef CAS PubMed.
- D. P. Bartel, Cell, 2004, 116, 281–297 CrossRef CAS PubMed.
- D. P. Bartel, Cell, 2009, 136, 215–233 CrossRef CAS PubMed.
- J. Rossi, Cell, 2009, 137, 990–992 CrossRef CAS PubMed.
- C. Arenz, Angew. Chem., Int. Ed., 2006, 45, 5048–5050 CrossRef CAS.
- C. Jay, J. Nemunaitis, P. Chen, P. Fulgham and A. W. Tong, DNA Cell Biol., 2007, 26, 293–300 CrossRef CAS.
- M. V. Iorio, P. Casalini, E. Tagliabue, S. Menard and C. M. Croce, Eur. J. Cancer, 2008, 44, 2753–2759 CrossRef CAS PubMed.
- Y. He, J. Lin, D. Kong, M. Huang, C. Xu, T. K. Kim, A. Etheridge, Y. Luo, Y. Ding and K. Wang, Clin. Chem., 2015, 61, 1138–1155 CrossRef CAS PubMed.
- G. S. Pall, C. Codony-Servat, J. Byrne, L. Ritchie and A. Hamilton, Nucleic Acids Res., 2007, 35, e60 CrossRef PubMed.
- S. C. Chapin, D. C. Appleyard, D. C. Pregibon and P. S. Doyle, Angew. Chem., Int. Ed., 2011, 50, 2289–2293 CrossRef CAS PubMed.
- S. Aldridge and J. Hadfield, Methods Mol. Biol., 2012, 822, 19–31 CrossRef CAS PubMed.
- R. Deng, K. Zhang and J. Li, Acc. Chem. Res., 2017, 50, 1059–1068 CrossRef CAS PubMed.
- Y. Yang, J. Huang, X. Yang, X. He, K. Quan, N. Xie, M. Ou and K. Wang, Anal. Chem., 2017, 89, 5850–5856 CrossRef CAS.
- Y. Wu, J. Huang, X. Yang, Y. Yang, K. Quan, N. Xie, J. Li, C. Ma and K. Wang, Anal. Chem., 2017, 89, 8377–8383 CrossRef CAS PubMed.
- R. Deng, L. Tang, Q. Tian, Y. Wang, L. Lin and J. Li, Angew. Chem., Int. Ed., 2014, 53, 2389–2393 CrossRef CAS PubMed.
- L. Wang, R. Deng and J. Li, Chem. Sci., 2015, 6, 6777–6782 RSC.
- R. Deng, K. Zhang, Y. Sun, X. Ren and J. Li, Chem. Sci., 2017, 8, 3668–3675 RSC.
- X. Ren, R. Deng, L. Wang, K. Zhang and J. Li, Chem. Sci., 2017, 8, 5692–5698 RSC.
- I. Balcells, S. Cirera and P. K. Bush, BMC Biotechnol., 2011, 11, 70 CrossRef CAS PubMed.
- Q. Mei, X. Li, Y. Meng, Z. Wu, M. Guo, Y. Zhao, X. Fu and W. Han, PLoS One, 2012, 7, e46890 CrossRef CAS PubMed.
- V. Benes, P. Collier, C. Kordes, J. Stolte, T. Rausch, M. U. Muckentaler, D. Haussinger and M. Castoldi, Sci. Rep., 2015, 5, 11590 CrossRef CAS PubMed.
- C. K. Raymond, B. S. Roberts, P. Garrett-Engele, L. P. Lim and J. M. Johnson, RNA, 2005, 11, 1737–1744 CrossRef CAS.
- S. Sharbati-Tehrani, B. Kutz-Lohroff, R. Bergbauer, J. Scholven and R. Einspanier, BMC Mol. Biol., 2008, 9, 34 CrossRef PubMed.
- T. Huang, J. Yang, G. Liu, W. Jin, Z. Liu, S. Zhao and M. Yao, PloS One, 2015, 10, e0120160 CrossRef PubMed.
- C. Chen, D. A. Ridzon, A. J. Broomer, Z. Zhou, D. H. Lee, J. T. Nguyen, M. Barbisin, N. L. Xu, V. R. Mahuvakar and M. R. Andersen, Nucleic Acids Res., 2005, 33, e179 CrossRef PubMed.
- P. Androvic, L. Valihrach, J. Elling, R. Sjoback and M. Kubista, Nucleic Acids Res., 2017, 45, e144 CrossRef.
- A. Forootan, R. Sjoback, J. Bjorkman, B. Sjogreen, L. Linz and M. Kubista, Biomol. Detect. Quantif., 2017, 12, 1–6 CrossRef CAS PubMed.
- Y. Liang, D. Ridzon, L. Wong and C. Chen, BMC Genomics, 2007, 8, 166 CrossRef PubMed.
- L. He and G. J. Hannon, Nat. Rev. Genet., 2004, 5, 522–531 CrossRef CAS PubMed.
- V. N. Kim, J. Han and M. C. Siomi, Nat. Rev. Mol. Cell Biol., 2009, 10, 126–139 CrossRef CAS PubMed.
- T. D. Schmittgen, E. J. Lee, J. Jiang, A. Sarkar, L. Yang, T. S. Elton and C. Chen, Methods, 2008, 44, 31–38 CrossRef CAS PubMed.
- L. Gan and B. Denecke, Microarrays, 2013, 2, 24–33 CrossRef CAS PubMed.
- N. Li, X. You, T. Chen, S. D. Mackowiak, M. R. Friedlander, M. Weigt, H. Du, A. Gogol-Doring, Z. Chang and C. Dieterich, et al. , Nucleic Acids Res., 2013, 41, 3619–3634 CrossRef CAS PubMed.
- O. R. Faridani, I. Abdullayev, M. Hagemann-Jensen, J. P. Schell, F. Lanner and R. Sandberg, Nat. Biotechnol., 2016, 34, 1264–1266 CrossRef CAS PubMed.
Footnote |
| † Electronic supplementary information (ESI) available. See DOI: 10.1039/c8sc04621b |
| This journal is © The Royal Society of Chemistry 2019 |