DOI:
10.1039/C8SC03917H
(Edge Article)
Chem. Sci., 2019,
10, 879-883
Two-photon fluorescence imaging reveals a Golgi apparatus superoxide anion-mediated hepatic ischaemia-reperfusion signalling pathway†
Received
3rd September 2018
, Accepted 1st November 2018
First published on 6th November 2018
Abstract
Hepatic ischaemia-reperfusion (IR) injury is mainly attributed to a burst of reactive oxygen species (ROS) that attack biological macromolecules and lead to cell death. The superoxide anion (O2˙−) is the first ROS to be generated and triggers the production of other ROS; thus, explorations of the role of O2˙− in the IR process are meaningful. Meanwhile, the Golgi apparatus generates O2˙−via Golgi-associated proteins, which might play an essential role in IR injury. However, the molecular mechanism by which O2˙− from the Golgi apparatus regulates hepatic IR injury is unclear. Therefore, to solve this problem, a two-photon (TP) excited fluorescence probe (CCA) was designed and prepared for the reversible detection of O2˙− in the Golgi apparatus. With the assistance of TP fluorescence microscopy, we observed a substantial increase in the levels of O2˙− in the Golgi apparatus of an IR mouse liver for the first time, as well as increased caspase-2 activity and apoptosis. Furthermore, we found that the tumour necrosis factor (TNF-α) functions as a positive mediator of O2˙− generation. Based on these data, we identified the potential signalling pathway in the Golgi that mediates O2˙− fluctuations in IR mice and revealed the related molecular mechanisms; we also provide a new target for treating IR injury.
Introduction
An interruption in hepatic blood flow is an inherent phenomenon during diverse types of hepatic surgery.1 Once the blood flow and oxygen supply are restored, the liver is subjected to a further insult, aggravating the injury.2 Hepatic ischaemia reperfusion (IR) injury is attributed to the damage caused by reactive oxygen species (ROS),3 such as the superoxide anion (O2˙−),4,5 hydrogen peroxide (H2O2),6 and peroxynitrite (ONOO−).7 Because the superoxide anion (O2˙−) is the first ROS to be generated and can trigger and regulate the production of other ROS,8 explorations of the role of O2˙− in the IR process are meaningful.
The Golgi apparatus is an important organelle responsible for protein processing, classification and packaging, thus maintaining the normal function and survival of cells.9 Meanwhile, the Golgi apparatus generates O2˙−via Golgi-associated proteins such as NOS10 and releases O2˙− when it catalyses reactions with substrate molecules. Under normal circumstances, the low levels of O2˙− in the Golgi body is catalytically transformed to H2O2 by SOD, which acts as a second messenger. However, when the body is subjected to IR, the O2˙− levels fluctuate abnormally, leading to an imbalanced redox state in the Golgi body. More likely, these unbalanced Golgi O2˙− levels directly participate in IR injury. However, the number of studies focusing on the relationship between O2˙− levels in the Golgi apparatus and IR injury is limited, although some studies have referred to mitochondrial O2˙− fluctuations during IR.11 Therefore, an accurate analysis of the changes in Golgi O2˙− levels and their effects on the process of IR injury will provide a more comprehensive understanding of pathogenesis, which can assist with the identification of a target for the treatment of this disease. However, the main obstacle is the lack of ideal analytical tools.
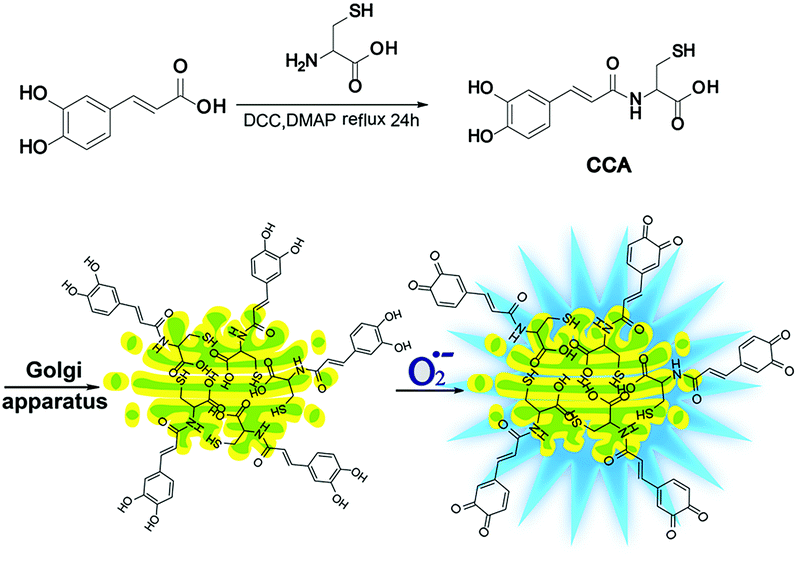
Fluorescence microscopy techniques offer many benefits12–24 and are ideal methods for detecting Golgi O2˙− levels.25–29 Fluorescent probes designed to detect O2˙− levels in the Golgi apparatus are rare. Therefore, we designed and synthesized a new O2˙− two-photon fluorescence probe that targets the Golgi and dynamically and reversibly detects O2˙− levels (cis-caffeic acid, CCA, Scheme 1). The CCA probe was designed using the following strategy: 1, a caffeic acid group for detecting the dynamic responses of O2˙− that displays blue fluorescence; and 2, an L-cysteine group for targeting the Golgi apparatus.30 Because Golgi apparatus contains many receptors for the cysteine residues or cysteine rich region.32,33 So L-cysteine is more easily to anchor in Golgi apparatus. Furthermore, the Huang group31 has been proved that probe with L-cysteine could targeting Golgi apparatus. With the aid of two-photon fluorescence microscopy, we detected Golgi O2˙− fluctuations in IR mice. We also used this approach to study related signalling pathways and illuminate the molecular mechanism by which O2˙− regulates IR.
 |
| | Scheme 1 The synthesis and luminescence mechanism of CCA. | |
Results and discussion
The synthesis and properties of CCA
CCA was constructed with an amido linkage between the caffeic acid group and L-cysteine (ESI†). According to the probe design strategy, the blue fluorescence (495 nm) was dramatically increased with the addition of O2˙− (Fig. 1A, fluorescence quantum yield = 0.21). Two-photon excited fluorescence responses to O2˙− were identical (Fig. S1,† two-photon absorption cross section = 38.7 GM). Fig. 1A and B also illustrate the linear relationship between the fluorescence intensity ratio and [O2˙−] in a wide range of 0–5 μM. The linear equation was F = 1621.514 [O2˙−] (μM) + 631.98, with a linear correlation coefficient of 0.991 and a detection limit of 18 nM. Collectively, CCA potentially possessed the ability to detect O2˙−, as determined by the blue fluorescence intensity.
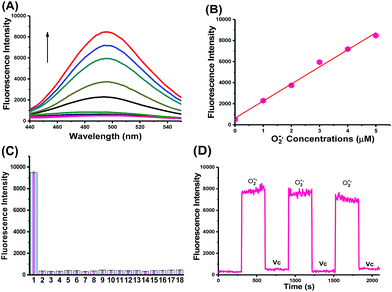 |
| | Fig. 1 Fluorescence properties of the CCA probe for O2˙− detection. (A) One-photon fluorescence spectra of 10 μM CCA after the addition of various concentrations of O2˙− (0–5 μM). (B) A linear correlation between the ratio of the fluorescence intensity and O2˙− concentrations. (C) Fluorescence responses of 10 μM CCA to various reactive oxygen species, reactive nitrogen species and metals (5 μM O2˙−, 20 μM GSH, 100 μM TBHP, 10 mM H2O2, 1 μM 1O2, 1 μM ·OH, 2 μM ONOO−, 50 μM NO, 100 μM NaClO, 10 mM Na+, 10 mM K+, 500 μM Ca2+, 500 μM Zn2+, 500 μM Fe2+, 500 μM Fe3+, 20 μM Cu2+ and 20 μM Cu+). (D) Reversibility of CCA fluorescence in the presence of alternating treatments with 5 μM O2˙− and 0.5 mM ascorbic acid (Vc). All one-photon spectra were acquired in cell extracts at λex = 370 nm and λem = 490 nm. | |
Next, we examined the selectivity of CCA for O2˙− under simulated physiological conditions.33,34 The fluorescence responses of CCA to competing ROS, reactive nitrogen species (RNS) and metal ions are shown in Fig. 1C, S2 and S3.† As expected, CCA exhibited high selectivity for O2˙−. The pH titration experiment revealed that the CCA fluorescence intensity was basically maintained at a constant value at pH 4.0–9.0. Based on these findings, CCA exclusively captures O2˙− levels in living cells. Additionally, CCA possesses more advantages, including a fast fluorescence response to O2˙−, reversible detection of O2˙− and ascorbic acid (Vc) and no marked cytotoxicity at concentrations less than 5.13 mM (Fig. 1D, S4 and S5†). Thus, CCA can serve as a robust sensor to achieve dynamic fluorescence imaging of O2˙−.
Validation of CCA for the imaging of living cells
The utility of CCA for fluorescence imaging in living cells was evaluated. We used 2-methoxyestradiol35,36 (2-ME, 1.0 μg mL−1) to inhibit both copper–zinc and manganese superoxide dismutases and determine the resulting increase in O2˙− concentrations, and Vc was to induce the reduction reaction of the CCA product in hepatocytes. As illustrated in Fig. 2, strong blue fluorescence was observed in hepatocytes treated with 2-ME compared with the control cells, indicating significantly increased O2˙− concentrations. After the addition of 1.0 mM Vc to these cells, the fluorescence ratio decreased immediately, indicating redox reversibility. Furthermore, other reversible fluorescence changes were observed following successive treatments with 2-ME and Vc. We specifically reduced O2˙− levels using the O2˙− scavenger Tiron (10 μM) to further confirm the selectivity of CCA for O2˙− in living cells.37Fig. 2 shows weak fluorescence in hepatocytes treated with Tiron. Thus, the blue fluorescence of CCA changes according to the O2˙− fluctuations. Based on these results, CCA selectively and reversibly responds to O2˙− at the cellular level.
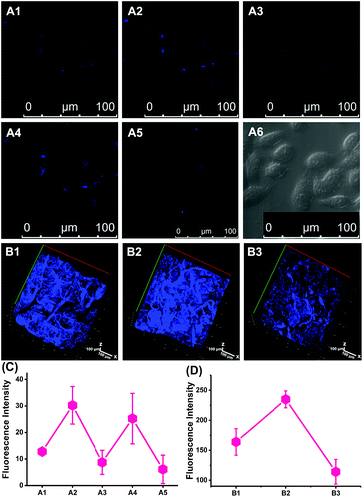 |
| | Fig. 2 TP fluorescence imaging of O2˙− levels in hepatocytes and in mice. (A) Hepatic cells shown in (A1) were incubated with 10 μM CCA for 10 min. (A2) Cells shown in (A1) were stimulated with 1.0 μg mL−1 2-methoxyestradiol (2-ME). (A3) Cells shown in (A2) were treated with 1.0 mM Vc. (A4) Cells shown in (A3) were stimulated with 1.0 μg mL−1 2-ME again. (A5) Cells were loaded with 10 μM Tiron 30 min before the addition of CCA. (A6) Bright field images. (B) In vivo 3D images of normal animals (B1), 2-ME stimulated mice (B2) and Tiron-treated mice following an injection of 10 μM CCA. (C) The average fluorescence intensity output of (A). (D) The average fluorescence intensity output of (B). Images were acquired at an excitation wavelength of 800 nm and emission wavelengths corresponding to the blue channel of 430–530 nm. | |
Validation of CCA for the imaging of mice
Next, we performed in vivo imaging of O2˙− levels in mice based on the favourable two-photon excited fluorescence properties of CCA. Consistent with the design used for cellular imaging, we used 2-ME and Tiron to increase or decrease the O2˙− concentrations. As shown in Fig. 2B, more intense blue fluorescence was observed in mice treated with 2-ME and weak fluorescence was observed in mice treated with Tiron compared with the normal group, indicating an increase or decrease in O2˙− concentrations, respectively. Thus, CCA visualized O2˙− fluctuations in small animals and achieved imaging at relatively deep levels in the tissue (depth = 350 μm).
Golgi apparatus localization of CCA
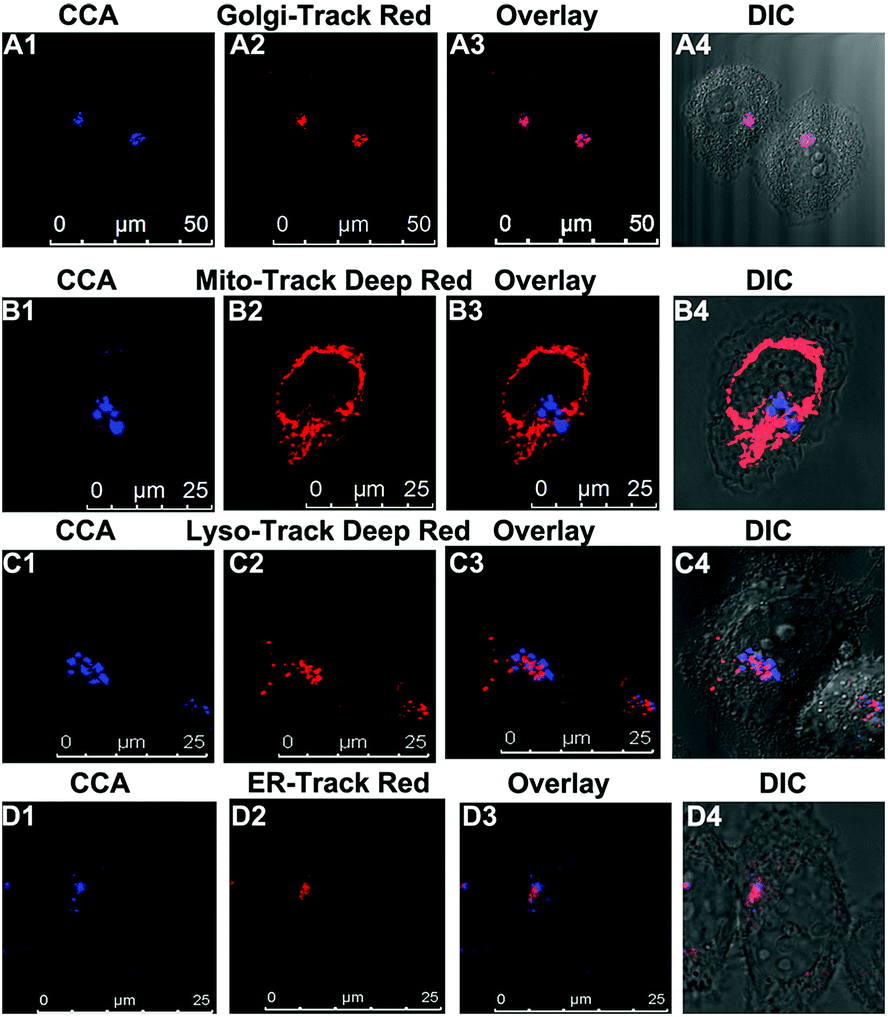
We performed an imaging experiment to determine whether CCA specifically targeted the Golgi apparatus. 2-ME stimulated hepatocytes were co-cultured with CCA and various commercial organelle dyes, including Golgi-Track Red,38 Mito-Tracker Deep Red, Lyso-Tracker Deep Red and ER-Tracker Red. The overlapped fluorescence images in Fig. 3A indicated that CCA fluorescence merged well with that of Golgi-Track Red and Pearson's colocalization coefficient was 0.93.39 In contrast, CCA displayed almost no fluorescence inside the mitochondria (Fig. 3B, colocalization coefficient 0.15), lysosomes (Fig. 3C, colocalization coefficient 0.25) and endoplasmic reticulum (Fig. 3D, colocalization coefficient 0.24). These data provide strong evidence that the probe predominantly accumulates in the Golgi apparatus and reflects the Golgi O2˙− level.
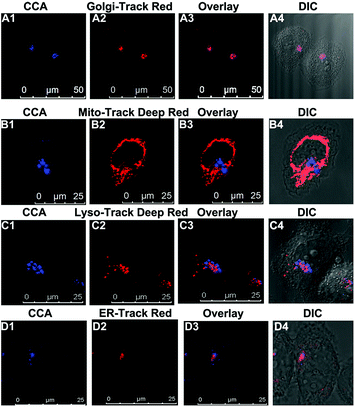 |
| | Fig. 3 Images of the intracellular localization and Golgi apparatus-targeting capability of CCA. Hepatic cells were co-cultured with 2-ME (1.0 μg mL−1), CCA (10 μM, λex = 405 and λem = 430–550 nm) and organelle dyes, including Golgi-Track Red (50 nM, λex = 561 nm and λem = 600–750 nm), Mito-Tracker Deep Red (100 nM, λex = 633 nm and λem = 650–740 nm), Lyso-Tracker Deep Red (100 nM, λex = 633 nm and λem = 650–740 nm) and ER-Tracker Red (500 nM, λex = 561 nm and λem = 580–630 nm). | |
Increased O2˙− levels in the Golgi apparatus of IR cells and mice
We established IR cell and mouse models by simulating liver surgery.40,41 With the assistance of two-photon fluorescence microscopy, we imaged O2˙− fluctuations in the Golgi apparatus of IR cells and mice. As shown in Fig. 4, IR groups exhibited strong blue fluorescence compared with normal groups of both living cells and mice in vivo, indicating that IR increased O2˙− levels in the Golgi apparatus. We are the first to discover the connection between the IR process and Golgi O2˙− levels in living cells and in vivo.
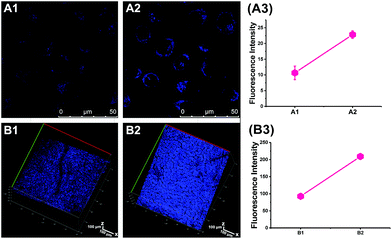 |
| | Fig. 4 Increased O2˙− levels in IR cells and mice. (A) The normal (A1) and IR hepatic (A2) cells were loaded with 10 μM CCA for blue fluorescence imaging, and (A3) shows the average fluorescence intensity output of (A). (B) The in vivo 3D images of normal (B1) and IR mice (B2) injected with 10 μM CCA for blue fluorescence imaging are shown, and (B3) shows the average fluorescence intensity output of (B). Images were acquired at an excitation wavelength of 800 nm and emission wavelengths corresponding to the blue channel of 430–530 nm. | |
Increased O2˙− levels in the Golgi apparatus induced apoptosis
We next investigated the influence of excess O2˙− levels in the Golgi apparatus on the levels of the pro-apoptotic protein caspase-2 and cell survival in IR hepatocytes. In Fig. 5A, high levels of O2˙− in the Golgi increased the caspase-2 level and low Golgi O2˙− levels decreased the caspase-2 level. Furthermore, excess O2˙− induced apoptosis, as evidenced by the results of the flow cytometry experiment presented in Fig. 5B. Correspondingly, decreased O2˙− levels with Tiron (10 μM) could inhibit apoptosis. Based on these data, excess O2˙− levels in the Golgi apparatus provide a signal to increase caspase 2 levels and apoptosis.
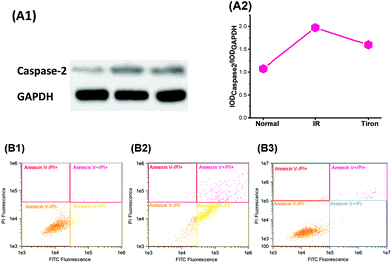 |
| | Fig. 5 Increased Golgi O2˙− levels, caspase-2 levels and apoptosis in IR cells. (A1) Western blot showing caspase-2 levels in normal cells, IR hepatic cells and 10 μM Tiron-treated cells. (A2) The average intensity output of the cells shown in (A1). (B) Flow cytometry analysis of normal cells (B1), IR hepatic cells (B2) and IR cells with 10 μM Tiron (B3). | |
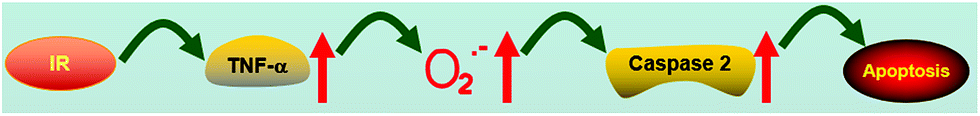
TNF-α induced O2˙− generation in the Golgi apparatus
TNF-α plays an important role in hepatic IR injury.42 Therefore, we explored the relationship between TNF-α and Golgi O2˙− levels. In Fig. S6 and S7,† we observed higher levels of TNF-α in IR cells compared with normal cells (TNF-α kit) and high Golgi O2˙− concentrations. After the addition of a TNF-α inhibitor (100 μg mL−1 silymarin),43 the blue fluorescence of IR cells changed slightly, indicating that TNF-α inhibition decreased Golgi O2˙− levels in IR cells comparing with cells in which TNF-α was not inhibited. Thus, TNF-α was located upstream of O2˙− generation in the Golgi apparatus and the signal for IR injury is TNF-α-O2˙−-caspase 2-apoptosis (Fig. 6).
 |
| | Fig. 6 Model for the signalling role of O2˙− in IR cells and mice. | |
Conclusions
We developed a two-photon fluorescence probe for the dynamic and reversible detection of O2˙− levels in the Golgi apparatus and to determine the relationship between Golgi O2˙− levels and IR injury. Using two-photon fluorescence microscopy, we imaged excess O2˙− levels in the Golgi apparatus and studied the connections between TNF-α, O2˙− and caspase-2. Furthermore, we provided a potential mechanism of the signal transduction pathway mediated by Golgi O2˙− during the IR process, which provides new insights into potential treatments for hepatic IR injury.
Conflicts of interest
There are no conflicts to declare.
Acknowledgements
This work was supported by the National Natural Science Foundation of China (21535004, 91753111, 21705100, 21675105, 21475079 and 21390411), National Major Scientific and Technological Special Project for “Significant New Drugs Development” (2017ZX09301030004), Key Research and Development Program of Shandong Province (2018YFJH0502), Natural Science Foundation of Shandong Province (ZR2017BB066 and ZR2017ZC0225) and a project of Shandong Province Higher Educational Science and Technology Program (J16LC09).
Notes and references
- F. Serracinoinglott, N. A. Habib and R. T. Mathie, Am. J. Surg., 2001, 181, 160–166 CrossRef CAS.
- R. A. Gottlieb, K. O. Burleson, R. A. Kloner, B. M. Babior and R. L. Engler, J. Clin. Invest., 1994, 94, 1621–1628 CrossRef CAS PubMed.
- T. H. Sanderson, C. A. Reynolds, R. Kumar, K. Przyklenk and M. Huettemann, Mol. Neurobiol., 2013, 47, 9–23 CrossRef CAS PubMed.
- A. Koo, H. Komatsu, G. Tao, M. Inoue, P. H. Guth and N. Kaplowitz, Hepatology, 2010, 15, 507–514 CrossRef.
- W. Zhang, P. Li, F. Yang, X. Hu, C. Sun, W. Zhang, D. Chen and B. Tang, J. Am. Chem. Soc., 2013, 135, 14956–14959 CrossRef CAS PubMed.
- B. González-Flecha, J. C. Cutrin and A. Boveris, J. Clin. Invest., 1993, 91, 456–464 CrossRef PubMed.
- C. Szabo, Shock, 1996, 6, 79–88 CrossRef CAS PubMed.
- B. C. Dickinson and C. J. Chang, Nat. Chem. Biol., 2011, 7, 504–511 CrossRef CAS PubMed.
- S. Munro, Trends Cell Biol., 1998, 8, 11–15 CrossRef CAS PubMed.
- T. J. Guzik, R. Korbut and T. Adamekguzik, J. Physiol. Pharmacol., 2003, 54, 469–487 CAS.
- E. T. Chouchani, V. R. Pell, A. M. James, L. M. Work, K. Saeb-Parsy, C. Frezza, T. Krieg and M. P. Murphy, Cell Metab., 2016, 23, 254–263 CrossRef CAS PubMed.
- P. Zhang, X. X. Yang, Y. Wang, N. W. Zhao and C. Z. Huang, Nanoscale, 2014, 6, 2261–2269 RSC.
- J. V. Frangioni, Curr. Opin. Chem. Biol., 2003, 7, 626–634 CrossRef CAS PubMed.
- X. Chen, X. Tian, I. Shin and J. Yoon, Chem. Soc. Rev., 2011, 40, 4783–4804 RSC.
- J. Du, M. Hu, J. Fan and X. Peng, Chem. Soc. Rev., 2012, 41, 4511 RSC.
- H.-W. Liu, K. Li, X.-X. Hu, L. Zhu, Q. Rong, Y. Liu, X.-B. Zhang, J. Hasserodt, F.-L. Qu and W. Tan, Angew. Chem., 2017, 129, 11950–11954 CrossRef.
- H. K. Kim, J. Liu, J. Li, N. Nagraj, M. Li, C. M. Pavot and Y. Lu, J. Am. Chem. Soc., 2007, 129, 6896–6902 CrossRef CAS PubMed.
- F. Helmchen and W. Denk, Nat. Methods, 2005, 2, 932–940 CrossRef CAS PubMed.
- W. Zhang, X. Wang, P. Li, H. Xiao, W. Zhang, H. Wang and B. Tang, Anal. Chem., 2017, 89, 6840–6845 CrossRef CAS PubMed.
- L. Zhou, X. Zhang, Q. Wang, Y. Lv, G. Mao, A. Luo, Y. Wu, Y. Wu, J. Zhang and W. Tan, J. Am. Chem. Soc., 2014, 136, 9838–9841 CrossRef CAS PubMed.
- X. Chen, F. Wang, J. Y. Hyun, T. Wei, J. Qiang, X. Ren, I. Shin and J. Yoon, Chem. Soc. Rev., 2016, 45, 2976–3016 RSC.
- H.-W. Liu, L. Chen, C. Xu, Z. Li, H. Zhang, X.-B. Zhang and W. Tan, Chem. Soc. Rev., 2018, 47, 7140–7180 RSC.
- G. Mao, T. Wei, X. Wang, S. Huan, D. Lu, J. Zhang, X. Zhang, W. Tan, G. Shen and R. Yu, Anal. Chem., 2013, 85, 7875–7881 CrossRef CAS PubMed.
- W. Zhang, X. Wang, P. Li, H. Xiao, W. Zhang, H. Wang and B. Tang, Anal. Chem., 2017, 89, 6840–6845 CrossRef CAS PubMed.
- W. Zhang, P. Li, F. Yang, X. F. Hu, C. Z. Sun, W. Zhang, D. Z. Chen and B. Tang, J. Am. Chem. Soc., 2013, 135, 14956–14959 CrossRef CAS PubMed.
- P. Li, W. Zhang, K. Li, X. Liu, H. Xiao, W. Zhang and B. Tang, Anal. Chem., 2013, 85, 9877–9881 CrossRef CAS PubMed.
- P. Li, L. Liu, H. Xiao, W. Zhang, L. Wang and B. Tang, J. Am. Chem. Soc., 2016, 138, 2893–2896 CrossRef CAS PubMed.
- X. Gao, C. Ding, A. Zhu and Y. Tian, Anal. Chem., 2014, 86, 7071–7078 CrossRef CAS PubMed.
- J. J. Hu, N.-K. Wong, S. Ye, X. Chen, M.-Y. Lu, A. Q. Zhao, Y. Guo, A. C.-H. Ma, A. Y.-H. Leung, J. Shen and D. Yang, J. Am. Chem. Soc., 2015, 137, 6837–6843 CrossRef CAS PubMed.
- R. S. Li, P. F. Gao, H. Z. Zhang, L. L. Zheng, C. M. Li, J. Wang, Y. F. Li, F. Liu, N. Li and C. Z. Huang, Chem. Sci., 2017, 8, 6829–6835 RSC.
- D. Aoki, N. Lee, N. Yamaguchi, C. Dubois and M. N. Fukuda, Proc. Natl. Acad. Sci. U. S. A., 1992, 89, 4319–4323 CrossRef CAS.
- Y. Maeda, G. V. Beznoussenko, J. Van Lint, A. A. Mironov and V. Malhotra, EMBO J., 2001, 20, 5982–5990 CrossRef CAS PubMed.
- H. Maeda, K. Yamamoto, Y. Nomura, I. Kohno, L. Hafsi, N. Ueda, S. Yoshida, M. Fukuda, Y. Fukuyasu and Y. Yamauchi, J. Am. Chem. Soc., 2005, 127, 68–69 CrossRef CAS PubMed.
- D. Oushiki, H. Kojima, T. Terai, M. Arita, K. Hanaoka, Y. Urano and T. Nagano, J. Am. Chem. Soc., 2010, 132, 2795–2801 CrossRef CAS PubMed.
- P. Huang, L. Feng, E. A. Oldham, M. J. Keating and W. Plunkett, Nature, 2000, 407, 390 CrossRef CAS PubMed.
- Y. Zhou, E. O. Hileman, W. Plunkett, M. J. Keating and P. Huang, Blood, 2003, 101, 4098–4104 CrossRef CAS PubMed.
- Y. Du, C. M. Miller and T. S. Kern, Free Radical Biol. Med., 2003, 35, 1491–1499 CrossRef CAS PubMed.
- M. Y. Chang, A. L. Shiau, Y. H. Chen, C. J. Chang, H. W. Chen and C. L. Wu, Cancer Sci., 2008, 99, 1479–1484 CrossRef CAS PubMed.
- J. Adler and I. Parmryd, Cytometry, Part A, 2010, 77, 733–742 CrossRef PubMed.
- R. Liu, L. Zhang, X. Lan, L. Li, T. T. Zhang, J. H. Sun and G. H. Du, Neuroscience, 2011, 176, 408–419 CrossRef CAS PubMed.
- S. Thiberge, S. Blazquez, P. Baldacci, O. Renaud, S. Shorte, R. Ménard and R. Amino, Nat. Protoc., 2007, 2, 1811–1818 CrossRef CAS PubMed.
- M. Serteser, T. Koken, A. Kahraman, K. Yilmaz, G. Akbulut and O. N. Dilek, J. Surg. Res., 2002, 107, 234–240 CrossRef CAS PubMed.
- X. Zi, H. Mukhtar and R. Agarwal, Biochem. Biophys. Res. Commun., 1997, 239, 334–339 CrossRef CAS PubMed.
Footnotes |
| † Electronic supplementary information (ESI) available. See DOI: 10.1039/c8sc03917h |
| ‡ These authors contributed equally to this work. |
|
| This journal is © The Royal Society of Chemistry 2019 |
Click here to see how this site uses Cookies. View our privacy policy here. 
 Open Access Article
 This Open Access Article is licensed under a Creative Commons Attribution-Non Commercial 3.0 Unported Licence
 *
*