 Open Access Article
Lysosome-targeted photoactivation reveals local sphingosine metabolism signatures†
Suihan
Feng
 a,
Takeshi
Harayama
 a,
Dalu
Chang
b,
J. Thomas
Hannich
 a,
Nicolas
Winssinger
 b and
Howard
Riezman
 *a
*a
aDepartment of Biochemistry, NCCR Chemical Biology, University of Geneva, Quai Ernest-Ansermet 30, 1211, Geneva, Switzerland. E-mail: howard.riezman@unige.ch
bDepartment of Organic Chemistry, NCCR Chemical Biology, University of Geneva, Quai Ernest-Ansermet 30, 1211, Geneva, Switzerland
First published on 26th December 2018
Abstract
Lipids are essential components of eukaryotic cell membranes and play crucial roles in cellular signaling and metabolism. While increasing evidence shows that the activities of lipids are dependent upon subcellular localization, tools to study local lipid metabolism and signaling are limited. Herein, we report an approach that enabled us to selectively deliver photo-caged lipids into lysosomes and thereafter to quickly release the lipid molecules by illumination. On combining this method with genetic techniques and lipidomics, we were able to investigate the localization-dependent metabolism of an important intermediate of sphingolipid metabolism, sphingosine. Our data reveal a distinct metabolic pattern of lysosomal sphingosine. In general, this method has the potential to serve as a platform to study lysosomal metabolism and signaling of various lipids and metabolites in living cells.
Introduction
Many lipid molecules are metabolic intermediates in lipid metabolic pathways, but they are also second messengers and essential components of cell signaling networks, involved in a variety of physiological and pathological processes. A comprehensive understanding of their activities often requires quantitative analysis of a large number of relevant lipid molecules in a metabolic pathway by mass spectrometry. To this end, we have previously established an unbiased systematic lipidomics approach in combination with gene deletions, which was used to identify novel regulatory mechanisms in yeast cells and show that lipid profiles are indicative of genetic makeup.1 While removing key metabolic enzymes can dramatically alter specific lipid levels and thus serve as a powerful approach, it lacks temporal resolution and is not suitable for controlling signaling lipids which are transiently produced and have very short half-lives. In addition, these mutants generally affect whole classes of lipids rather than individual species.To quickly generate signaling lipids in living cells, photoactivation (“uncaging”) has been introduced into the lipid field, which can release a large number of lipid molecules to trigger specific lipid-mediated signaling pathways.2 Typically, a photo-cleavable protecting group is pre-installed on the head group of a lipid molecule to block its activity. Once in the cells, UV illumination quickly removes the photo-protecting group and thereby releases the lipid messenger in a non-invasive manner. Due to the usefulness of the high temporal resolution obtained by uncaging, a number of lipids have been successfully caged using this technology.3–6 In a complementary strategy, photoswitchable lipid analogues have been used to artificially manipulate lipid activities but may require mechanistic knowledge of protein–lipid interactions, and the metabolism may be compromised due to the structural differences with the native lipid.7,8 Surprisingly, most of these chemical tools were developed to explore the signaling functions of lipids rather than studying lipid metabolism.
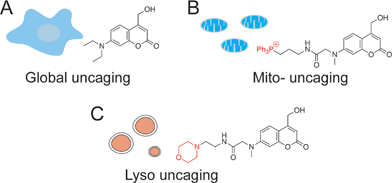
In addition to the temporal resolution that is essential to study lipid signaling and metabolism, lipid functions are also highly associated with subcellular localization. However, most caged lipids lack subcellular specificity. In order to dissect the compartmentalized lipid metabolism, we have developed a mitochondria-specific photoactivation method, which allowed us to monitor mitochondrial sphingosine metabolism and signaling in living cells directly (Fig. 1B).9 We have provided experimental evidence that lipid metabolism is highly dependent on the subcellular localization. Further understanding of local lipid metabolism requires novel tools that can release lipids in various organelles and other locations in cells.
Among the membrane-bound organelles, lysosomes are acidic compartments with the primary role of mediating the catabolism of proteins, polysaccharides, and complex lipids. They are highly dynamic and are involved in membrane trafficking including secretion, endocytosis, phagocytosis, and autophagy. Since lysosomes are the central hubs of macromolecule degradation, their activities are tightly regulated by the nutrient status and cellular signaling.10 Conversely, lysosomal dysfunction is responsible for a wide range of diseases that show abnormal accumulation of metabolites. For example, Niemann–Pick type C1 (NPC1) disease is a neurodegenerative lysosomal storage disorder, where sphingosine, cholesterol, and other lipids have been found to accumulate inside the acidic stores of cells.11
To systematically investigate the local lipid metabolism, we introduce here a lysosome-targeted photoactivation method by coupling the coumarin molecule to a morpholino group (Fig. 1C). In this way, we were able to accumulate caged sphingosine and cholesterol inside lysosomes in living cells. More importantly, use of an isotope labeled D7-sphingosine allowed us to track its conversion to ceramides in living cells. By combining this method with CRISPR/Cas9 genome modification we can directly compare the metabolic fate of sphingosine that was released from distinct subcellular locations.
Results and discussion
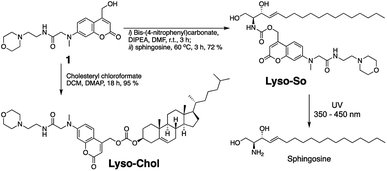
Replacing the triphenylphosphonium cation with a morpholino substituent (Scheme 1) on the alkyl chain protruding from the 7-amino group of coumarin led to our target compound 1. Coupling to sphingosine using previously described protocols afforded Lyso-So.9 Lyso-Chol was conveniently synthesized by coupling 1 with cholesteryl chloroformate. Our data show that, upon UV illumination, Lyso-So was quickly uncaged to give free sphingosine within two minutes. Similar results were also observed for Lyso-Chol (Fig. S1†).Next, we sought to determine the subcellular localization of the lyso-caged compounds in living cells. Using HeLa cells, we incubated the Lyso-So (5 μM) together with LysoTracker for 15 min and washed. The fluorescence staining of Lyso-So overlaps well with the LysoTracker, indicating that the Lyso-So is mainly targeted to the lysosomes in living cells (Fig. 2). Lysosomes maintain acidic environments between pH 4 and pH 5. To test whether the fluorescence of the coumarin-based probes is pH sensitive, we measured the fluorescence intensity of Lyso-So in different pH buffers and found that the fluorescence was only slightly increased at pH 4.0 (Fig. S2†). Therefore, this small difference cannot account for the increased fluorescence intensity from the lysosomes in the living cells and we confirm that most of the Lyso-So is co-localized well with LysoTracker (Fig. 2B and C). In preliminary experiments we noticed that washing steps are necessary in order to remove fluorescence staining outside lysosomes, probably caused by the hydrophobic lipid chain of the caged molecule. Importantly, similar fluorescence staining was also found with the caged cholesterol compound (Fig. S3†), suggesting that the caging group has the potential to target a broad range of caged lipids to lysosomes.
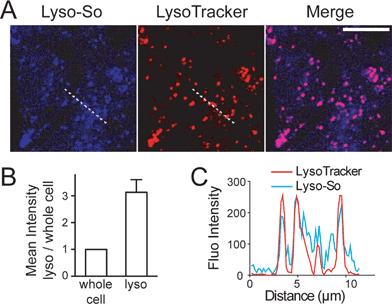 | ||
| Fig. 2 Fluorescence staining of Lyso-So: (A) representative fluorescence images of HeLa cells stained with Lyso-So (5 μM) and LysoTracker Red DND-99 (100 nM). Scale bar: 10 μm. (B) Mean intensities of lysosomes versus the whole cells. Error bars represent SEM, n = 10 cells (see detailed description in the ESI†). (C) Intensity profiles of the white dotted lines in Lyso-So and LysoTracker channels, respectively. | ||
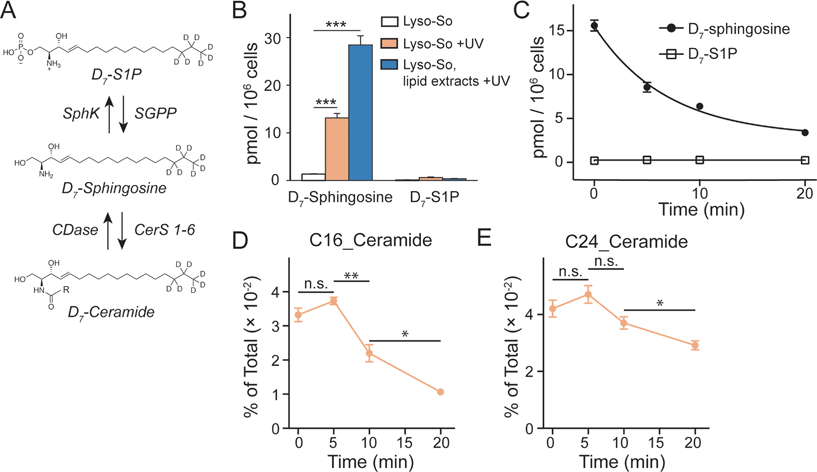
Since the lysosomes are enriched with a variety of hydrolases and lipases required for their metabolic activity and specific conditions prevail in their interior, it is crucial to determine whether the caged lipids are stable prior to UV illumination. For this purpose, we prepared a caged lipid using an isotope labelled D7-sphingosine as a precursor, which ensures that the photo-released sphingosine is easily distinguished from the endogenous sphingolipids by mass spectrometry. Next, we applied the D7-labelled caged sphingosine in HeLa cells under different experimental conditions. After collecting the cells and extracting the lipids, the samples were analysed by LC-MS. We detected a significant increase of D7-sphingosine after UV illumination of the D7-Lyso-So treated cells, and a small amount of D7-sphingosine in the cells treated with Lyso-So in the absence of UV light (Fig. 3B). Interestingly, when the cells were treated with D7-Lyso-So, processed for extraction, and afterwards exposed to UV illumination, we detected twice the amount of sphingosine compared to that when uncaging in the living cell (Fig. 3B, Lyso-So, lipid extracts + UV vs. Lyso-So + UV). The different levels of sphingosine could result from the rapid metabolic turnover of the released sphingosine in the cells during the uncaging process or could be due to the metabolism of the released sphingosine prior to uncaging. In mammalian cells, sphingosine can be converted into two products, sphingosine 1-phosphate (S1P) and ceramides (Fig. 3A). Surprisingly, only a minimal S1P signal was observed after lysosomal uncaging, in contrast to our previous findings that a significant amount of sphingosine was quickly phosphorylated into S1P after being released inside mitochondria.9 Moreover, in the time-course experiment, we observed the decline of D7-sphingosine levels over time, but the D7-S1P levels remained constant at the basal level (Fig. 3C), suggesting that sphingosine was not metabolized through the S1P degradation pathway from lysosomes.
The second metabolic fate is the formation of ceramides via ceramide synthases. As ceramides are much more abundant compared to sphingosine, the use of D7-caged sphingosine offers an advantage of capturing the changes of the newly formed ceramides separately from the endogenous ceramide pool by mass spectrometry. We treated cells with D7-Lyso-So in the absence and presence of UV illumination and then extracted lipids for lipidomics analysis. To our surprise, a significant amount of D7-ceramides was detected without uncaging (Fig. S4†), suggesting the partial decomposition of the Lyso-So. By comparison, in cells that were treated with mitochondria-targeted caged sphingosine (Mito-So)9 or globally caged sphingosine (Sph-Cou),6 only very low ceramide levels were detected without uncaging (Fig. S4†). Since sphingosine and S1P levels were measured using LC-MS and ceramide levels were measured via direct infusion and MS/MS analysis, it is difficult to directly compare the data and estimate how much of the caged sphingosine was released prior to UV illumination. Nevertheless, the sphingosine level in the live-cell uncaging experiment (Fig. 3B, left) suggests that a large portion of sphingosine was still intact before uncaging. As the three caged probes share similar chemical structures and only Lyso-So showed obvious premature release, the decomposition of Lyso-So takes place in lysosomes and is mostly due to the enzymatic activities or the specific environment inside the lysosomes. Thus, even though sphingosine metabolism starts to occur before illumination, it still reflects the metabolic features of lysosomes. It is worth noting that a recent report also described caged probes that target caged lipids to lysosomes and other organelles,12 but the stability of the probes in cells prior to uncaging was not analyzed.
Although partial decomposition of the caged probe reduces our temporal control of lipid metabolism, it is clear from the results that sphingosine phosphorylation is much less important in lysosomes than in mitochondria. This could be explained in several ways. First, there is no evidence for localization of sphingosine kinase to lysosomes, in contrast to evidence that sphingosine kinase 2 (SphK2) localizes to mitochondria,13 which should facilitate localized S1P formation. Second, most of the lysosome-released sphingosine could be quickly transferred to the endoplasmic reticulum (ER) where it is acylated into ceramides via ceramide synthases. This is consistent with the notion of a sphingolipid salvage pathway in which sphingoid bases efficiently traffic to the ER to be converted into ceramides or complex sphingolipids for further distribution.14 Finally, lysosomes are known to contain nonspecific phosphatases and they could affect the amount of S1P. Degradation of S1P by the S1P lyase (SGPL) is less likely because there is not even a transient increase of S1P and the SGPL is localized in the ER.15 Taken together, our results show that the sphingosine metabolism is tightly organized in cells depending on the subcellular compartment and that lysosomal sphingosine does not freely diffuse in the cytoplasm once released from lysosomes.
We further investigated the metabolism of lysosomal sphingosine after uncaging, focusing on ceramide production. In mammalian cells, six ceramide synthases (CerS 1–6) are responsible for converting sphingosine into ceramides with different acyl chain length specificities.16 Conversely, various ceramidases (CDases) can cleave ceramides to form free sphingosine and fatty acids (Fig. 3A).14 To monitor the dynamics of ceramides, we performed a “pulse-chase” type of experiment using our uncaging assay. After photo-releasing D7-sphingosine in lysosomes, we collected the cells after different times at 37 °C and extracted lipids for lipidomics analysis. We found that C16 and C24 D7-ceramides were the major sphingolipids formed and thus concentrated on the metabolism of these two ceramides in further analysis. Because a significant amount of C16 and C24 D7-ceramides were detected without UV illumination, the D7-ceramides measured directly after uncaging (0 minute, Fig. 3D and E) of Lyso-So most likely reflect the initial synthesis of the metabolic products of D7-sphingosine released in lysosomes prior to the uncaging process. The amount increases after 5 minutes of chase. The results revealed a distinct metabolic profile of C16 and C24 ceramides. As shown in Fig. 3D, the C16 ceramide reached its maximum level within five minutes after uncaging and subsequently declined. In contrast, the C24 ceramide levels were similar for the first 5 minutes, but then remained more stable only decreasing after 10 minutes (Fig. 3E). Meanwhile, the endogenous ceramide levels and major lipid species remained stable over time (Fig. S5†), implying that the uncaging assay did not have an effect on the ceramide homeostasis and other major lipid species.
Previously, we have shown that depending on the subcellular compartments, ceramides are metabolized following distinct patterns.9 After releasing sphingosine in mitochondria, we recorded continuous accumulation of ceramides with C16 and C24 fatty acyl chains. Since ceramide synthases are localized in the ER,16 these unique metabolic patterns could be caused by domain differences within the ER and differential delivery dependent upon the donor compartment. Consistent with previous findings, our data here show that the lysosome-released sphingosine was rapidly converted into ceramides which were further metabolized over time. The rapid turnover points to the possibility that the lysosome and ER are tightly connected for sphingosine transfer towards ceramide synthesis. Interestingly, the C16 and C24 ceramides exhibited different turnover rates, unlike our previous results where both C16 and C24 ceramides kept a similar metabolic pace regardless of whether the sphingosine was released from mitochondria, whole cells, or directly added from the extracellular medium. This rapid turnover might be because the C16 ceramide is a signaling molecule involved in apoptosis.17
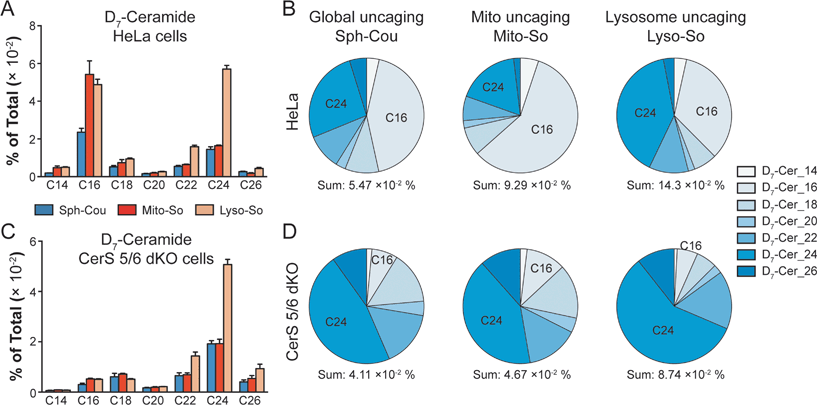
To gain further insights into ceramide metabolism, we turned to CRISPR/Cas9 genome modification,18 a powerful way to interfere with the metabolic network. Combining the knockout cells with the site-specific uncaging methods provides a unique opportunity to explore the functions of key enzymes in the sphingolipid metabolic pathway. For this purpose, we prepared ceramide synthase 5/6 double knockout (CerS 5/6 dKO) cells that lack the major activities to convert sphingosine into the C16 ceramide. Surprisingly, we did not observe a meaningful decline of steady state C16 ceramide levels in the knockout cells (Fig. S7E†). Therefore, the cells must circumvent the deficiency of ceramide synthase 5/6 via other pathways. Nevertheless, when we performed a “pulse-chase” protocol releasing the caged D7-sphingosine in the cells, we detected a very strong decrease in the synthesis of the C16 D7-ceramide in the CerS 5/6 dKO cells (Fig. 4), suggesting that the conversion to the C16 ceramide via CerS 5/6 activity is strongly reduced in the knockout cells. The low amount of C16 ceramide detected in the dKO cells (Fig. 4C and D) could reflect residual enzymatic activities of CerS 5 and/or 6 (Fig. S6†) or could result from inefficient use of palmitoyl-CoA by other ceramide synthases.
Next, we investigated how subcellular localization affects the conversion of sphingosine into the different ceramide species. Using HeLa cells and the generated CerS 5/6 dKO cells, we compared the conversion to ceramide after releasing D7-sphingosine from the whole cells, mitochondria and lysosome (Fig. 4 and S7†). Since the C16 ceramide generated was quickly metabolized after 5 minutes of chase (Fig. 3C), we chose to analyse the lipid profiles at the 5 minute time point after uncaging. In wild-type cells, we detected ceramides with various acyl chains, but the major ones formed were C16 and C24 ceramides, which reached the highest level. Interestingly, lysosome-released sphingosine generated proportionally more C24 ceramide, whereas mitochondria-released sphingosine generated more C16 ceramide (Fig. 4B). When conversion to the C16 ceramide was blocked by deletion of CerS 5/6, we detected a redistribution in the ceramide profile, in which C18, C24 and C26 became more prominent (Fig. 4D). Again, we detected a more pronounced rise of C24 ceramide when uncaging happened in the lysosome, and the C18 ceramide was relatively more enriched under global uncaging as well as mitochondria uncaging conditions. The combined results show that the profile of ceramide formation is greatly affected by the subcellular source of sphingosine. This is unaffected by the light-independent release of sphingosine in lysosomes because the ratio of C16/C24 ceramide does not change between 0 and 5 minutes (Fig. 3D and E). The different profiles of ceramides depending on the mitochondrial or lysosomal source were not necessarily expected because all ceramide synthases are thought to be in the endoplasmic reticulum. Thus, our data demonstrate a localization-dependent metabolic bias in ceramide synthesis, which is likely due to the transport pathways of sphingosine between the ER and other organelles.
It is well-established that lipids can serve distinct functions depending on their subcellular localization, but the experimental means to directly address this issue are limited. One major challenge lies in that small changes in lipid structures can have profound effects on crucial biological functions.19 Bifunctional lipids,20,21 with minimal chemical modification, are introduced for profiling lipid–protein interactions yet not for metabolism studies. Genetic knockout is a powerful tool, but its chronic nature compromises the results if cells find an alternative pathway, as indicated in our data for CerS 5/6 dKO cells (Fig. S7E†). On the other hand, our approach, which combines site-specific photoactivation, lipidomics with isotopic signatures, and genetic knockout, offers a direct way to rapidly release lipids in living cells and quantitatively analyse their metabolic conversion.
Conclusions
To summarize, we developed a lysosome-targeted photoactivation method to investigate local sphingosine metabolism. Future efforts will focus on improving the temporal control of the caged probes by finding conditions to limit the release prior to illumination. Collectively, our data showed a distinct metabolism pattern of lysosomal sphingosine, influencing the formation of S1P and specific ceramide species. These results thus unveiled a metabolic bias in ceramide synthesis dependent upon the localization of the substrate sphingosine. Combined with the mitochondrial specific release,9 this strategy offers a framework to study lipid metabolism with subcellular resolution.Conflicts of interest
There are no conflicts to declare.Acknowledgements
We thank the Bioimaging Center (University of Geneva) for technical assistance. T. H. was supported by the Japan Society for the Promotion of Science (JSPS) Postdoctoral Fellowships for Research Abroad. J. T. H. was supported by an EMBO/Marie-Curie Long-Term Fellowship. This study was supported by the Swiss National Science Foundation (CRSII3-154405, 310030B_166686) and the NCCR Chemical Biology funded by the Swiss National Science Foundation (51NF40-160589).Notes and references
- A. X. da Silveira Dos Santos, I. Riezman, M.-A. Aguilera-Romero, F. David, M. Piccolis, R. Loewith, O. Schaad and H. Riezman, Mol. Biol. Cell, 2014, 25, 3234–3246 CrossRef PubMed.
- D. Höglinger, A. Nadler and C. Schultz, Biochim. Biophys. Acta, 2014, 1841, 1085–1096 CrossRef PubMed.
- D. Subramanian, V. Laketa, R. Müller, C. Tischer, S. Zarbakhsh, R. Pepperkok and C. Schultz, Nat. Chem. Biol., 2010, 6, 324–326 CrossRef CAS PubMed.
- X. Fang, Y. Fu, M. J. C. Long, J. A. Haegele, E. J. Ge, S. Parvez and Y. Aye, J. Am. Chem. Soc., 2013, 135, 14496–14499 CrossRef CAS PubMed.
- A. Nadler, G. Reither, S. Feng, F. Stein, S. Reither, R. Müller and C. Schultz, Angew. Chem., Int. Ed. Engl., 2013, 52, 6330–6334 CrossRef CAS PubMed.
- D. Höglinger, P. Haberkant, A. Aguilera-Romero, H. Riezman, F. D. Porter, F. M. Platt, A. Galione and C. Schultz, eLife, 2015, 4, 300 CrossRef PubMed.
- J. A. Frank, M. Moroni, R. Moshourab, M. Sumser, G. R. Lewin and D. Trauner, Nat. Commun., 2015, 6, 7118 CrossRef PubMed.
- J. A. Frank, D. A. Yushchenko, D. J. Hodson, N. Lipstein, J. Nagpal, G. A. Rutter, J.-S. Rhee, A. Gottschalk, N. Brose, C. Schultz and D. Trauner, Nat. Chem. Biol., 2016, 12, 755–762 CrossRef CAS PubMed.
- S. Feng, T. Harayama, S. Montessuit, F. P. David, N. Winssinger, J.-C. Martinou and H. Riezman, eLife, 2018, 7, 647 Search PubMed.
- C. Settembre, A. Fraldi, D. L. Medina and A. Ballabio, Nat. Rev. Mol. Cell Biol., 2013, 14, 283–296 CrossRef CAS PubMed.
- E. Lloyd-Evans, A. J. Morgan, X. He, D. A. Smith, E. Elliot-Smith, D. J. Sillence, G. C. Churchill, E. H. Schuchman, A. Galione and F. M. Platt, Nat. Med., 2008, 14, 1247–1255 CrossRef CAS PubMed.
- N. Wagner, M. Stephan, D. Höglinger and A. Nadler, Angew. Chem., Int. Ed. Engl., 2018, 57, 13339–13343 CrossRef CAS PubMed.
- G. M. Strub, M. Paillard, J. Liang, L. Gomez, J. C. Allegood, N. C. Hait, M. Maceyka, M. M. Price, Q. Chen, D. C. Simpson, T. Kordula, S. Milstien, E. J. Lesnefsky and S. Spiegel, FASEB J., 2011, 25, 600–612 CrossRef CAS PubMed.
- Y. A. Hannun and L. M. Obeid, Nat. Rev. Mol. Cell Biol., 2017, 1–17 Search PubMed.
- M. Ikeda, A. Kihara and Y. Igarashi, Biochem. Biophys. Res. Commun., 2004, 325, 338–343 CrossRef CAS PubMed.
- M. Levy and A. H. Futerman, IUBMB Life, 2010, 347–356 CAS.
- L. J. Siskind and M. Colombini, J. Biol. Chem., 2000, 275, 38640–38644 CrossRef CAS PubMed.
- F. A. Ran, P. D. Hsu, J. Wright, V. Agarwala, D. A. Scott and F. Zhang, Nat. Protoc., 2013, 8, 2281–2308 CrossRef CAS PubMed.
- T. Harayama and H. Riezman, Nat. Rev. Mol. Cell Biol., 2018, 19, 281–296 CrossRef CAS PubMed.
- P. Haberkant, R. Raijmakers, M. Wildwater, T. Sachsenheimer, B. Brügger, K. Maeda, M. Houweling, A.-C. Gavin, C. Schultz, G. van Meer, A. J. R. Heck and J. C. M. Holthuis, Angew. Chem., Int. Ed. Engl., 2013, 52, 4033–4038 CrossRef CAS PubMed.
- P. Haberkant, F. Stein, D. Höglinger, M. J. Gerl, B. Brügger, P. P. Van Veldhoven, J. Krijgsveld, A.-C. Gavin and C. Schultz, ACS Chem. Biol., 2016, 11, 222–230 CrossRef CAS PubMed.
Footnote |
| † Electronic supplementary information (ESI) available. See DOI: 10.1039/c8sc03614d |
| This journal is © The Royal Society of Chemistry 2019 |

