A step forward in the development of in situ product recovery by reactive separation of protocatechuic acid
Received
8th August 2018
, Accepted 23rd October 2018
First published on 24th October 2018
Abstract
The development of in situ product recovery (ISPR), i.e., integrated bioconversion with a product separation and recovery system, is crucial for a competitive and sustainable technology for biotechnological protocatechuic acid (PCA) production. The major impediment to this development is the toxicity of extractants towards fermenting microorganisms. An initiative for the development of an integrated PCA fermentation–separation system by reactive extraction using tri-n-butyl phosphate (TBP) in canola oil and groundnut oil was conducted experimentally. The toxic effect of the extractant was circumvented by using non-toxic natural diluents which prevented the contact between the organic phase and organism. The extraction equilibrium complexation constant, dimerization constant, distribution coefficient, partition coefficient, loading ratio, and extraction efficiency were evaluated. The maximum extraction efficiency of 95% for canola oil and 90% for groundnut oil in TBP was achieved in a single cycle. The average distribution coefficient of canola oil (12.14) was higher compared to that of groundnut oil (6.58). Distinctive models represented the equilibrium of PCA using TBP. The findings of this study form the basis for the design of a continuous reactive extraction column and an appropriate ISPR configuration for PCA.
Introduction
Protocatechuic acid (PCA) is an extensively distributed phenolic acid chemically known as 3,4-dihydroxybenzoic acid, detected in many plants and fruits like plums (Prunus domestica L.),1 gooseberries (Ribesuvacrispa L.),2 grapes (Vitisvinifera),2 olives (Olea europaea),3 and Japanese ginkgo (Ginkgo biloba).4 PCA is a crucial metabolite formed by the conversion of complex polyphenols and absorbed in the large intestine due to microbial metabolization.5,6 The research on PCA and its derivatives (esters, aldehydes, etc.) demonstrated its capability of exhibiting antibacterial,7 antioxidant8 anticancer,9 antidiabetic10 antiulcer,11 antiageing,12 antifibrotic,13 and antiviral14 activities besides cardioprotective effects.15 PCA is a preventive aid for the damage caused by oxidative stress-mediated nephrotoxicity.16 It is also reported as an effective anti-inflammatory, analgesic, and antiseptic.17 Its anti-inflammatory activity exhibits an antiatherogenic effect.18 PCA was recognized as an active substance against the H9N2 infection avian influenza virus19 and IBDV infection.20 PCA is a new monomer for synthesizing bioplastics and polymers manufactured from sugars by recombinant microorganisms.21 An excellent electrochemical activity has also been exhibited by a composite polymer of PCA and aniline.22
Direct PCA extraction from plant secondary metabolites is unfavourable. An economical way for the production of PCA is biosynthesis,21–26 which has been gaining significance in satisfying the demand for PCA with diverse applications. The major bottleneck in sustainable technology development through the biosynthesis process is the separation of PCA from dilute fermentation broth which accounts for around 50% of the total production cost for bio-based processes. Numerous techniques for its recovery have been suggested viz. adsorption,27–29 microbial degradation,30 ultrafiltration,31 Fenton,32 and O3/UV or H2O2/UV processes.33 The methods above, however, are impeded by their low selectivity, being time-consuming and energy intensive, generation of toxic by-products, and ineffectiveness for dilute solutions.34 ISPR forms an intriguing approach in the recovery of PCA to establish a sustainable, cost-effective, and competitive bioprocess for PCA production. ISPR can enhance the productivity and efficient recovery of PCA as it has the potential to mitigate product inhibition.35 To serve as the first step in the design of ISPR for PCA production, the current study emphasizes the separation and recovery of PCA by reactive extraction.
Reactive extraction is an emerging technology for carboxylic acid recovery from fermentation broth or diluted aqueous solution36–39 as it provides numerous advantages over conventional techniques such as ease of back extraction40 of the acid with higher purity, reusability of the solvent, better pH control in the bioreactor, and reduction of the downstream recovery cost and processing load. The key to higher separation yields is the selection of appropriate diluents.38 A variety of research studies on the use of non-toxic and eco-friendly organic phases with natural diluents,41–47 ionic liquids48–51 and novel extractants43,52–61 have been performed.
The presence of organic solvents affects the catalytic activity of micro-organisms and may give rise to a series of biochemical and microbial effects. The toxic effects of the organic solvents and extractant are a major challenge in fermentation, and their degree depends on the combination of microbes and extractants in solution. The effect of toxicity can be reduced considerably by avoiding the direct contact of the organic phase with the micro-organism. The combination of solvents having high molecular weight with low polarity solvents has been reported to exhibit the least toxicity.62 The presence of two phases and a soluble portion of solvents gives rise to the toxicity as discussed by Bar and Gainer.63 The direct contact of micro-organisms in the broth was also investigated by the use of a membrane.64–66 The maximum recovery of lactic acid was achieved using sunflower oil with oleyl alcohol and 15% Alamine along with immobilized cells.67 The sunflower oil prevented the toxic effects of the solvents by extracting Alamine 336 that diffused into the gels. Harington and Hossain68 studied the effect of the combination of carriers like Aliquat336 and TOA in sunflower oil or with TBP for the reactive extraction of lactic acid.69 Kar et al.69 reported the recovery of acrylic acid using TBP in sunflower oil, rice bran oil, and soybean oil. The toxic effects of TBP in the present study were averted using canola oil and groundnut oil as diluents.
The massive commercial importance of PCA has recently drawn the attention of researchers towards its recovery by reactive extraction,46,58 but very few reports are available in the literature. A brief literature review on the recovery of carboxylic acids using different diluents and TBP as an extractant is listed in Table 1. The present study aims to contribute towards the recovery of PCA from fermentation broth by reactive extraction using TBP as an extractant in canola oil and groundnut oil. The results were analyzed concerning the PCA extraction efficiency, distribution coefficient, loading ratio, and extraction equilibrium complexation constant. The mathematical modelling of the equilibrium data was performed by using a modified Langmuir model (LM), relative basicity model (RBM), and mass action law (MAL) model. The reactive extraction system for PCA identified in this study shall be used in future applications in designing an ISPR configuration.
Table 1 A brief literature review on the recovery of carboxylic acids in different diluents using TBP as an extractant
| Carboxylic acid |
Diluents used |
Studies |
| α-Toluic acid (0.005–0.099 mol L−1)70 |
Triglycerides of fatty acids such as castor oil, soybean oil, and sunflower oil |
Equilibrium studies, mathematical modelling (relative basicity model) |
| Pyruvic acid (0.025–0.2 mol L−1)86 |
Decanol |
Equilibrium studies |
| Phenylacetic acid (0.005–0.099 mol L−1)87 |
Hexanol |
Equilibrium and kinetics studies |
| Acrylic acid (0.05–0.5 mol L−1)69 |
Soybean oil, sunflower oil, and rice bran oil |
Equilibrium studies |
| Gallic acid (0.005–0.3 mol L−1)88 |
Hexanol |
Response surface analysis, process optimization, mathematical modelling (ANN and RSM models) |
| Levulinic acid (0.111–0.541 mol kg−1)89 |
1-Octanol |
Equilibrium studies, extraction column design |
| Phenylacetic acid (0.099 mol L−1)78 |
MIBK and petroleum ether |
Equilibrium studies, mathematical modelling (relative basicity model) |
| Glutaric acid (0.19–1.10 mol kg−1)90 |
Ethyl acetate and hexanol |
Equilibrium studies |
| Picolinic acid (0.02–0.12 mol L−1)90 |
Petroleum ether, MIBK, and iso-amyl alcohol |
Equilibrium study, equilibrium modelling to describe the synergistic effect |
| Gallic acid91 |
1-Hexanol and 1-octanol |
Equilibrium studies, thermodynamic study, |
| Citric acid92 |
Butyl acetate, decanol, and benzene |
Equilibrium studies, mathematical modelling (LSER model) |
| Glacial acetic acid, propionic acid, and butyric acid93 |
1-Decanol and methyl isobutyl ketone |
Equilibrium studies, Taguchi approach |
| Picolinic acid86 |
Dodecane and oleyl alcohol |
Equilibrium studies, back-extraction efficiency, equilibrium modelling |
| Pyruvic acid (0.05–0.5 mol L−1)94 |
Heptane, toluene, and MIBK |
Equilibrium studies |
Materials and methods
PCA (purity >99%) was supplied by Merck Millipore. The extractant tri-n-butyl phosphate (TBP, of assay 99%) was obtained from Sigma-Aldrich. Analytical grade canola oil (rapeseed oil) and groundnut oil (peanut oil) were supplied by Sigma-Aldrich, Germany. All chemicals were used as received unless otherwise noted. The typical physicochemical properties of the chemicals utilized in the present study are listed in Table 2. The presence of free acids in the oil may raise a concern in the recovery of PCA as they can leach into the aqueous phase and give erroneous results. The pre-treatment of the oils by back-extraction to remove the free acids at 353.15 K with DI water71 circumvented this complication. There was no observation on the formation of an unfavourable third phase apart from the aqueous phase and organic phase after back extraction.
Table 2 The physicochemical properties of the chemicals used in the present study
| Chemicals |
MW (g mol−1) |
Molecular structure |
BP (K) |
MP (K) |
S
Water (g L−1) |
ρ (kg m−3) |
RI |
μ (cP) |
ε
|
log![[thin space (1/6-em)]](https://www.rsc.org/images/entities/char_2009.gif) Kow Kow |
MW = molecular weight, BP = boiling point, MP = melting point, SWater = solubility in water, ρ = density, RI = refractive index, μ = viscosity, ε = dielectric constant, log![[thin space (1/6-em)]](https://www.rsc.org/images/entities/char_2009.gif) Kow = octanol–water partition coefficient, TBP = tri-n-butyl phosphate. Kow = octanol–water partition coefficient, TBP = tri-n-butyl phosphate.
|
| Protocatechuic acid |
154.121 |

|
— |
494 |
12.4 |
1540 |
— |
— |
— |
0.86 |
| TBP |
266.31 |
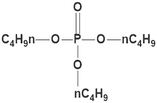
|
562 |
193 |
5.9 |
975 |
1.424 |
3.80 |
10.30 |
2.5–4 |
| Canola oil |
876.6 |

|
477 |
263 |
Immiscible |
914 |
1.465 |
56 |
4.478 |
— |
| Groundnut oil |
— |
— |
433 |
276 |
Immiscible |
920 |
1.470 |
57.4 |
3.365 |
— |
The working solutions of PCA were produced using DI water in the range of 0.001 to 0.01 mol L−1. The concentration range is based on the maximum PCA concentration in diluted fermentation broth and cytotoxicity to human cell lines.72 The low initial pH (∼3.34) of PCA in aqueous solution was advantageous as the pH < pKA (∼4.48), and as a result, the undissociated PCA molecules were recoverable. Levien73 presented the activity coefficients of undissociated acid in the aqueous phase using ϒ = exp(0.0783[CPCA]0), where ϒ is the activity coefficient and [CPCA]0 is the aqueous phase concentration of PCA. The non-ideality of the aqueous phase in the concentration range considered for the investigation does not seem to play an important role and can be considered negligible as ϒ turns out to be 1. The hydration of the organic phase induces the non-ideality in the organic phase.74 This non-ideality can be safely neglected as water was assumed to be insoluble in the organic phase as there was no water co-extraction and negligible change was observed in the volume of the organic and aqueous phases after extraction. The TBP concentration in canola oil and groundnut oil was varied from 0.37–2.94 mol L−1 (10–80 vol%) for the reactive extraction of PCA. All the other parameters and experimental conditions for the physical and reactive extraction are the same. A schematic of the experimental procedure is depicted in Fig. 1. Equal volumes of the aqueous phase (PCA) and an organic phase (canola oil or groundnut oil + TBP) were shaken for 4 hours in an incubator at 27 °C (300.15 ± 1 K). The preliminary experiments ascertained the equilibrium time to be 3 hours. Centrifugation (REMI PR - 24) at 4000 rpm for 3 minutes resulted in adequate separation of the two mixed phases (aqueous and organic). The kinetics of extraction determines the holdup volume of the reactor which is the next step of the study which may be carried out separately. The kinetics of the reaction can be perceived by determining the different reaction regimes like very slow reaction, slow reaction, fast reaction, and instantaneous reaction as the reactive extraction of PCA involves mass transfer by chemical reaction.75 The duration of 4 hours can be considered sufficient to achieve equilibrium to avoid uncertainties.76,77 A UV/visible spectrophotometer (Shimadzu 2800, Japan) was used to analyze the concentration of PCA initially and at equilibrium at the wavelength of 260 nm. The PCA concentration was evaluated in the organic phase by mass balance, and the organic phase was assumed to have negligible solubility in the water phase. A few experiments under identical conditions were repeated to ensure the reproducibility of the results, which was found reliable within ±2%.
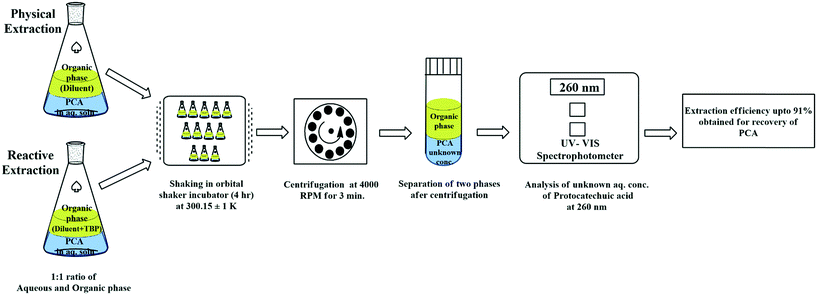 |
| | Fig. 1 Schematic representation of the experimental procedure and instrumentation for the physical and reactive extraction of PCA. | |
The PCA extraction was determined by the distribution coefficient (KD,PCA), which is a function of the total acid concentration at equilibrium in all forms in the organic phase [CPCA]org and aqueous phase [CPCA]aq calculated as:
| |  | (1) |
The equilibrium extraction efficiency (E%) is the ratio of the extract phase PCA concentration to the initial PCA concentration in aqueous solution calculated as:
| |  | (2) |
where [
CPCA]
0aq is the initial PCA concentration in the aqueous phase.
Experimental uncertainty may be a result of random variation or instrumental error calculated as:
| |  | (3) |
where
![[x with combining double overline]](https://www.rsc.org/images/entities/i_char_0078_033f.gif)
is the mean of the experimental values,
xi is the value of experimental observation, and
N is the number of experimental observations. The experimental uncertainties were within
x ± 0.001.
78
Results and discussion
Physical extraction
The KD,PCA and E% values for PCA without TBP (physical extraction) in natural, non-toxic diluents were higher in the case of canola oil (0.08, 7.21%) than those in groundnut oil (0.068, 6.29%) (refer to Tables 3 and 4). The KD,PCA was observed to increase with increasing PCA concentration. Canola oil through hydrogen bonding provides better solvation by limiting the dimer formation in the organic phase, and thus, is perceived to report higher KD,PCA values than groundnut oil, thus favouring the extraction process.
Table 3 Chemical equilibrium and reactive extraction parameters (distribution coefficient, KD,PCA, extraction efficiency, E%, loading ratio, zPCA, and equilibrium complexation constant, K11) of PCA with tri-n-butyl phosphate in canola oil at 300.15 ± 1 Ka,b
| [CTBP]0org (mol L−1) |
[CPCA]0 (mol L−1) |
[CPCA]aq (mol L−1) |
[CPCA]org (mol L−1) |
K
D,PCA
|
Avg. KD,PCA |
E% |
Avg. E% |
z
PCA
|
K
11
|
|
Standard uncertainties (u) are u(T) = ±1 K; u([CTBP]0org) = ±0.001 mol L−1, u([CPCA]0) = ±0.001 mol L−1, u([CPCA]aq) = ±0.001 mol L−1, u([CPCA]org) = ±0.001 mol L−1.
Organic phase: TBP + canola oil, [CTBP]0org = initial concentration of TBP in the organic phase, [CPCA]0 = initial concentration of PCA in the aqueous phase,[CPCA]aq = equilibrium concentration of PCA in the aqueous phase, [CPCA]org = equilibrium concentration of PCA in the organic phase.
|
| 0 |
0.001 |
0.0010 |
0.000031 |
0.03 |
0.080 |
3.17 |
7.21 |
— |
— |
| 0.003 |
0.0029 |
0.0001 |
0.05 |
4.99 |
| 0.005 |
0.0047 |
0.0003 |
0.07 |
6.20 |
| 0.007 |
0.0064 |
0.0006 |
0.09 |
8.63 |
| 0.010 |
0.0087 |
0.0013 |
0.15 |
13.32 |
| 0.37 |
0.001 |
0.0004 |
0.0006 |
1.50 |
2.94 |
60.03 |
73.29 |
0.0016 |
9.54 |
| 0.003 |
0.0008 |
0.0022 |
2.90 |
74.36 |
0.0061 |
| 0.005 |
0.0012 |
0.0038 |
3.16 |
75.98 |
0.0103 |
| 0.007 |
0.0016 |
0.0054 |
3.42 |
77.39 |
0.0147 |
| 0.010 |
0.0021 |
0.0079 |
3.69 |
78.70 |
0.0214 |
| 0.74 |
0.001 |
0.0003 |
0.0007 |
2.05 |
5.27 |
67.21 |
81.73 |
0.0009 |
8.93 |
| 0.003 |
0.0006 |
0.0024 |
4.35 |
81.30 |
0.0033 |
| 0.005 |
0.0008 |
0.0042 |
5.65 |
84.97 |
0.0058 |
| 0.007 |
0.0010 |
0.0060 |
6.22 |
86.15 |
0.0082 |
| 0.010 |
0.0011 |
0.0089 |
8.10 |
89.00 |
0.0121 |
| 1.47 |
0.001 |
0.0002 |
0.0008 |
3.40 |
7.88 |
77.29 |
87.30 |
0.0005 |
6.52 |
| 0.003 |
0.0004 |
0.0026 |
7.02 |
87.53 |
0.0018 |
| 0.005 |
0.0005 |
0.0045 |
8.76 |
89.76 |
0.0031 |
| 0.007 |
0.0007 |
0.0063 |
9.31 |
90.30 |
0.0043 |
| 0.010 |
0.0008 |
0.0092 |
10.90 |
91.60 |
0.0062 |
| 2.21 |
0.001 |
0.0002 |
0.0008 |
4.80 |
10.35 |
82.76 |
90.07 |
0.0004 |
5.7 |
| 0.003 |
0.0003 |
0.0027 |
8.58 |
89.56 |
0.0012 |
| 0.005 |
0.0004 |
0.0046 |
11.00 |
91.67 |
0.0021 |
| 0.007 |
0.0005 |
0.0065 |
13.04 |
92.88 |
0.0029 |
| 0.01 |
0.0007 |
0.0093 |
14.34 |
93.48 |
0.0042 |
| 2.94 |
0.001 |
0.0001 |
0.0009 |
7.70 |
12.14 |
88.51 |
91.93 |
0.0003 |
4.86 |
| 0.003 |
0.0003 |
0.0027 |
10.27 |
91.13 |
0.0009 |
| 0.005 |
0.0004 |
0.0046 |
11.80 |
92.18 |
0.0016 |
| 0.007 |
0.0004 |
0.0066 |
14.78 |
93.66 |
0.0022 |
| 0.01 |
0.0006 |
0.0094 |
16.15 |
94.17 |
0.0032 |
Table 4 Chemical equilibrium and reactive extraction parameters (distribution coefficient, KD,PCA, extraction efficiency, E%, loading ratio, zPCA, and equilibrium complexation constant, K11) of PCA with tri-n-butyl phosphate in groundnut oil at 300.15 ± 1 Ka,b
| [CTBP]0org (mol L−1) |
[CPCA]0 (mol L−1) |
[CPCA]aq (mol L−1) |
[CPCA]org (mol L−1) |
K
D,PCA
|
Avg. KD,PCA |
E% |
Avg. E% |
z
PCA
|
K
11
|
|
Standard uncertainties (u) are u(T) = ±1 K; u([CTBP]0org) = ±0.001 mol L−1, u([CPCA]0) = ±0.001 mol L−1, u([CPCA]aq) = ±0.001 mol L−1, u([CPCA]org) = ±0.001 mol L−1.
Organic phase: TBP + groundnut oil, [CTBP]0org = initial concentration of TBP in the organic phase, [CPCA]0 = initial concentration of PCA in the aqueous phase, [CPCA]aq = equilibrium concentration of PCA in the aqueous phase, [CPCA]org = equilibrium concentration of PCA in the organic phase.
|
| 0 |
0.001 |
0.0010 |
0.000015 |
0.02 |
0.068 |
1.50 |
6.29 |
— |
— |
| 0.003 |
0.0028 |
0.0002 |
0.06 |
5.51 |
| 0.005 |
0.0047 |
0.0003 |
0.07 |
6.80 |
| 0.007 |
0.0064 |
0.0006 |
0.09 |
8.01 |
| 0.010 |
0.0090 |
0.0010 |
0.11 |
9.61 |
| 0.37 |
0.001 |
0.0006 |
0.0004 |
0.75 |
1.69 |
42.97 |
60.69 |
0.0012 |
5.82 |
| 0.003 |
0.0013 |
0.0017 |
1.38 |
57.91 |
0.0047 |
| 0.005 |
0.0018 |
0.0032 |
1.73 |
63.33 |
0.0086 |
| 0.007 |
0.0022 |
0.0048 |
2.20 |
68.78 |
0.0131 |
| 0.010 |
0.0030 |
0.0070 |
2.39 |
70.48 |
0.0192 |
| 0.74 |
0.001 |
0.0006 |
0.0004 |
1.01 |
2.83 |
50.31 |
71.26 |
0.0006 |
4.68 |
| 0.003 |
0.0008 |
0.0022 |
2.74 |
73.25 |
0.0030 |
| 0.005 |
0.0012 |
0.0038 |
3.25 |
76.47 |
0.0052 |
| 0.007 |
0.0016 |
0.0054 |
3.40 |
77.27 |
0.0074 |
| 0.010 |
0.0021 |
0.0079 |
3.77 |
79.03 |
0.0107 |
| 1.47 |
0.001 |
0.0003 |
0.0007 |
2.13 |
4.72 |
68.06 |
80.76 |
0.0005 |
3.92 |
| 0.003 |
0.0006 |
0.0024 |
4.22 |
80.85 |
0.0016 |
| 0.005 |
0.0009 |
0.0041 |
4.87 |
82.97 |
0.0028 |
| 0.007 |
0.0011 |
0.0059 |
5.52 |
84.67 |
0.0040 |
| 0.010 |
0.0013 |
0.0087 |
6.84 |
87.24 |
0.0060 |
| 2.21 |
0.001 |
0.0003 |
0.0007 |
2.73 |
5.18 |
73.18 |
82.47 |
0.0003 |
2.86 |
| 0.003 |
0.0006 |
0.0024 |
4.19 |
80.72 |
0.0011 |
| 0.005 |
0.0008 |
0.0042 |
5.29 |
84.09 |
0.0019 |
| 0.007 |
0.0010 |
0.0060 |
6.16 |
86.04 |
0.0027 |
| 0.010 |
0.0012 |
0.0088 |
7.54 |
88.29 |
0.0040 |
| 2.94 |
0.001 |
0.0003 |
0.0007 |
2.91 |
6.58 |
74.44 |
85.35 |
0.0003 |
2.69 |
| 0.003 |
0.0004 |
0.0026 |
6.26 |
86.23 |
0.0009 |
| 0.005 |
0.0006 |
0.0044 |
7.19 |
87.79 |
0.0015 |
| 0.007 |
0.0008 |
0.0062 |
7.52 |
88.26 |
0.0021 |
| 0.010 |
0.0010 |
0.0090 |
9.01 |
90.01 |
0.0031 |
The dimerization constant (D) and partition coefficient (P) values can be evaluated by regression of:38
The P and D values for PCA were estimated to be 0.0141 and 36![[thin space (1/6-em)]](https://www.rsc.org/images/entities/char_2009.gif) 023 and 0.0173 and 17
023 and 0.0173 and 17![[thin space (1/6-em)]](https://www.rsc.org/images/entities/char_2009.gif) 583 in canola oil and groundnut oil, respectively. The findings suggest that the P and D values are related inversely. Dimerization occurs when the interactive forces between the solute–solute are more intense than the interactions between the solute–solvent.
583 in canola oil and groundnut oil, respectively. The findings suggest that the P and D values are related inversely. Dimerization occurs when the interactive forces between the solute–solute are more intense than the interactions between the solute–solvent.
The two important principles which control the extraction process are the extent of hydration of the acid and the energy of the bond to water molecules. The higher affinity of PCA for water may be the reason for the relatively lower values of KD,PCA and E% in canola oil and groundnut oil without TBP, which makes the separation difficult. This renders the conventional extraction technique unsuccessful for the separation of the PCA present in the dilute aqueous solutions. Thus, the process of reactive extraction was explored for the better possibility of achieving further increased efficiency using organophosphorus species like TBP.
Reactive extraction
The reactive extraction allows reaction between PCA and TBP, unlike physical extraction. TBP plays an integral role as an extractant providing effective recovery of PCA with solutions consisting of identical species. The values of KD,PCA, E% and loading ratios (zPCA) for the recovery of PCA using TBP in canola oil and groundnut oil are depicted in Tables 3 and 4. Fig. 2(a and b) show the recovery of PCA by reactive extraction using TBP and oil-based solvents at the equilibrium state. An improvement in the reactive extraction of PCA with natural non-toxic diluents and TBP in terms of E% and KD,PCA was observed (up to 94.17% and 16.15 in canola oil and 90% and 9 in groundnut oil with TBP) as compared to physical extraction (maximum of 13.32% and 0.15 in canola oil and 9.61% and 0.11 in groundnut oil). The values of E% and KD,PCA increased with the increase in initial PCA concentration. The lower concentration range of PCA in the initial aqueous solution may be the reason for this increase. A decrease with the increase in concentration of acid is observed for higher initial PCA concentrations.
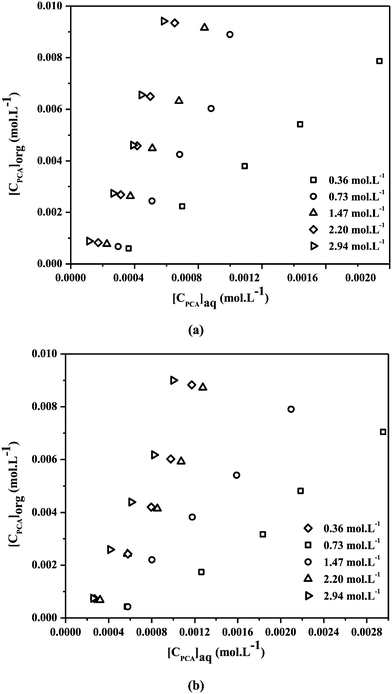 |
| | Fig. 2 Equilibrium isotherms for reactive extraction of PCA (0.001–0.01 mol L−1) with various concentrations of TBP (0.36–2.94 mol L−1) in (a) canola oil and (b) groundnut oil at 300.15 ± 1 K. | |
The diluents used with TBP aid to decrease the interface surface tension by altering their viscosity thereby improving the physical properties. The diluents influence the extraction through hydrogen bonding or dipole–dipole interaction of polar ion-pair organic species to form single or multiple acid–extractant complexes. The characteristics which make TBP an apt choice as an extractant are low aqueous phase solubility, no substantial addition to the aqueous phase raffinate COD, and water co-extraction with a mass fraction around 4.67%.41
The values of KD,PCA and E% vary with the diluent type and the organic phase extractant concentration.38Fig. 3 and 4 demonstrate the variation in KD,PCA and E% of PCA with the change in the TBP concentration. The average KD,PCA increased from 2.94 to 12.14 and 1.69 to 6.58 whereas the average E% increased from 73.29 to 91.93 and 60.69 to 85.35 with the increase in extractant concentration in canola and groundnut oil. TBP helps to influence such interaction by complexation of molecules and self-association with diluents and other solutes. It comprises a much stronger Lewis base phosphoryl group (![[double bond, length as m-dash]](https://www.rsc.org/images/entities/char_e001.gif) PO4−) rather than a carbonyl group which plays the particular role of an electron acceptor and donor.62 As a result, considerable recovery of PCA from aqueous solution using TBP was achieved, and an increase in KD,PCA and E% with the increase in TBP concentration was observed. Canola oil provides better solvation with TBP. Also, there are various percentages of a double bond containing polyunsaturated fatty acids present. These are the factors why the average KD,PCA and average E% of PCA for canola oil are higher than those of groundnut oil, hence favouring PCA extraction. It is worth noting that the values of KD,PCA and E% for TBP in canola oil and groundnut oil are comparable to those for di-(2-ethylhexyl)phosphoric acid (D2EHPA) in toluene, isobutyl acetate, and petroleum ether for the recovery of PCA by reactive extraction.58 This suggests that canola oil and groundnut oil are non-toxic natural diluents that can serve as possible alternatives to the conventional diluents thereby reducing the toxicity.
PO4−) rather than a carbonyl group which plays the particular role of an electron acceptor and donor.62 As a result, considerable recovery of PCA from aqueous solution using TBP was achieved, and an increase in KD,PCA and E% with the increase in TBP concentration was observed. Canola oil provides better solvation with TBP. Also, there are various percentages of a double bond containing polyunsaturated fatty acids present. These are the factors why the average KD,PCA and average E% of PCA for canola oil are higher than those of groundnut oil, hence favouring PCA extraction. It is worth noting that the values of KD,PCA and E% for TBP in canola oil and groundnut oil are comparable to those for di-(2-ethylhexyl)phosphoric acid (D2EHPA) in toluene, isobutyl acetate, and petroleum ether for the recovery of PCA by reactive extraction.58 This suggests that canola oil and groundnut oil are non-toxic natural diluents that can serve as possible alternatives to the conventional diluents thereby reducing the toxicity.
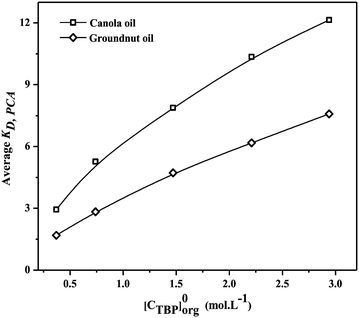 |
| | Fig. 3 Effect of TBP concentration (0.36–2.94 mol L−1) on the average distribution coefficient (KD,PCA) for reactive extraction of PCA in canola oil and groundnut oil at 300.15 ± 1 K. | |
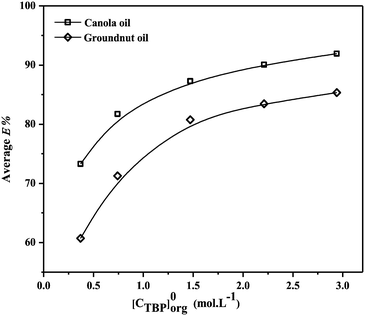 |
| | Fig. 4 Effect of TBP concentration (0.36–2.94 mol L−1) on the average extraction efficiency (E%) for reactive extraction of PCA in canola oil and groundnut oil at 300.15 ± 1 K. | |
The loading of PCA in the organic phase (TBP + diluents) to a certain extent is indicated by zPCA, the loading ratio, which is the total organic phase PCA concentration over the total concentration of extractant calculated as:38
| |  | (5) |
where [
CTBP]
0org is the initial organic phase TBP concentration.
Fig. 5 depicts the effect of TBP with diluents on
zPCA. With the increase in TBP concentration, a decrease in the loading ratio is observed for all PCA concentrations in various diluents. The maximum loading was attained at a smaller TBP concentration and a higher concentration of PCA. As
zPCA < 0.5 for all TBP and PCA concentrations, the organic phase is less concentrated, thus indicating no overloading and formation of the 1
![[thin space (1/6-em)]](https://www.rsc.org/images/entities/char_2009.gif)
:
![[thin space (1/6-em)]](https://www.rsc.org/images/entities/char_2009.gif)
1 PCA–TBP complex as presented in
Fig. 6 and the following equation holds:
38| |  | (6) |
where
K11 is the experimental equilibrium complexation constant for extraction. The higher values of
K11 for a particular diluent denote better extraction of PCA as compared to other diluents in TBP. The experimental
K11 values for PCA in canola oil and groundnut oil with TBP are listed in
Table 5. The
K11 values of canola oil are higher than those of groundnut oil which may be due to the difference in the solvation of the diluent. The 1
![[thin space (1/6-em)]](https://www.rsc.org/images/entities/char_2009.gif)
:
![[thin space (1/6-em)]](https://www.rsc.org/images/entities/char_2009.gif)
1 complex formation and low values of
K11 can be attributed to the lesser solvation of the polar complexes.
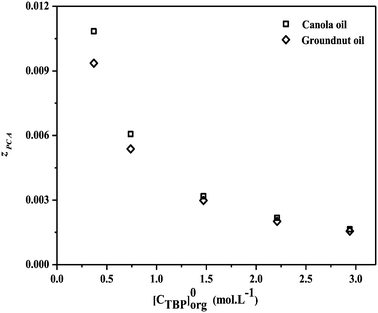 |
| | Fig. 5 The variation in the loading factor (zPCA) with the concentration of TBP (0.36–2.94 mol L−1) for reactive extraction of PCA in canola oil and groundnut oil at 300.15 ± 1 K. | |
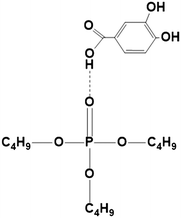 |
| | Fig. 6 PCA–TBP complex (1![[thin space (1/6-em)]](https://www.rsc.org/images/entities/char_2009.gif) : :![[thin space (1/6-em)]](https://www.rsc.org/images/entities/char_2009.gif) 1) in canola oil and groundnut oil at 300.15 ± 1 K. 1) in canola oil and groundnut oil at 300.15 ± 1 K. | |
Table 5 Equilibrium complexation constant (K11) for reactive extraction of PCA using TBP in canola oil and groundnut oil
| Solvent |
[CTBP]0org (mol L−1) |
K
11 (Exp.) |
K
11 (MAL) |
K
11 (RBM) |
K
11 (LM) |
| Canola oil |
0.37 |
9.54 |
8.08 |
8.02 |
9.00 |
| 0.74 |
8.93 |
7.22 |
7.22 |
7.20 |
| 1.47 |
6.51 |
5.37 |
5.35 |
4.23 |
| 2.21 |
5.70 |
4.70 |
4.70 |
3.94 |
| 2.94 |
4.86 |
4.13 |
4.13 |
3.31 |
| Groundnut oil |
0.37 |
5.82 |
4.64 |
4.65 |
4.83 |
| 0.74 |
4.68 |
3.80 |
3.67 |
3.91 |
| 1.47 |
3.92 |
3.21 |
3.21 |
3.12 |
| 2.21 |
2.86 |
2.35 |
2.35 |
2.60 |
| 2.94 |
2.68 |
2.24 |
2.22 |
2.36 |
Equilibrium modelling
The active extraction equilibrium for PCA using the TBP extractant in canola oil and groundnut oil is described by the law of mass action79 represented as:| |  | (7) |
where α is the TBP solvation number. The PCA–TBP complex is produced at the interphase and the molecule transfer is initiated very rapidly into the organic phase. The mass action law80 is used to calculate the number of reacting extractant molecules and the extraction constant at equilibrium (K11) which is the ratio of the product molecule concentration to reactant molecule concentration:| |  | (8) |
where [CPCA]aq is the aqueous phase PCA concentration, [Corg] is the organic phase concentration, and [CPCA·Cα]org is the equilibrium concentration of the complex in the organic phase. The dissociation of the carboxylic acid is considered negligible and hence eqn (8) can be simplified to obtain:| | log(KD) = log(K11) + α![[thin space (1/6-em)]](https://www.rsc.org/images/entities/char_2009.gif) log[Corg] log[Corg] | (9) |
where the organic phase concentration [C]org is expressed as:| | | [Corg] = [C0org] − α[CPCA]org | (10) |
The value of solvation number α for PCA can be considered to be one because the aliphatic carboxylic acids were similar to the carboxyl groups on each acid.81 The values of K11 for canola and groundnut oil are presented in Table 5. The K11 values from the MAL model show a good fit to the experimental values. The parity plot with the data points indicated in Fig. 7 is within ±10%. The reactive extraction equilibria for the recovery of PCA with TBP in canola and groundnut oil can be described by the MAL model.
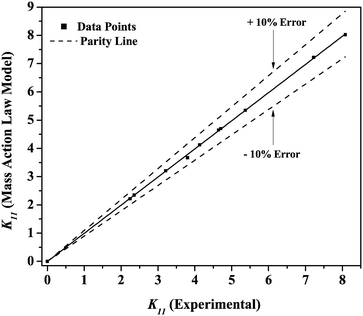 |
| | Fig. 7 Parity plot for mass action law model-predicted K11 for reactive extraction of PCA using TBP in canola oil and groundnut oil. | |
The relationship between K11 and relative basicity is given by the model of relative basicity82 in which the hydrophobicity (log![[thin space (1/6-em)]](https://www.rsc.org/images/entities/char_2009.gif) P), the apparent basicity of the extractant to hydrochloric acid (pKb), and the acid dissociation constant (pKa) are the significant governing factors of extraction equilibrium. The nature of the diluent, extractant, and solute and the solvating power comparative to those of the extractant mixture are represented by the relative basicity,83 and the model is expressed as:82
P), the apparent basicity of the extractant to hydrochloric acid (pKb), and the acid dissociation constant (pKa) are the significant governing factors of extraction equilibrium. The nature of the diluent, extractant, and solute and the solvating power comparative to those of the extractant mixture are represented by the relative basicity,83 and the model is expressed as:82
| | | log(K11) = [ξ1(pKb − pKa) + log(ξ2P)] | (11) |
where
ξ1 and
ξ2 are constants. The
K11 values computed from the relative basicity model are listed in
Table 5. The
K11 values obtained from the relative basicity model comply with the values of the experimental equilibrium extraction constant. The
K11 values were observed to be in the range of 8.02 to 4.13 in canola oil and 4.65 to 2.22 in groundnut oil for varying concentration of the TBP inorganic phase. Canola oil revealed higher values of
K11 than groundnut oil as diluents. Hence, canola oil with TBP is preferred more for the extraction of PCA by reactive extraction. The predicted
K11 values of the relative basicity model in the form of a parity plot are shown in
Fig. 8. The values obtained from the relative basicity model for PCA by reactive extraction using TBP in canola oil and groundnut oil are within ±10% and can be considered to agree well with the experimental values.
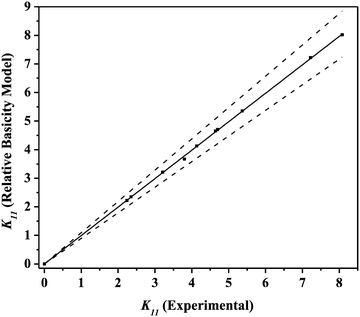 |
| | Fig. 8 Parity plot for relative basicity model-predicted K11 for reactive extraction of PCA using TBP in canola oil and groundnut oil. | |
The physical interactions are weak as compared to the chemical interactions between the complex acid–extractant components. The modelling of equilibrium characteristics of PCA can be performed by hypothesizing the stoichiometric complex formation between the PCA and extractant. Interpretation of equilibrium data can be conducted with the help of a simple and practically useful Langmuir type of isotherm model.84 In this model, the organic phase with the individual complexes was identified, and the relevant process parameters for the overall extraction were determined as:
| |  | (12) |
where
n = [
CTBP]
maxorg/[
CTBP]
0org for a concentration range which was assumed to be constant. The modelled
K11 values for canola oil and groundnut oil are in accordance with the experimental
K11 values (
Table 5). The parity plot for the Langmuir model is depicted in
Fig. 9, and the combined data is within ±10% (except for 2 to 3 data points). Therefore, the PCA recovery by reactive extraction with TBP in canola oil and groundnut oil can be described by the Langmuir model.
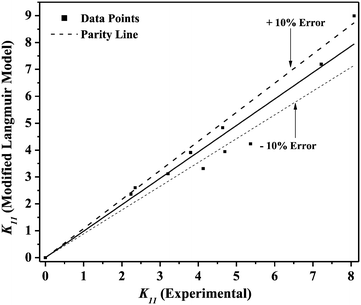 |
| | Fig. 9 Parity plot for modified Langmuir model-predicted K11 for reactive extraction of PCA using TBP in canola oil and groundnut oil. | |
The various models (RBM, MAL, and LM) were studied to comprehend the equilibrium behaviour for the reactive extraction of PCA. The model-predicted K11 values are listed in Table 5. The model accuracy based on the K11 values follows the trend: RBM > MAL > LM. The parity plots also follow the same trend. Hence the equilibrium behaviour of PCA using TBP in canola oil and groundnut oil can be best explained by the relative basicity model.
The average KD,PCA, average E%, zPCA, and K11 values for canola oil and groundnut oil have different values possibly due to their typical fatty acid composition.46,85Table 6 shows the typical range of fatty acid composition in canola oil and groundnut oil used as diluents in the study. The recovery of PCA might be a concern due to the free fatty acids present in canola oil and groundnut oil. Pre-treating the natural, non-toxic oils with DI water at 80 °C (353.15 K) avoids this complication by removal of free fatty acids by back extraction.71 The concentration of linoleic acid, palmitic acid, and stearic acid is low, and that of linolenic acid and oleic acid is high in canola oil which might be the reason for better extraction in contrast to groundnut oil.
Table 6 Typical composition of fatty acids (%) in canola oil and groundnut oil used as natural, non-toxic diluentsa
| Fatty acid |
Structure |
Canola oil |
Groundnut oil |
|
Typical values adopted from Gunstone, F. Fatty Acid and Lipid Chemistry; Blackie: London, 1996, and other sources.
|
| Palmitic acid |

|
4 |
13 |
| Stearic acid |

|
2 |
3 |
| Oleic acid |

|
56 |
38 |
| Linolenic acid |

|
10 |
— |
| Linoleic acid |

|
26 |
41 |
| Other |
— |
2 |
5 |
The measure of polarity of the solvent and its capability to insulate charges from one another is the dielectric constant. It signifies the ability of the solvent to act as a donor of the hydrogen bond. Canola oil is seen to exhibit maximum values of average KD,PCA and average E% compared to groundnut oil probably due to its high dielectric coefficient (Table 2).
Process consideration
A conceptual design of an integrated fermentation–separation process is presented in Fig. 10. There are several ISPR configurations possible depending on the location of the separation unit concerning the fermentation system. The potential toxic effect of extractants on the microorganism growth and metabolite production is the significant factor in determining an appropriate ISPR configuration for a bioprocess. The fermentation broth consisting of microbial cells is retained, and the broth is then introduced into the reactive extraction column for the recovery of PCA produced by biosynthesis. The reversible chemical PCA–TBP complex along with the diluents is then sent to a back-extraction column. The PCA can be recovered back to the aqueous phase by temperature-swing extraction in the presence of low molecular weight amine at moderately high temperature where the equilibrium favours the transfer of PCA to the aqueous phase. It was used in a lab experiment earlier for the recovery of propionic acid.40 Tri-methyl amine (TMA) is water soluble and promotes the back-extraction of PCA from the organic phase by the formation of amides at slightly elevated temperature. The PCA can be finally recovered by crystallization and can be utilized for various pharmaceutical applications.
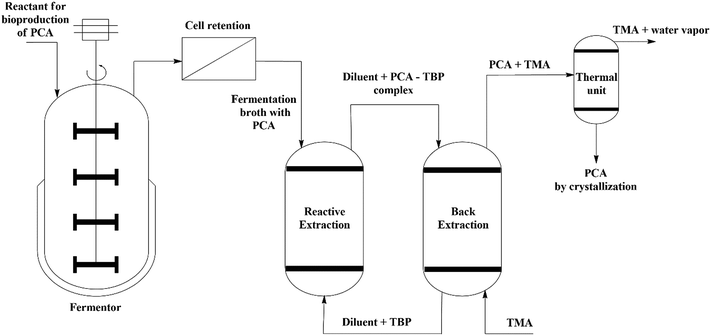 |
| | Fig. 10 A conceptual design of the ISPR configuration for the biosynthesis, separation, and recovery of PCA by reactive extraction with TBP in natural non-toxic diluents (canola oil and groundnut oil). | |
The toxic effects can be reduced substantially by averting the direct contact of microorganisms with the organic phase. The solvents exhibiting low polarity and large molecular weight are reported to exhibit the least toxicity by Brink and Tramper.62 The findings of the present study addressed the problem of toxicity involved in the design of the ISPR configuration by rational employment of non-toxic natural diluents (canola and sunflower oil) with TBP as extractants.
Conclusion
Non-toxic natural diluents such as canola and groundnut oil with TBP for a reactive extraction system for PCA recovery were examined in this study with an initiative towards the development of ISPR-based PCA production. The equilibrium distribution of PCA into an aqueous–organic two-phase system with TBP as the reactive extractant has been elaborated. The nature of diluents was in close relationship with the simultaneous effects of physical and chemical interactions. The non-toxic, natural and inexpensive diluents (canola oil and groundnut oil) were used as solvents with and without TBP for recovery of PCA. The results were expressed in terms of KD,PCA, E%, zPCA, and KE values. Canola oil was observed to show greater average KD,PCA and average E% as compared to groundnut oil. The maximum E% of 90.01% was attained with KD,PCA of 9.01 for PCA with canola oil in TBP at 2.94 mol L−1. A 1![[thin space (1/6-em)]](https://www.rsc.org/images/entities/char_2009.gif) :
:![[thin space (1/6-em)]](https://www.rsc.org/images/entities/char_2009.gif) 1 PCA–TBP complex was observed, and no overloading of the extractant occurred as the loading ratio was less than 0.5. The RBM was best-suited compared to the MAL and LM showing the highest K11 values. The present study is significant as it addresses the toxic effects of diluents by the application of canola oil and groundnut oil which provides ease in the design configuration of ISPR for our future studies.
1 PCA–TBP complex was observed, and no overloading of the extractant occurred as the loading ratio was less than 0.5. The RBM was best-suited compared to the MAL and LM showing the highest K11 values. The present study is significant as it addresses the toxic effects of diluents by the application of canola oil and groundnut oil which provides ease in the design configuration of ISPR for our future studies.
Conflicts of interest
There are no conflicts to declare.
References
- K. Miura, H. Kikuzaki and N. Nakatani, J. Agric. Food Chem., 2002, 50, 1845–1851 CrossRef CAS PubMed.
- P. Li, X. Q. Wang, H. Z. Wang and Y.-N. Wu, Biomed. Environ. Sci., 1993, 6, 389–398 CAS.
- Y. Semaming, P. Pannengpetch, S. C. Chattipakorn and N. Chattipakorn, J. Evidence-Based Complementary Altern. Med., 2015, 1–11 Search PubMed.
- M. Ellnain-Wojtaszek, Acta Pol. Pharm., 1997, 54, 229–232 CAS.
- C. D. Kay, G. J. Mazza and B. J. Holub, J. Nutr., 2005, 135, 2582–2588 CrossRef CAS PubMed.
- P. Vitaglione, G. Donnarumma, A. Napolitano, F. Galvano, A. Gallo, L. Scalfi and V. Fogliano, J. Nutr., 2007, 137, 2043–2048 CrossRef CAS PubMed.
- C.-Y. Chao and M.-C. Yin, Foodborne Pathog. Dis., 2009, 6, 201–206 CrossRef CAS PubMed.
- X. Li, X. Wang, D. Chen and S. Chen, Funct. Foods Health Dis., 2011, 1, 232–244 CAS.
- T. Tanaka, T. Tanaka and M. Tanaka, J. Exp. Clin. Med., 2011, 3, 27–33 CrossRef CAS.
- B. Scazzocchio, R. Varì, C. Filesi, M. D'Archivio, C. Santangelo, C. Giovannini, A. Iacovelli, G. Silecchia, G. L. Volti and F. Galvano, Diabetes, 2011, 60, 2234–2244 CrossRef CAS PubMed.
- K. J. Kore, P. P. Bramhakule, R. M. Rachhadiya and R. V. Shete, Int. J. Pharm. Life Sci., 2011, 2, 909–915 CAS.
- G.-F. Shi, L.-J. An, B. Jiang, S. Guan and Y.-M. Bao, Neurosci. Lett., 2006, 403, 206–210 CrossRef CAS PubMed.
- C. Li, W. Jiang, H. Zhu and J. Hou, Pharm. Biol., 2012, 50, 413–419 CrossRef CAS PubMed.
- Z. Zhou, Y. Zhang, X.-R. Ding, S.-H. Chen, J. Yang, X.-J. Wang, G.-L. Jia, H.-S. Chen, X.-C. Bo and S.-Q. Wang, Antiviral Res., 2007, 74, 59–64 CrossRef CAS PubMed.
- L. A. Pacheco-Palencia, S. Mertens-Talcott and S. T. Talcott, J. Agric. Food Chem., 2008, 56, 4631–4636 CrossRef CAS PubMed.
- J.-H. Lee, H.-J. Lee, H.-J. Lee, W.-C. Choi, S.-W. Yoon, S.-G. Ko, K. S. Ahn, S.-H. Choi, K.-S. Ahn and J. C. Lieske, Phytomedicine, 2009, 16, 188–197 CrossRef CAS PubMed.
- A. B. Lende, A. D. Kshirsagar, A. D. Deshpande, M. M. Muley, R. R. Patil, P. A. Bafna and S. R. Naik, Inflammopharmacology, 2011, 19, 255–263 CrossRef CAS PubMed.
- A. R. Borate, A. A. Suralkar, S. S. Birje, P. V. Malusare and P. A. Bangale, Int. J. Pharma Bio Sci., 2011, 2, 456–460 CAS.
- C. Ou, N. Shi, Q. Yang, Y. Zhang, Z. Wu, B. Wang, R. W. Compans and C. He, PLoS One, 2014, 9, 1–8 Search PubMed.
- C. B. Ou, Q. Pang, X. Chen, N. Hou and C. He, Poult. Sci., 2012, 91, 1604–1609 CrossRef CAS PubMed.
- N. Okai, T. Miyoshi, Y. Takeshima, H. Kuwahara, C. Ogino and A. Kondo, Appl. Microbiol. Biotechnol., 2016, 100, 135–145 CrossRef CAS PubMed.
- J.-J. Sun, D.-M. Zhou, H.-Q. Fang and H.-Y. Chen, Talanta, 1998, 45, 851–856 CrossRef CAS PubMed.
- K. M. Williams, W. E. Martin, J. Smith, B. S. Williams and B. L. Garner, Int. J. Mol. Sci., 2012, 13, 3765–3772 CrossRef CAS PubMed.
- M. K. Wilson, R. J. Abergel, K. N. Raymond, J. E. L. Arceneaux and B. R. Byers, Biochem. Biophys. Res. Commun., 2006, 348, 320–325 CrossRef CAS PubMed.
- Z. Mycroft, M. Gomis, P. Mines, P. Law and T. D. H. Bugg, Green Chem., 2015, 17, 4974–4979 RSC.
- Y. L. Chien, C. T. Ho, B. H. Chiang and L. S. Hwang, Food Chem., 2011, 126, 1586–1592 CrossRef CAS PubMed.
- J. Sarma and S. Mahiuddin, Colloids Surf., A, 2014, 457, 419–424 CrossRef CAS.
- B. S. De, K. L. Wasewar, V. R. Dhongde and P. B. Sontakke, Chem. Biochem. Eng. Q., 2018, 32, 19–28 CrossRef CAS.
- B. S. De, K. L. Wasewar, V. R. Dhongde, S. S. Madan and A. V. Gomase, Chem. Biochem. Eng. Q., 2018, 32, 29–39 CrossRef CAS.
- A. Buchan, L. S. Collier, E. L. Neidle and M. A. Moran, Appl. Environ. Microbiol., 2000, 66, 4662–4672 CrossRef CAS PubMed.
- C. M. Galanakis, E. Tornberg and V. Gekas, J. Food Eng., 2010, 99, 190–197 CrossRef CAS.
- F. J. Rivas, J. Frades, M. A. Alonso, C. Montoya and J. M. Monteagudo, J. Agric. Food Chem., 2005, 53, 10097–10104 CrossRef CAS PubMed.
- F. J. Benitez, J. Beltran-Heredia, J. L. Acero and T. Gonzalez, Water Res., 1996, 30, 1597–1604 CrossRef CAS.
- M. M. Khin, A. S. Nair, V. J. Babu, R. Murugan and S. Ramakrishna, Energy Environ. Sci., 2012, 5, 8075–8109 RSC.
- J. M. Woodley, M. Bisschops, A. J. J. Straathof and M. Ottens, J. Chem. Technol. Biotechnol., 2008, 83, 121–123 CrossRef CAS.
- K. K. Athankar, K. L. Wasewar, M. N. Varma and D. Z. Shende, New J. Chem., 2016, 40, 2413–2417 RSC.
- J. M. Wardell and C. J. King, J. Chem. Eng. Data, 1978, 23, 144–148 CrossRef CAS.
- A. S. Kertes and C. J. King, Biotechnol. Bioeng., 1986, 28, 269–282 CrossRef CAS PubMed.
- K. L. Wasewar, A. A. Yawalkar, J. A. Moulijn and V. G. Pangarkar, Ind. Eng. Chem. Res., 2004, 43, 5969–5982 CrossRef CAS.
- A. Keshav and K. L. Wasewar, Chem. Eng. Sci., 2010, 65, 2751–2757 CrossRef CAS.
- A. Keshav, K. L. Wasewar and S. Chand, Chem. Biochem. Eng., 2008, 22, 433–437 CAS.
- K. K. Athankar, M. N. Varma, D. Z. Shende, C. K. Yoo and K. L. Wasewar, J. Chem. Eng. Data, 2013, 58, 3240–3248 CrossRef CAS.
- A. Keshav, P. Norge and K. L. Wasewar, Appl. Biochem. Biotechnol., 2012, 167, 197–213 CrossRef CAS PubMed.
- M. D. Waghmare, K. L. Wasewar, S. S. Sonawane and D. Z. Shende, Sep. Purif. Technol., 2013, 120, 296–303 CrossRef CAS.
- K. L. Wasewar, D. Shende and A. Keshav, J. Chem. Technol. Biotechnol., 2011, 86, 319–323 CrossRef CAS.
- B. S. De, K. L. Wasewar, V. R. Dhongde, A. A. Ingle and H. Mondal, Chem. Eng. Res. Des., 2018, 132, 593–605 CrossRef CAS.
- H. Uslu, A. Gemici, A. Gök and S. I. Kırbaşlar, J. Chem. Eng. Data, 2014, 59, 3767–3772 CrossRef CAS.
- F. S. Oliveira, J. M. M. Araújo, R. Ferreira, L. P. N. Rebelo and I. M. Marrucho, Sep. Purif. Technol., 2012, 85, 137–146 CrossRef CAS.
- J. Marták and Š. Schlosser, Sep. Purif. Technol., 2007, 57, 483–494 CrossRef.
- M. Blahušiak, Š. Schlosser and J. Marták, Sep. Purif. Technol., 2013, 119, 102–111 CrossRef.
- K. Tonova, I. Svinyarov and M. G. Bogdanov, Sep. Purif. Technol., 2014, 125, 239–246 CrossRef CAS.
- A. Keshav, K. L. Wasewar and S. Chand, J. Chem. Technol. Biotechnol., 2009, 84, 484–489 CrossRef CAS.
- K. L. Wasewar, A. B. M. Heesink, G. F. Versteeg and V. G. Pangarkar, J. Chem. Technol. Biotechnol., 2002, 77, 1068–1075 CrossRef CAS.
- A. Keshav, K. L. Wasewar and S. Chand, Ind. Eng. Chem. Res., 2009, 48, 888–893 CrossRef CAS.
- K. L. Wasewar, D. Shende and A. Keshav, Ind. Eng. Chem. Res., 2011, 50, 1003–1011 CrossRef CAS.
- H. Uslu, S. İsmail Kırbaşlar and K. L. Wasewar, J. Chem. Eng. Data, 2009, 54, 712–718 CrossRef CAS.
- A. Keshav, K. L. Wasewar and S. Chand, Ind. Eng. Chem. Res., 2009, 48, 888–893 CrossRef CAS.
- F. M. Antony and K. L. Wasewar, J. Chem. Eng. Data, 2018, 63, 587–597 CrossRef CAS.
- V. Dhongde, K. L. Wasewar and B. S. De, Chemosphere, 2017, 188, 354–366 CrossRef CAS PubMed.
- K. Rewatkar, D. Z. Shende and K. L. Wasewar, J. Chem. Eng. Data, 2016, 61, 3217–3224 CrossRef CAS.
- H. Sharma, K. Singh, K. L. Wasewar and K. K. Athankar, J. Chem. Eng. Data, 2017, 62, 4047–4063 CrossRef CAS.
- L. E. S. Brink and J. Tramper, Biotechnol. Bioeng., 1985, 27, 1258–1269 CrossRef CAS PubMed.
- R. Bar and J. L. Gainer, Biotechnol. Prog., 1987, 3, 109–114 CrossRef CAS.
- M. Matsumura and H. Märkl, Biotechnol. Bioeng., 1986, 28, 534–541 CrossRef CAS PubMed.
-
G. T. Frank and K. K. Sirkar, Biotech. Bioeng. Symposium, Wiley, 1986, pp. 621–631 Search PubMed.
- T. Cho and M. L. Shuler, Biotechnol. Prog., 1986, 2, 53–60 CrossRef CAS PubMed.
- N. Tik, E. Bayraktar and Ü. Mehmetoglu, J. Chem. Technol. Biotechnol., 2001, 76, 764–768 CrossRef CAS.
- T. Harington and M. M. Hossain, Desalination, 2008, 218, 287–296 CrossRef CAS.
- A. Kar, A. Bagde, K. K. Athankar, K. L. Wasewar and D. Z. Shende, J. Chem. Technol. Biotechnol., 2017, 2825–2834 CrossRef CAS.
- K. K. Athankar, K. L. Wasewar, M. N. Varma and D. Z. Shende, J. Ind. Eng. Chem., 2015, 22, 240–247 CrossRef CAS.
- Y. K. Hong, W. H. Hong and D. H. Han, Biotechnol. Bioprocess Eng., 2001, 6, 386–394 CrossRef CAS.
- M. Jung, B. Schierbaum and H. Vogel, Chem. Eng. Technol., 2000, 23, 70–74 CrossRef CAS.
- B. J. Levien, J. Phys. Chem., 1955, 59, 640–644 CrossRef CAS.
- V. Biźek, J. Horáček, M. Koušová, A. Heyberger and J. Procházka, Chem. Eng. Sci., 1992, 47, 1433–1440 CrossRef.
-
L. K. Doraiswamy and M. M. Sharma, Heterogeneous reactions: Analysis examples and reactor design, Vol. 1: Gas solid and solid-solid. reactions, 1984 Search PubMed.
- D. Datta, H. Uslu and S. Kumar, Chem. Eng. Res. Des., 2015, 95, 105–112 CrossRef CAS.
- Z. Gu, B. A. Glatz and C. E. Glatz, Biotechnol. Bioeng., 1998, 57, 454–461 CrossRef CAS PubMed.
- K. K. Athankar, K. L. Wasewar, M. N. Varma, D. Z. Shende and H. Uslu, Ind. Eng. Chem. Res., 2015, 29, 385–394 CAS.
- J. A. Tamada and C. J. King, Ind. Eng. Chem. Res., 1990, 29, 1333–1338 CrossRef CAS.
- K. L. Wasewar and D. Z. Shende, J. Chem. Eng. Data, 2010, 55, 4121–4125 CrossRef CAS.
- M. Niitsu and T. Sekine, Bull. Chem. Soc. Jpn., 1978, 51, 705–717 CrossRef CAS.
- Y. S. Ho, Water Res., 2003, 37, 2323–2330 CrossRef CAS PubMed.
- A. Keshav, S. Chand and K. L. Wasewar, J. Chem. Eng. Data, 2008, 53, 1424–1430 CrossRef CAS.
- U. Bauer, R. Marr, W. Rückl and M. Siebenhofer, Ber. Bunsenges. Phys. Chem., 1989, 93, 980–984 CrossRef CAS.
- B. S. De, K. L. Wasewar and V. Dhongde, Chem. Data Collect., 2018, 15, 244–253 CrossRef.
- D. Datta and S. Kumar, J. Chem. Eng. Data, 2014, 59, 1540–1548 CrossRef CAS.
- K. K. Athankar, K. L. Wasewar, M. N. Varma and Z. Diwakar, Sep. Sci. Technol., 2017, 52, 2696–2703 CAS.
- K. Rewatkar, D. Z. Shende and K. L. Wasewar, Sep. Sci. Technol., 2017, 4, 522–528 Search PubMed.
- D. Datta, M. E. Marti, H. Uslu and S. Kumar, J. Taiwan Inst. Chem. Eng., 2016, 66, 407–413 CrossRef CAS.
- K. A. Athankar, K. L. Wasewar, M. N. Varma and D. Z. Shende, J. Chem. Eng. Process Technol., 2017, 8, 1–5 CrossRef.
- K. K. Athankar, K. L. Wasewar, M. N. Varma and D. Z. Diwakar, Sep. Sci. Technol., 2017, 52, 2696–2703 CAS.
- N. Thakre, A. K. Prajapati, S. P. Mahapatra, A. Kumar, A. Khapre and D. Pal, J. Chem. Eng. Data, 2016, 61, 2614–2623 CrossRef CAS.
- D. Datta, B. V. Babu and S. Kumar, J. Chem. Eng. Data, 2017, 62, 3431–3436 CrossRef CAS.
- D. Pal and A. Keshav, J. Chem. Eng. Data, 2014, 59, 2709–2716 CrossRef CAS.
|
| This journal is © The Royal Society of Chemistry 2019 |
Click here to see how this site uses Cookies. View our privacy policy here.  *b,
Vicky
Dhongde
b and
Tanya
Mishra
c


![[x with combining double overline]](https://www.rsc.org/images/entities/i_char_0078_033f.gif) is the mean of the experimental values, xi is the value of experimental observation, and N is the number of experimental observations. The experimental uncertainties were within x ± 0.001.78
is the mean of the experimental values, xi is the value of experimental observation, and N is the number of experimental observations. The experimental uncertainties were within x ± 0.001.78
![[thin space (1/6-em)]](https://www.rsc.org/images/entities/char_2009.gif) 023 and 0.0173 and 17
023 and 0.0173 and 17![[thin space (1/6-em)]](https://www.rsc.org/images/entities/char_2009.gif) 583 in canola oil and groundnut oil, respectively. The findings suggest that the P and D values are related inversely. Dimerization occurs when the interactive forces between the solute–solute are more intense than the interactions between the solute–solvent.
583 in canola oil and groundnut oil, respectively. The findings suggest that the P and D values are related inversely. Dimerization occurs when the interactive forces between the solute–solute are more intense than the interactions between the solute–solvent.
![[double bond, length as m-dash]](https://www.rsc.org/images/entities/char_e001.gif) PO4−) rather than a carbonyl group which plays the particular role of an electron acceptor and donor.62 As a result, considerable recovery of PCA from aqueous solution using TBP was achieved, and an increase in KD,PCA and E% with the increase in TBP concentration was observed. Canola oil provides better solvation with TBP. Also, there are various percentages of a double bond containing polyunsaturated fatty acids present. These are the factors why the average KD,PCA and average E% of PCA for canola oil are higher than those of groundnut oil, hence favouring PCA extraction. It is worth noting that the values of KD,PCA and E% for TBP in canola oil and groundnut oil are comparable to those for di-(2-ethylhexyl)phosphoric acid (D2EHPA) in toluene, isobutyl acetate, and petroleum ether for the recovery of PCA by reactive extraction.58 This suggests that canola oil and groundnut oil are non-toxic natural diluents that can serve as possible alternatives to the conventional diluents thereby reducing the toxicity.
PO4−) rather than a carbonyl group which plays the particular role of an electron acceptor and donor.62 As a result, considerable recovery of PCA from aqueous solution using TBP was achieved, and an increase in KD,PCA and E% with the increase in TBP concentration was observed. Canola oil provides better solvation with TBP. Also, there are various percentages of a double bond containing polyunsaturated fatty acids present. These are the factors why the average KD,PCA and average E% of PCA for canola oil are higher than those of groundnut oil, hence favouring PCA extraction. It is worth noting that the values of KD,PCA and E% for TBP in canola oil and groundnut oil are comparable to those for di-(2-ethylhexyl)phosphoric acid (D2EHPA) in toluene, isobutyl acetate, and petroleum ether for the recovery of PCA by reactive extraction.58 This suggests that canola oil and groundnut oil are non-toxic natural diluents that can serve as possible alternatives to the conventional diluents thereby reducing the toxicity.


![[thin space (1/6-em)]](https://www.rsc.org/images/entities/char_2009.gif) :
:![[thin space (1/6-em)]](https://www.rsc.org/images/entities/char_2009.gif) 1 PCA–TBP complex as presented in Fig. 6 and the following equation holds:38
1 PCA–TBP complex as presented in Fig. 6 and the following equation holds:38
![[thin space (1/6-em)]](https://www.rsc.org/images/entities/char_2009.gif) :
:![[thin space (1/6-em)]](https://www.rsc.org/images/entities/char_2009.gif) 1 complex formation and low values of K11 can be attributed to the lesser solvation of the polar complexes.
1 complex formation and low values of K11 can be attributed to the lesser solvation of the polar complexes.


![[thin space (1/6-em)]](https://www.rsc.org/images/entities/char_2009.gif) log[Corg]
log[Corg]
![[thin space (1/6-em)]](https://www.rsc.org/images/entities/char_2009.gif) P), the apparent basicity of the extractant to hydrochloric acid (pKb), and the acid dissociation constant (pKa) are the significant governing factors of extraction equilibrium. The nature of the diluent, extractant, and solute and the solvating power comparative to those of the extractant mixture are represented by the relative basicity,83 and the model is expressed as:82
P), the apparent basicity of the extractant to hydrochloric acid (pKb), and the acid dissociation constant (pKa) are the significant governing factors of extraction equilibrium. The nature of the diluent, extractant, and solute and the solvating power comparative to those of the extractant mixture are represented by the relative basicity,83 and the model is expressed as:82


![[thin space (1/6-em)]](https://www.rsc.org/images/entities/char_2009.gif) :
:![[thin space (1/6-em)]](https://www.rsc.org/images/entities/char_2009.gif) 1 PCA–TBP complex was observed, and no overloading of the extractant occurred as the loading ratio was less than 0.5. The RBM was best-suited compared to the MAL and LM showing the highest K11 values. The present study is significant as it addresses the toxic effects of diluents by the application of canola oil and groundnut oil which provides ease in the design configuration of ISPR for our future studies.
1 PCA–TBP complex was observed, and no overloading of the extractant occurred as the loading ratio was less than 0.5. The RBM was best-suited compared to the MAL and LM showing the highest K11 values. The present study is significant as it addresses the toxic effects of diluents by the application of canola oil and groundnut oil which provides ease in the design configuration of ISPR for our future studies.


