
 Open Access Article
 This Open Access Article is licensed under a Creative Commons Attribution-Non Commercial 3.0 Unported Licence
Co2+ detection, cell imaging, and temperature sensing based on excitation-independent green-fluorescent N-doped carbon dots†
Lihong Shi *a,
Dan Changa,
Guomei Zhanga,
Caihong Zhanga,
Yan Zhanga,
Chuan Donga,
Lanling Chub and
Shaomin Shuang*a
*a,
Dan Changa,
Guomei Zhanga,
Caihong Zhanga,
Yan Zhanga,
Chuan Donga,
Lanling Chub and
Shaomin Shuang*a
aCollege of Chemistry and Chemical Engineering, Shanxi University, Taiyuan 030006, PR China. E-mail: shilihong@sxu.edu.cn; smshuang@sxu.edu.cn
bSchool of Light Industry and Food Engineering, Nanjing Forestry University, Jiangsu Province 210037, China
First published on 16th December 2019
Abstract
Green-fluorescent N-doped carbon dots (N-CDs) have been successfully fabricated using hydrothermal treatment of tyrosine and urea. The N-CDs obtained showed excitation-independent emission, superior stability and strong photoluminescence with a quantum yield of ca. 9.8%. Based on these striking behaviors, the as-prepared N-CDs have been utilized in Co2+ detection and temperature sensing. Due to an inner filter effect, the N-CDs obtained were dramatically quenched by Co2+ with linear ranges of 0.1 μM–10 μM, 25 μM–275 μM and 300 μM–400 μM, and they had a detection limit of 0.15 μM. The use of the as-prepared N-CDs has been extended to visualize Co2+ fluctuations in living cells. Additionally, the N-CDs obtained have also been applied for use as a temperature sensor with a linear range of 25–80 °C.
1. Introduction
Carbon dots (CDs) are regarded as an exquisite class of carbon nanomaterial, with a quasi-spherical diameter of less than 10 nm, which were accidentally discovered during the purification of crude carbon nanotubes in 2004.1,2 On account of their excellent photoluminescence (PL), ease of functionalization, superior water-solubility and relatively low toxicity, CDs have become excellent alternatives to other fluorescent nanoparticles for extensive applications in sensing,3–8 bioimaging,9,10 drug delivery,11,12 medical diagnosis,13 fingerprint detection14,15 and photocatalysis.16 Currently, considerable efforts have been committed to exploring preparation methods of CDs including laser ablation,17 electrochemical oxidation,18 pyrolysis,19 microwave-assisted synthesis,7,20–22 hydrothermal methods,23,24 and so on. However, in these versatile synthetic approaches, the hydrothermal method demonstrates several distinguishing characteristics including simple operation, environmental friendliness and easy control.Recently, to gain CDs with better PL properties, heteroatom doping has become a topic of topical interest.25–27 As a common dopant in the synthesis of CDs, nitrogen (N) atoms have a similar atomic size and five valence electrons, which can bond strongly with the carbon atoms and give the CDs potential active sites.28–30 Liu et al.25 used citric acid and ethylenediamine to fabricate N-doped CDs (N-CDs) by a hydrothermal method which exhibited a quantum yield (QY) of 58.6%. Bu et al.31 used chrysanthemum buds as a carbon source and ethylenediamine as a N source to obtain blue fluorescent N-CDs with a QY of 28.5% which were employed as a sensing platform to detect curcumin. Karali et al.32 synthesized N-CDs achieving a high QY of 54% which were applied to testing nitrite, nitrate and ferric ions in food samples. However, these N-CDs generally exhibited blue fluorescence, which limited practical applications under biological conditions. Therefore, it is of urgent need to fabricate fluorescent CDs with a long-wavelength emission.
Temperature, being a critical thermodynamic parameter, plays an important role in diverse environments.33 Thus, accurate temperature measurement is essential. A lot of effort has been made to accurately measure the temperature, using scanning probe microscopy, Raman spectroscopy and fluorescence spectrophotometry.34–36 Additionally, numerous fluorescent nanomaterials including semiconductor quantum dots,33 fluorescent polymers,37 and organic dyes38 have been developed for use as temperature sensors. To date, many CD-based temperature probes have been developed. Chen et al.36 reported organosilane-functionalized CDs for use as temperature probes. Shi et al.39 developed N,S-CDs for the detection of intracellular temperature. Du et al.40 synthesized N,P-CDs for a temperature sensing platform with remarkable selectivity and specific reversibility. However, the investigation on CD-based temperature probes is still at a relatively early stage and therefore there is still potential for extensive research.
Cobalt is a significant microelement for humans and plays a vital role in sustaining normal life activities. Generally, cobalt ingestion occurs in ordinary living through diet and breath. Excessive cobalt uptake leads to multifarious diseases including contact dermatitis, allergic asthma, and thyroid damage or even death. As a result, CDs have been employed to construct Co2+ sensors by virtue of their high sensitivity and convenience. Han et al.41 developed glutathione-functionalized fluorescent CDs as a Co2+ sensor. Wen et al.42 reported green fluorescent CDs for Co2+ sensing in living cells. Kong et al.43 showed CDs which were an effective sensing platform with high sensitivity towards Co2+. However, CD-based Co2+ probes are still relatively rare, and thus, further development is highly desired.
In this work, an easy and economical method is presented which produces bright green fluorescent N-CDs using tyrosine and urea. Due to their high fluorescent QY, low-toxicity, excitation-independent emission and remarkable stability, the synthesized fluorescent N-CDs have been utilized as fluorescent nanosensors based on the inner filter effect (IFE) for the detection of Co2+. Confocal fluorescent imaging of SMMC-7721 cells indicates that the as-prepared N-CDs could be used to visualize Co2+ fluctuations in living cells. Moreover, the as-prepared N-CDs were employed as a temperature probe.
2. Experimental section
2.1. Materials
Urea was obtained from Sigma Aldrich Trading Co., Ltd (Shanghai, China). The AlCl3, CoCl2, FeCl3, HgCl2, MgCl2, NaBr, NaCl, NaF, NaH2PO4, NaNO2, NaNO3, Na2CO3, Na2HPO4, Na2SO3, Na2SO4, Na2S2O3, Na3PO4, and ZnCl2 were all obtained from Beijing Chemical Corp (Beijing, China). All the amino acids including alanine, arginine, aspartic acid, glutamic acid, histidine, isoleucine, leucine, methionine, phenylalanine, proline, threonine, tyrosine, and valine were obtained from the Shanghai Aladdin Reagent Co., Ltd. (Shanghai, China). In all the experiments, distilled deionized (DDI) water (≥18 MΩ cm) was used.2.2. Fabrication of N-CDs
Green emission N-CDs were successfully obtained using a one-step hydrothermal strategy. Firstly, 0.2 g of tyrosine and 0.5 g of urea were weighed and then dissolved in 10 mL of DDI water. The mixed solution of urea and tyrosine was sealed in a 20 mL Teflon-lined stainless steel autoclave and then maintained at 200 °C for 3 h. After the reaction, the suspension was centrifugated under 4000 rpm for 0.5 h and further dialyzed with a dialysis membrane. Finally, the N-CD aqueous solution was freeze-dried to obtain a solid sample for further use.2.3. Detection of Co2+
The determination of Co2+ was conducted in 10 mM phosphate buffered saline (PBS) at pH = 7. Firstly, 0.05 mL of N-CD aqueous solution (1.4 mg mL−1) was added into 0.5 mL PBS at pH = 7. Then, various concentrations of Co2+ were added and the spectra of the fluorescence intensity were collected after reaction for 60 s.2.4. Cell imaging
In a 5% CO2 incubator, Human hepatoma cellular carcinoma (SMMC-7721) cells were cultured in Dulbecco's Modified Eagle Medium (DMEM) supplemented with 10% fetal bovine serum at 37 °C. The N-CD aqueous solution (300 μL, 1.4 mg mL−1) was added to the culture medium (1.0 mL). The SMMC-7721 cells were cultured in 0.25% trypsin/0.020% EDTA, and the cells were washed three times with PBS for (1.0 mL each). Immediately, the fluorescence images were captured using a laser scanning confocal microscope (LSCM). After that, N-CD-stained SMMC-7721 cells were treated with Co2+ (400 μM) in PBS for about 90 s. At the same conditions as above previously, fluorescence images were captured with the LSCM.3. Results and discussion
3.1. Preparation of N-CDs
As shown in Fig. 1, the green-emission N-CDs were successfully fabricated using tyrosine and urea with a hydrothermal method. Tyrosine and urea as the carbon source and nitrogen source, respectively, were employed to produce the remarkable emissive N-CDs. The formation mechanism of as-prepared N-CDs may include several stages involving dehydration, polymerization, aromatization, carbonization, and nuclear burst in the hydrothermal process.44 The N-CD solution obtained was brownish yellow under daylight and well-dispersed.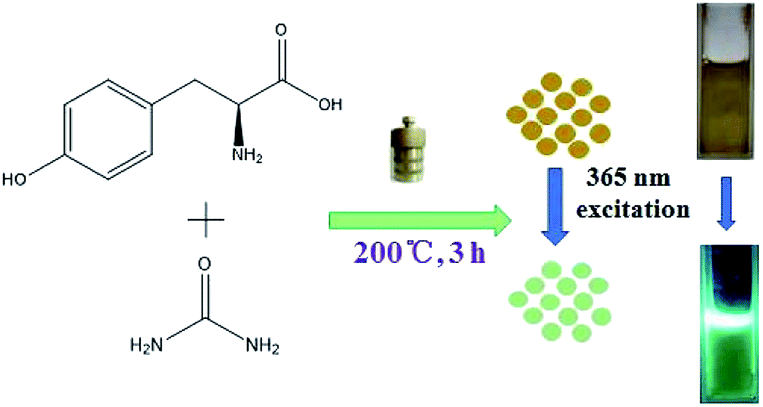 | ||
| Fig. 1 Schematic illustration of the preparation of N-CDs (photographs of the N-CDs obtained, under visible and UV (365 nm) light, respectively). | ||
3.2. Characterization of N-CDs
Transmission electron microscopy (TEM) was used to describe the morphology and size distribution of the N-CDs (Fig. 2). The as-prepared N-CDs were nearly spherical and well-dispersed. The size distribution of the N-CDs obtained was from 4.00 nm to 7.00 nm with an average diameter of 5.20 ± 0.93 nm. Moreover, the inset of Fig. 2(C) clearly shows a crystalline structure with a lattice spacing of 0.21 nm, which was in good agreement with the (101) facet of graphite.15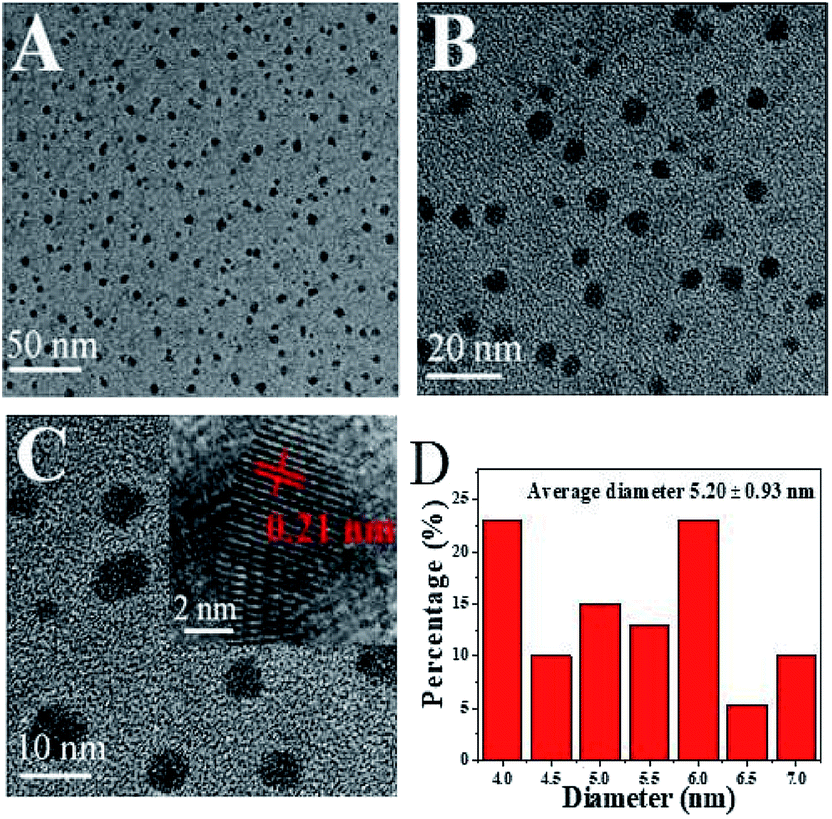 | ||
| Fig. 2 (A–C) TEM images of N-CDs under different magnifications (inset of (C) shows the HRTEM image of the N-CDs). (D) The size distribution of N-CDs. | ||
In addition, atomic force microscopy (AFM) was an effective tool to certify the surface topography of the N-CDs obtained. Fig. S1A and B (ESI†) show the topography and three-dimensional images of the N-CDs, which clearly revealed that the N-CDs obtained have excellent dispersibility. In Fig. S1C (ESI†) is shown a radial height distribution map along the line in the AFM topography image. As illustrated in Fig. S1D (ESI†), the height of the as-prepared N-CDs falls within the range of 3.50–5.00 nm, which obviously exhibits an average height of ca. 4.70 nm.
To explore the chemical composition and functional groups of the N-CDs obtained, X-ray photoelectron spectroscopy (XPS) measurements were carried out. The full scan spectrum revealed three obvious peaks at 282.6 eV, 399.2 eV and 529.4 eV, which were assigned to the elemental types of C1s, N1s and O1s (Fig. 3(A)), respectively. The high-resolution spectrum of C1s (Fig. 3(B)) can be decomposed into four peaks at 284.9 eV (C![[double bond, length as m-dash]](https://www.rsc.org/images/entities/char_e001.gif) C), 285.9 eV (C–O–C), 286.3 eV (C–O) and 288.9 eV (OC–O). In the N1s spectrum of the as-prepared N-CDs (Fig. 3(C)), two peaks at 401.0 eV and 402.1 eV were attributed to pyrrolic–N and N–H, respectively. The O1s spectrum of the N-CDs obtained (Fig. 3(D)) can be deconvoluted into three peaks at 531.6 eV (CO), 532.4 eV and 533.9 eV (C–O–C/C–OH), respectively. These demonstrate that the as-prepared N-CDs were mainly covered with hydroxyl and carboxyl groups.
C), 285.9 eV (C–O–C), 286.3 eV (C–O) and 288.9 eV (OC–O). In the N1s spectrum of the as-prepared N-CDs (Fig. 3(C)), two peaks at 401.0 eV and 402.1 eV were attributed to pyrrolic–N and N–H, respectively. The O1s spectrum of the N-CDs obtained (Fig. 3(D)) can be deconvoluted into three peaks at 531.6 eV (CO), 532.4 eV and 533.9 eV (C–O–C/C–OH), respectively. These demonstrate that the as-prepared N-CDs were mainly covered with hydroxyl and carboxyl groups.
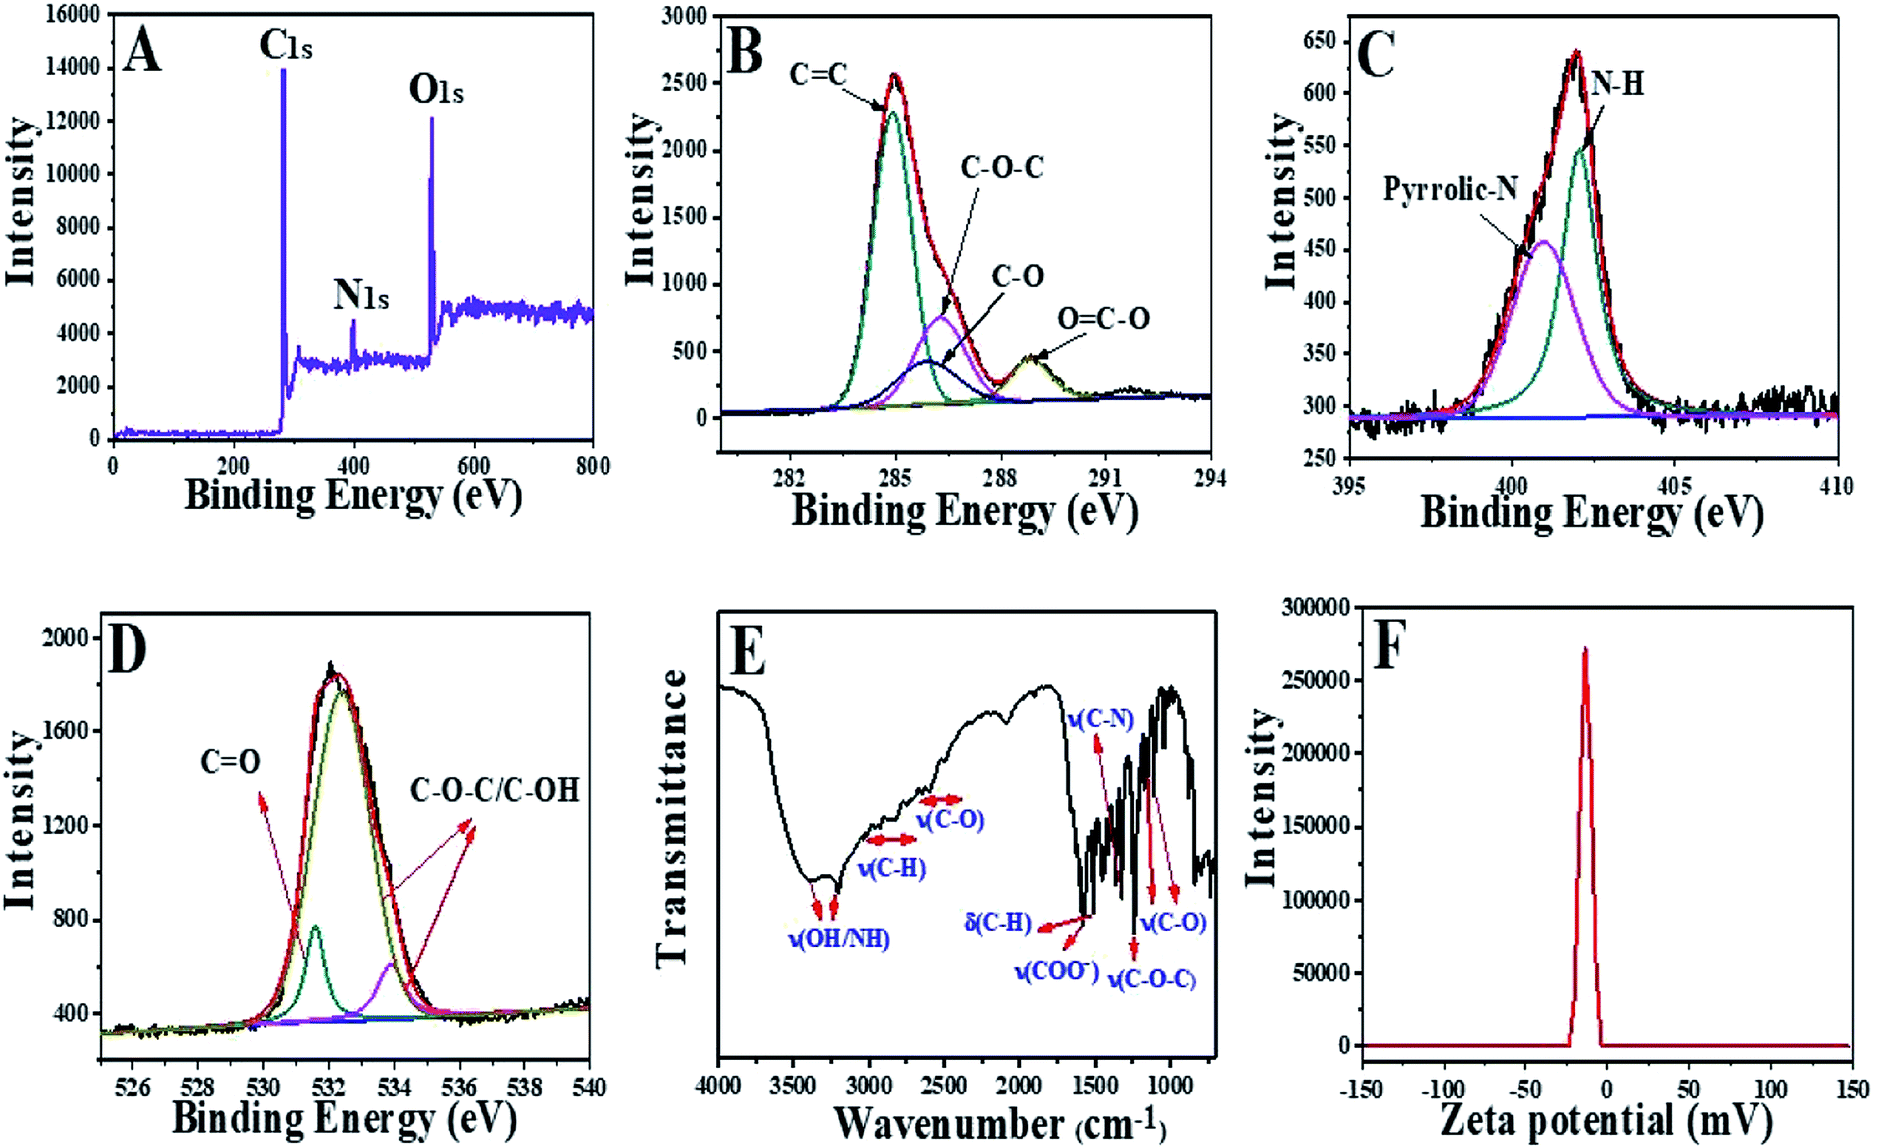 | ||
| Fig. 3 (A) Full XPS spectrum. (B) C1s, (C) N1s and (D) O1s spectra of N-CDs obtained. (E) FTIR spectrum. (F) Potential spectrum of N-CDs obtained. | ||
Simultaneously, Fourier transform infrared (FTIR) spectroscopy (Fig. 3(E)) was carried out to characterize the functional groups. The peaks at 3379.7 cm−1 and 3192.0 cm−1 were attributed to the stretching vibrations of O–H/N–H, and the peaks between 3027.1 cm−1 and 2729.3 cm−1 were assigned to the C–H stretching vibration. The peaks between 2682.3 cm−1 and 2603.8 cm−1 corresponded to the C–O stretching vibration. The stretching vibration of COO− was located in the absorption band at 1584.0 cm−1. The absorption peak at 1489.2 cm−1 was attributed to the C–H bending vibrations. The absorption peak at 1329.5 cm−1 was assigned to the C–N stretching vibration. The peak at 1238.1 cm−1 showed the presence of the C–O–C stretching vibration. There were two peaks present at 1144.0 cm−1 and 1104.8 cm−1, which were attributed to the C–O stretching vibration. The results were consistent with the results obtained with XPS. As shown in Fig. 3(F), the zeta potential of the N-CDs obtained was −20.2 mV, which strongly certified the presence of a certain negative charge and indicated that the carboxyl groups on the surface of the N-CDs obtained possessed partial ionization. The XRD pattern demonstrated a peak at approximately 2θ = 23.8°, as shown in Fig. S2 (ESI†), which was assigned to a graphitic structure. In the Raman spectrum of the as-prepared N-CDs (Fig. S3, ESI†), the D and G bands located at 1369 cm−1 and 1550 cm−1, respectively, were related to the sp3 carbon species and sp2 carbon networks. The intensity ratio of ID/IG was 0.88, which indicated that the N-CDs obtained contained a partially disordered graphite structure.
3.3. PL properties of N-CDs
The UV/vis spectrum and PL spectra described the optical properties of the as-prepared N-CDs. As shown in Fig. 4(A), there two absorption peaks were exhibited. The absorption peak at 240.2 nm was attributed to the π–π* transition of the CC band of the localized sp2 clusters in the core. The absorption peak at 287.0 nm was ascribed to the n–π* transition of the CO bands of the carboxyl groups on the shell of the N-CDs. In addition, the PL spectra of the as-prepared N-CDs under different excitation wavelengths were measured. When excited at 410 nm, the emission peak located at 518 nm (Fig. 4(B)), showed a green emission. When the excitation wavelengths were changed from 320 nm to 420 nm, the emission wavelengths were almost not shifted. There exhibits the excitation-independent emission phenomenon in Fig. 4(B), which is relevant to the influence of the surface passivation functionalization. The QY of N-CDs obtained is determined to be 9.8% using Rhodamine 6G as a reference. In addition, the stability of the N-CDs obtained was further investigated. Fig. S4A† shows that the PL intensities remained almost stable when the pH values were increased from 2.0 to 12.0. This result indicated that the PL intensity of the N-CDs obtained was independent of pH. Moreover, after excitation for 80 min, the PL intensities of the N-CDs nearly remained unchanged (Fig. S4B, ESI†), which showed that the photostability of the N-CDs was great.
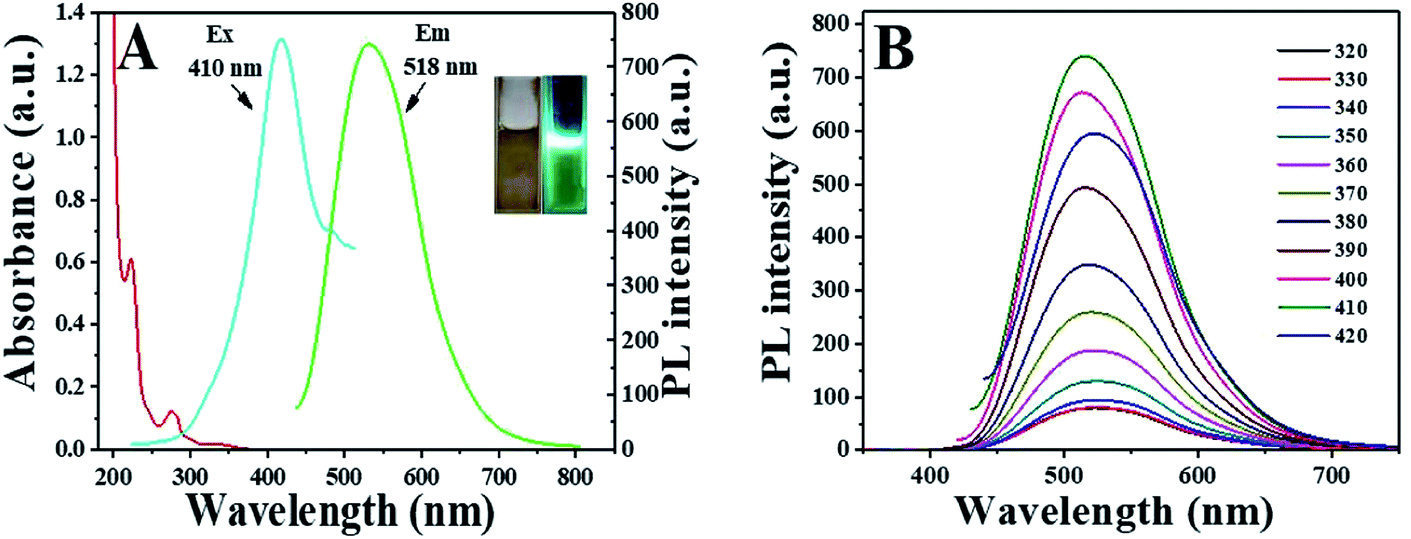 | ||
| Fig. 4 (A) UV-vis absorption spectra, PL spectra of N-CDs obtained (insets are photographs of N-CDs obtained under visible and UV (365 nm) light). (B) PL spectra of N-CDs obtained at different excitation wavelengths. | ||
3.4. Temperature sensing
The as-prepared N-CDs exhibit good temperature-sensitive behavior, which is a useful characteristic. As shown in Fig. 5(A), the fluorescence intensities of the N-CDs obtained gradually decrease with the increase of temperature from 25 °C to 80 °C, which exhibited a good linear relationship with a correlation coefficient (R2) of 0.98781 (inset of Fig. 5(A)). Significantly, the phenomenon may be attributed to the enhanced number of non-radiative channels of surface (trap/defect) states.40 The higher the temperature of the N-CDs is, the more the non-radiative channels would be activated and then more excited electrons would come back to the ground state via a non-radiative process, which would lead to the reduction of the fluorescence intensity.36 In addition, continuous heating and cooling cycles from 25 °C to 80 °C were conducted to verify the reversibility of the N-CDs obtained. As shown in Fig. 5(B), after eight consecutive cycles, the fluorescence intensity of the N-CDs obtained can still be recovered, which means that the change of temperature does not cause permanent damage to the surface fluorescent structure of the N-CDs obtained. The excellent reversibility indicates that the N-CDs obtained could have a potential application as a temperature sensor.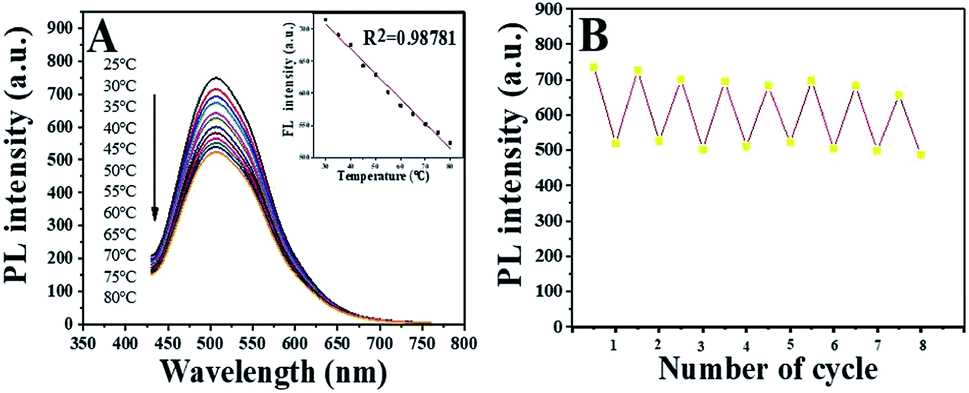 | ||
| Fig. 5 (A) PL spectra of N-CDs obtained in the temperature range of 25–80 °C (inset: the emission intensity as a function of temperature). (B) Reversible fluorescence response of eight consecutive cycles from 25 °C to 80 °C. | ||
3.5. Fluorescent detection of Co2+
To investigate the selectivity of the sensing system, the influence of various external substances, including ions and amino acids, on the PL intensity of the N-CDs obtained at pH = 7.0 were determined. Among these external substances, Co2+ showed the largest quenching of the fluorescence of the N-CDs obtained (Fig. 6(A) and (B)). Simultaneously, the Co2+ sensing capacity of the N-CDs was checked in range of 0 μM to 400 μM. As shown in Fig. 6(C), the fluorescence intensity of the N-CDs reduced progressively when the concentration of Co2+ increased gradually. More importantly, there was a remarkable linear dependence between F/F0 and Co2+ concentration in the range of 0.1 μM–10 μM, 25 μM–275 μM and 300 μM–400 μM as well as a detection limit of 0.15 μM, which was a lower value compared to those previously reported for the detection of Co2+. The principle of the IFE-based Co2+ experiment is described in Fig. 6(E). The effective IFE demands a complementary/overlap of the absorption spectrum of the absorbers and excitation and/or emission spectra of fluorophores.8,45–47 A good overlap between the emission spectrum of the as-prepared N-CDs and absorption band of Co2+ was observed, which confirmed the IFE mechanism of Co2+ sensing. Furthermore, the average fluorescence lifetimes of N-CDs and N-CDs/Co2+ were 3.53 ns and 3.60 ns, respectively, as shown in Fig. S5 (ESI†), which further suggested the occurrence of IFE.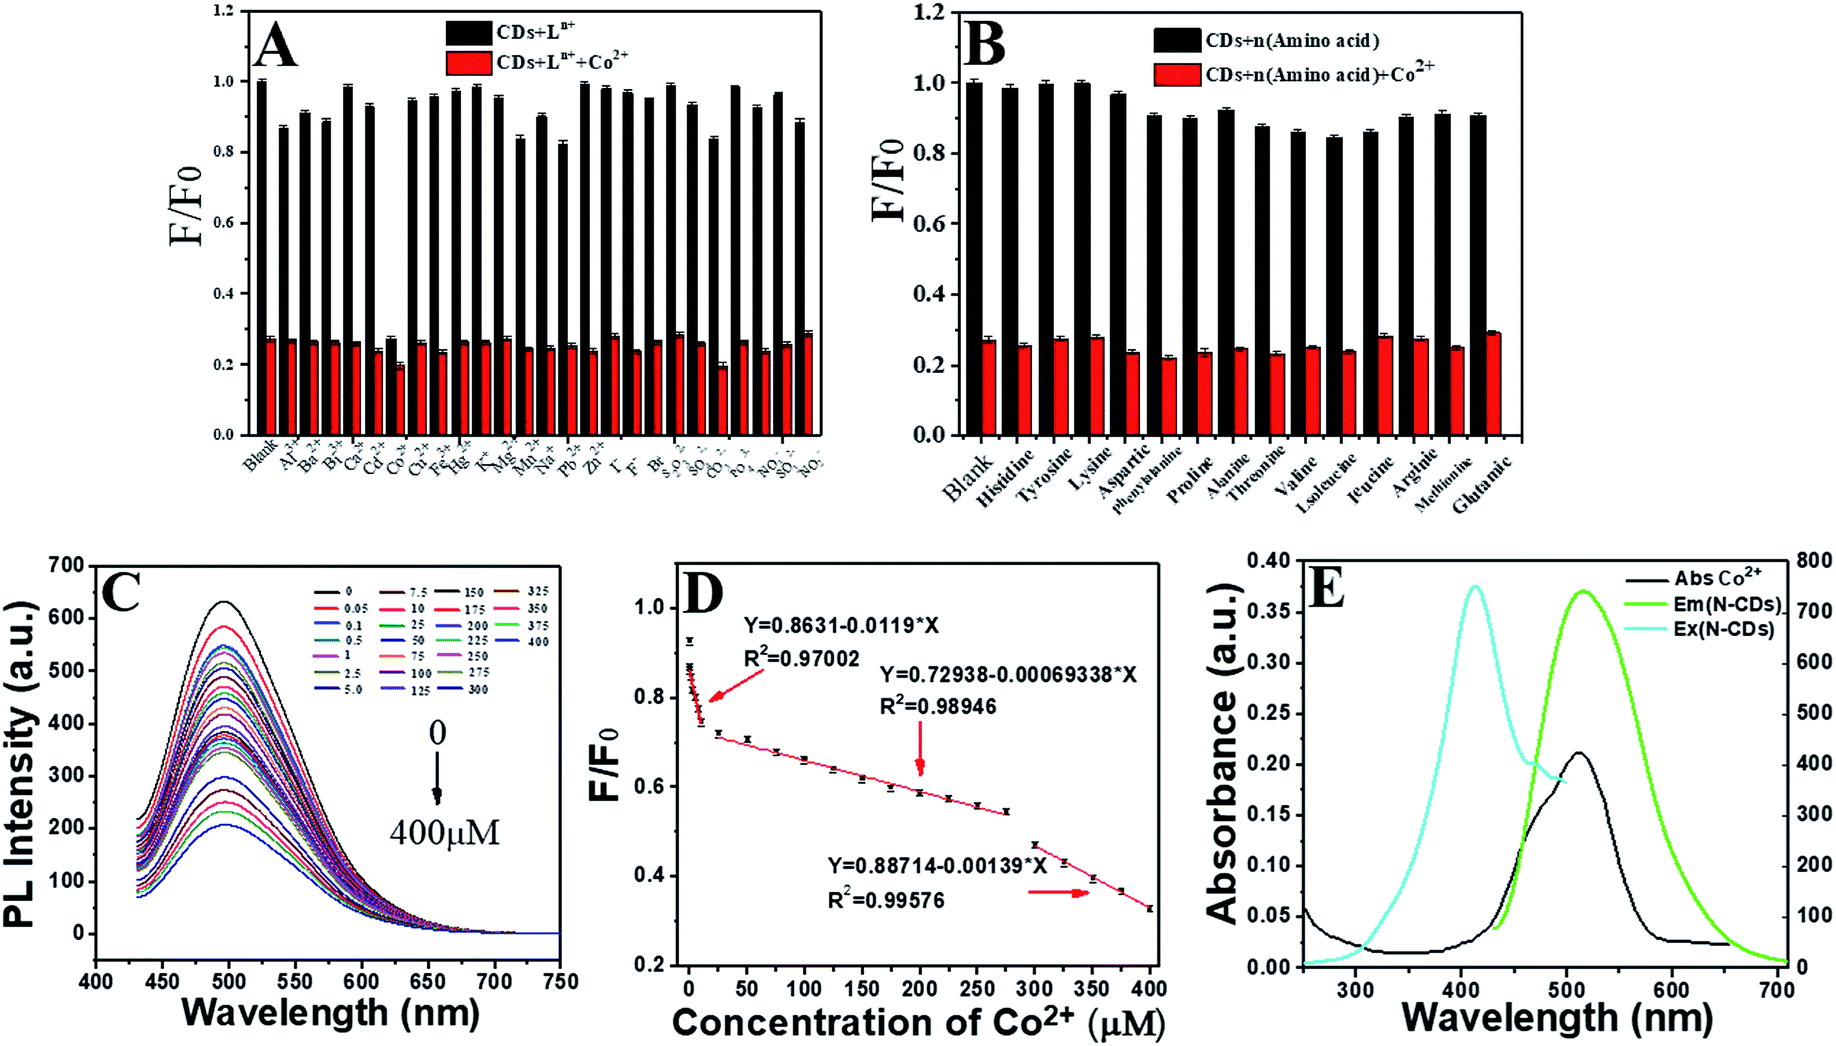 | ||
| Fig. 6 (A) Selectivity of the sensing method for Co2+ against other ions at pH 7.0 under 410 nm excitation. The black bars show the addition of ions (400 μM) to the N-CD solution. The red bars show the subsequent addition of 400 μM Co2+ to N-CDs/Ln+ solution (F0 and F correspond to the fluorescence intensity of the N-CDs in the absence and presence of external ions, respectively). (B) Selectivity of the N-CDs solution for Co2+ against amino acids at pH 7.0 under 410 nm excitation. The black bars show the addition of amino acids (400 μM) to the N-CD solution. The red bars show the subsequent addition of Co2+ (400 μM) to N-CDs/n(amino acid) solution (F0 and F correspond to the fluorescence intensity of the N-CDs in the absence and presence of external ions and amino acids). (C) Fluorescence spectra of the N-CDs obtained in the presence of Co2+ (concentrations in range of 0 μM–400 μM). (D) The relationship between F/F0 and Co2+ concentration (0 μM–400 μM). The linear relationship between F/F0 and Co2+ concentration (0.1 μM–10 μM, 25 μM–275 μM and 300 μM–400 μM). (E) Absorbance spectra of the Co2+, excitation and emission spectra of N-CDs obtained. | ||
3.6. Cytotoxicity assay
Cytotoxicity is a crucial and essential factor for biological imaging. The SMCC-7721 cells were selected as model cells and the MTT toxicity assay of the N-CDs obtained were estimated at concentrations increasing from 0 to 0.6 mg mL−1 for 24 h. As shown in Fig. 7, more than 80.1% of the SMCC-7721 cells survived, implying that the N-CDs obtained possessed ultralow toxicity and could be employed in a biological system.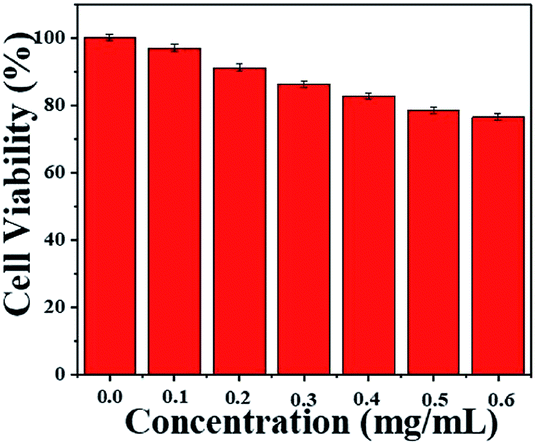 | ||
| Fig. 7 Cytotoxic effect of the N-CDs obtained on SMMC-7721 cells. | ||
3.7. Cellular imaging
As a model for in vitro imaging, the SMCC-7721 cells could quickly uptake the N-CDs obtained. As shown in Fig. 8, the N-CDs tagged the cells giving a bright blue color (Fig. 8(A1)), a green color (Fig. 8(A2)), and red fluorescence (Fig. 8(A3)) when excited with a 405 nm, 488 nm, and 547 nm laser, respectively. The merged images of the three panels are shown in Fig. 8(A4)–(A6). Upon the addition of Co2+, the fluorescence intensity weakened (Fig. 8(B)). Consequently, the N-CDs obtained could be applied to detect Co2+ in living cells.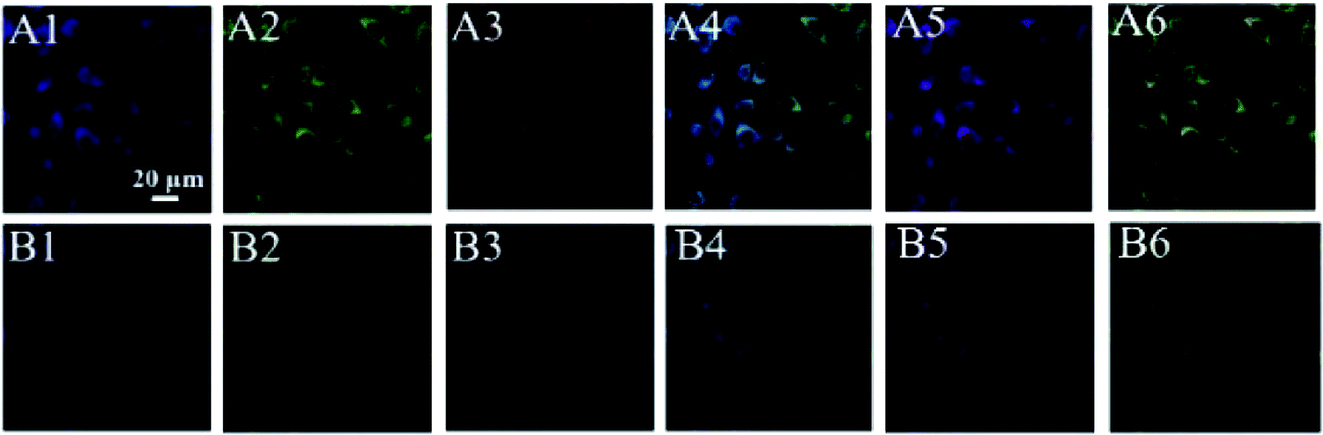 | ||
| Fig. 8 LSCM images of SMMC-7721 cells treated with the N-CDs obtained (0.42 mg mL−1) under 405 nm excitation (A1), 488 nm excitation (A2), and 547 nm excitation (A3). (A4) The merged image of (A1) and (A2). (A5) The merged image of (A1) and (A3). (A6) The merged image of (A2) and (A3). LSCM images of SMMC-7721 cells labelled with the N-CDs/Co2+ under 405 nm excitation (B1), 488 nm excitation (B2), and 547 excitation (B3). (B4) The merged image of (B1) and (B2). (B5) The merged image of (B1) and (B3). (B6) The merged image of (B2) and (B3). | ||
4. Conclusion
An environmentally friendly method is presented for the preparation of green fluorescent N-CDs using urea and tyrosine with a respectable QY of 9.8%. The as-prepared N-CDs exhibit good luminescence stability, excitation-independent emission, and strong fluorescence. Depending on these characteristics, the obtained N-CDs have been employed successfully in Co2+ detection based on the inner filter effect and temperature sensing. This research not only proposes a simple strategy to fabricate fluorescent N-CDs, but also demonstrates that N-CDs could be used to sense temperature and track Co2+ in actual samples and for other applications in the biomedical field.Conflicts of interest
There are no conflicts to declare.Acknowledgements
This work was supported by the National Natural Science Foundation of China (21575084), and the Natural Science Foundation of Shanxi Province (201701D121019 and 201701D121017). We also wish to acknowledge Dr Ying Zuo for her help with the AFM measurements and Dr Juanjuan Wang for her help with the Zeiss LSM880 confocal laser-scanning microscopy measurements at the Scientific Instrument Center at Shanxi University.Notes and references
- S. A. Rub Pakkath, S. S. Chetty, P. Selvarasu, A. Vadivel Murugan, Y. Kumar, L. Periyasamy, M. Santhakumar, S. R. Sadras and K. Santhakumar, ACS Biomater. Sci. Eng., 2018, 4, 2582–2596 CrossRef CAS.
- B. Zhu, S. Sun, Y. Wang, S. Deng, G. Qian, M. Wang and A. Hu, J. Mater. Chem. C, 2013, 1, 580–586 RSC.
- L. Shi, L. Li, X. Li, G. Zhang, Y. Zhang, C. Dong and S. Shuang, Sens. Actuators, B, 2017, 251, 234–241 CrossRef CAS.
- R. Bao, Z. Chen, Z. Zhao, X. Sun, J. Zhang, L. Hou and C. Yuan, Nanomaterials, 2018, 8, 386 CrossRef PubMed.
- P. A. Rasheed and N. Sandhyarani, Biosens. Bioelectron., 2017, 97, 226–237 CrossRef PubMed.
- Y. Hu, Z. Gao, J. Yang, H. Chen and L. Han, J. Colloid Interface Sci., 2019, 538, 481–488 CrossRef CAS PubMed.
- Y. Hu and Z. Gao, J. Hazard. Mater., 2020, 382, 121048 CrossRef CAS PubMed.
- Y. Hu and Z. Gao, Dyes Pigm., 2019, 165, 429–435 CrossRef CAS.
- I. J. Gomez, B. Arnaiz, M. Cacioppo, F. Arcudi and M. Prato, J. Mater. Chem. B, 2018, 6, 5540–5548 RSC.
- W.-J. Wang, J.-M. Xia, J. Feng, M.-Q. He, M.-L. Chen and J.-H. Wang, J. Mater. Chem. B, 2016, 4, 7130–7137 RSC.
- S. Ding, S. R. Das, B. J. Brownlee, K. Parate, T. M. Davis, L. R. Stromberg, E. K. L. Chan, J. Katz, B. D. Iverson and J. C. Claussen, Biosens. Bioelectron., 2018, 117, 68–74 CrossRef CAS PubMed.
- P. Gong, L. Sun, F. Wang, X. Liu, Z. Yan, M. Wang, L. Zhang, Z. Tian, Z. Liu and J. You, Chem. Eng. J., 2019, 356, 994–1002 CrossRef CAS.
- X. Gong, Q. Zhang, Y. Gao, S. Shuang, M. M. F. Choi and C. Dong, ACS Appl. Mater. Interfaces, 2016, 8, 11288–11297 CrossRef CAS PubMed.
- H.-J. Wang, T.-T. Yu, H.-L. Chen, W.-B. Nan, L.-Q. Xie and Q.-Q. Zhang, Dyes Pigm., 2018, 159, 245–251 CrossRef CAS.
- J. Chen, J.-S. Wei, P. Zhang, X.-Q. Niu, W. Zhao, Z.-Y. Zhu, H. Ding and H.-M. Xiong, ACS Appl. Mater. Interfaces, 2017, 9, 18429–18433 CrossRef CAS PubMed.
- R. Wang, K.-Q. Lu, Z.-R. Tang and Y.-J. Xu, J. Mater. Chem. A, 2017, 5, 3717–3734 RSC.
- H. Zhu, W. Zhang and S. F. Yu, Nanoscale, 2013, 5, 1797 RSC.
- X. Hou, Y. Li and C. Zhao, Aust. J. Chem., 2016, 69, 357 CrossRef CAS.
- C.-W. Lai, Y.-H. Hsiao, Y.-K. Peng and P.-T. Chou, J. Mater. Chem., 2012, 22, 14403 RSC.
- O. J. Achadu and N. Revaprasadu, Microchim. Acta, 2018, 185, 461 CrossRef PubMed.
- H. Yang, L. He, Y. Long, H. Li, S. Pan, H. Liu and X. Hu, Spectrochim. Acta, Part A, 2018, 205, 12–20 CrossRef CAS PubMed.
- R. Angamuthu, R. Rajendran and R. Vairamuthu, J. Fluoresc., 2018, 28, 959–966 CrossRef CAS PubMed.
- S. Ahmadian-Fard-Fini, M. Salavati-Niasari and D. Ghanbari, Spectrochim. Acta, Part A, 2018, 203, 481–493 CrossRef CAS PubMed.
- T. Shen, Q. Wang, Z. Guo, J. Kuang and W. Cao, Ceram. Int., 2018, 44, 11828–11834 CrossRef CAS.
- S. Liu, J. Cui, J. Huang, B. Tian, F. Jia and Z. Wang, Spectrochim. Acta, Part A, 2019, 206, 65–71 CrossRef CAS PubMed.
- J. Hou, H. Li, Y. Tang, J. Sun, H. Fu, X. Qu, Z. Xu, D. Yin and S. Zheng, Appl. Catal., B, 2018, 238, 225–235 CrossRef CAS.
- Y. Ma, Y. Song, Y. Ma, F. Wei, G. Xu, Y. Cen, M. Shi, X. Xu and Q. Hu, New J. Chem., 2018, 42, 8992–8997 RSC.
- W. Wei, C. Xu, L. Wu, J. Wang, J. Ren and X. Qu, Sci. Rep., 2015, 4, 3564 CrossRef PubMed.
- S. U. Lee, R. V. Belosludov, H. Mizuseki and Y. Kawazoe, Small, 2009, 5, 1769–1775 CrossRef CAS PubMed.
- B. Shi, Y. Su, L. Zhang, M. Huang, R. Liu and S. Zhao, ACS Appl. Mater. Interfaces, 2016, 8, 10717–10725 CrossRef CAS PubMed.
- L. Bu, T. Luo, H. Peng, L. Li, D. Long, J. Peng and J. Huang, Microchim. Acta, 2019, 12, 675 CrossRef PubMed.
- K. K. Karali, L. Sygellou and C. D. Stalikas, Talanta, 2018, 189, 480–488 CrossRef CAS PubMed.
- D. Zhou, M. Lin, X. Liu, J. Li, Z. Chen, D. Yao, H. Sun, H. Zhang and B. Yang, ACS Nano, 2013, 7, 2273–2283 CrossRef CAS PubMed.
- S. H. Kim, J. Noh, M. K. Jeon, K. W. Kim, L. P. Lee and S. I. Woo, J. Micromech. Microeng., 2006, 16, 526–530 CrossRef CAS.
- F. Narberhaus, T. Waldminghaus and S. Chowdhury, FEMS Microbiol. Rev., 2006, 30, 3–16 CrossRef CAS PubMed.
- P.-C. Chen, Y.-N. Chen, P.-C. Hsu, C.-C. Shih and H.-T. Chang, Chem. Commun., 2013, 49, 1639 RSC.
- Y. Jiang, X. Yang, C. Ma, C. Wang, H. Li, F. Dong, X. Zhai, K. Yu, Q. Lin and B. Yang, Small, 2010, 6, 2673–2677 CrossRef CAS PubMed.
- E. J. McLaurin, L. R. Bradshaw and D. R. Gamelin, Chem. Mater., 2013, 25, 1283–1292 CrossRef CAS.
- W. Shi, F. Guo, M. Han, S. Yuan, W. Guan, H. Li, H. Huang, Y. Liu and Z. Kang, J. Mater. Chem. B, 2017, 5, 3293–3299 RSC.
- F. Du, G. Li, X. Gong, G. Zhonghui, S. Shuang, M. Xian and C. Dong, Sens. Actuators, B, 2018, 277, 492–501 CrossRef CAS.
- B. Han, Y. Li, T. Peng, M. Yu, X. Hu and G. He, Anal. Methods, 2018, 10, 2989–2993 RSC.
- X. Wen, L. Shi, G. Wen, Y. Li, C. Dong, J. Yang and S. Shuang, Sens. Actuators, B, 2016, 235, 179–187 CrossRef CAS.
- D. Kong, F. Yan, Z. Han, J. Xu, X. Guo and L. Chen, RSC Adv., 2016, 6, 67481–67487 RSC.
- L. Shi, Y. Li, X. Li, X. Wen, G. Zhang, J. Yang, C. Dong and S. Shuang, Nanoscale, 2015, 7, 7394–7401 RSC.
- Q. Zhang, C. Zhang, Z. Li, J. Ge, C. Li, C. Dong and S. Shuang, RSC Adv., 2015, 5, 95054–95060 RSC.
- Y. Zhao, S. Zou, D. Huo, C. Hou, M. Yang, J. Li and M. Bian, Anal. Chim. Acta, 2019, 1047, 179–187 CrossRef CAS PubMed.
- B. Dong, H. Li, G. Mujtaba Mari, X. Yu, W. Yu, K. Wen, Y. Ke, J. Shen and Z. Wang, Food Chem., 2019, 294, 347–354 CrossRef CAS PubMed.
Footnote |
| † Electronic supplementary information (ESI) available. See DOI: 10.1039/c9ra09405a |
| This journal is © The Royal Society of Chemistry 2019 |