
 Open Access Article
 This Open Access Article is licensed under a Creative Commons Attribution-Non Commercial 3.0 Unported Licence
Equilibria and correlation of systems involving 1-hexyl-3-methylpyridinium trifluoromethanesulfonate†
R. Corcheroa,
A. Marcillabc,
M. M. Olayabc,
P. Carbonell-Hermidac and
A. Soto *a
*a
aCretus Institute, Department of Chemical Engineering, Universidade de Santiago de Compostela, E-15782 Santiago de Compostela, Spain. E-mail: ana.soto@usc.es
bChemical Engineering Department, University of Alicante, 03080 Alicante, Spain
cInstitute of Chemical Process Engineering, University of Alicante, Alicante, 03080, Spain
First published on 23rd December 2019
Abstract
Ionic liquids are being proposed for the improvement of many refinery-related applications where water and oil coexist. However, the lack of relevant thermodynamic data on equilibrium processes involving water, oil and an ionic liquid is a stumbling block. Phase diagrams of these systems are complex, with many different regions, especially when the ionic liquid is solid at room conditions. This greatly complicates modelling, which is usually neglected or carried out only partially. In this work, for the first time, the simultaneous correlation not only of liquid–liquid and liquid–liquid–liquid but also solid–liquid equilibrium data for ternary systems involving ionic liquids has been carried out. To that end, the ionic liquid 1-hexyl-3-methylpyridinium trifluoromethanesulfonate, with an alkyl chain length that favours nano-segregation, was selected. Phase diagrams with water and different representative oils (octane, toluene and cyclohexane) have been determined at various temperatures and atmospheric pressure. The great capacity of the NRTL model, a powerful tool used in all chemical process simulators, was shown by simultaneously correlating data from all the equilibrium regions. However, adequate equilibrium equations and pivotal strategies were required. Low deviations and a good representation of phase diagrams was achieved. A topological analysis based on the Gibbs common tangent criterion and a stability test allowed validation of the proposed correlation parameters.
1. Introduction
Null atmospheric contamination (due to their negligible vapour pressure) and possibilities of tuning for each specific application, are the main features of ionic liquids (ILs) that justify the current intensive research on these salts. They are being studied for implementation in technologies that offer an improvement from the point of view of the efficient use of raw materials and energy resources, with minimisation of environmental impacts. A huge number of these studies are focused on oil refinery processes despite their maturity: oil recovery, de-asphalting, metal removal, aromatic extraction, desulfurization, etc.1–3From oil extraction to petrochemical production, ILs are being proposed for the improvement of many stages where water and oil coexist. These salts can be used as: chemicals to change wettability or surfactants in enhanced oil recovery (EOR),4 gas hydrate inhibitors,5 demulsifiers or desalting agents once the oil is extracted,6 constituents of IL-based microemulsions in different reactions,7 etc. Kar et al.8 have recently indicated that one of the remaining issues in the practical application of ILs is clearly the lack of relevant thermodynamic data on equilibrium processes. In the case of refinery-related applications, studies on mixtures of hydrocarbons and ILs are common, however, the deficiency of research on phase equilibria of systems involving water and hydrocarbons is noticeable, in spite of the interest of the aforementioned processes.
Among all the families of ILs, those with butyl or longer side chains display nanoscale segregation8,9 as a consequence of the aggregation of the alkyl chains into non-polar domains. This nano-structuring determines the properties of these compounds and leads to interesting solvation capacities. Phase diagrams of these ILs with water and oil frequently involve multiphasic regions that must be rigorously determined in order to ensure the practicality of the proposed applications.
Some phase diagrams involving three liquid-phase systems can be found in literature aimed at the proposal of ILs as surfactants10,11 or co-surfactants12 in EOR. In addition, Hejazifar et al.7 highlighted the advantages of the use of surfactant ILs with water and oil to form stable microemulsions as media of catalytic reactions. Some of the proposals also show a triphasic behaviour.
If the number of experimental studies on phase equilibria involving systems with water, oil and IL is really scarce in the literature, their modelling is even less studied. Systems where only a biphasic region is found have been modelled using activity coefficient models13–15 or COSMO-SAC.14,15 Domanska et al.13 proposed the use of N-octylisoquinolinium bis(trifluoromethylsulfonyl)imide to recover 2-phenylethanol from aqueous solutions produced in its bio-synthesis. Tie-lines obtained in the biphasic system were adequately correlated by means of the NRTL model.16 This and UNIQUAC17 models were also successfully used to correlate liquid–liquid equilibrium data resulting from the recovery of different bio-oils (acetic acid, furfural14 and hydroxyacetone15) from aqueous solutions using 1-ethyl-3-methylimidazolium bis(trifluoromethylsulfonyl)imide or 1-butyl-3-methylimidazolium bis(trifluoromethylsulfonyl)imide ILs. The conductor-like screening model-segment activity coefficient (COSMO-SAC) model18 adequately predicted these phase diagrams for systems with acetic acid and furfural,14 but led to high deviations in the case of hydroxyacetone.15 In the case of water + IL + oil systems where simultaneous biphasic and triphasic regions appear, the difficulty of modelling drastically increases. Rodríguez-Palmeiro et al.10 satisfactorily predicted the three-phase behaviour using PC-SAFT.19 The NRTL model was also proposed to simultaneously correlate the different immiscible regions found in these systems.11 To that aim, some strategies were suggested to successfully apply the isoactivity algorithm. No modelling was found in literature for more complicated systems, for instance those that contain not only equilibria of liquid but also solid phases.
Due to the aforementioned interesting applications of systems involving IL, water and oil, the objective of this work is the determination of phase diagrams involving the IL 1-hexyl-3-methylpyridinium trifluoromethanesulfonate, water and different kinds of oils (octane, cyclohexane and toluene). A pyridinium cation was selected for the IL due to its greater biodegradability compared with imidazolium.20 A six carbon chain was selected in order to favour nanoscale segregation. Surprisingly, only one work using [C6C1py][OTf] was found in the literature. In that work,21 Domanska and col. studied the solubility of some ILs, including this triflate, in water and octanol.
The determination of the phase diagrams of the IL with water and oil is not the only purpose of this work. As this IL is solid at room temperature, the capacity of the NRTL model16 to simultaneously correlate the different liquid–liquid (LLE), liquid–liquid–liquid (LLLE) and solid–liquid equilibria (SLE) found in these complex phase diagrams is analysed. Pivotal strategies are required to achieve such a difficult goal.
2. Procedure
Materials
Double-distilled water was used throughout all the experiments. Compounds selected as oils were: n-octane (Sigma-Aldrich, >99.9 wt%), toluene (Sigma-Aldrich, >99.5 wt%) and cyclohexane (Riedel-de Haën, >99.5 wt%). These chemicals were stored with molecular sieves in order to avoid water uptake but no further purification was carried out. 1-Hexyl-3-methylpyridinium trifluoromethanesulfonate [C6C1py][OTf], was purchased from Iolitec with a purity > 97 wt%. To remove volatile contaminants, it was brought under high vacuum (<1 Pa) while heated at moderate temperature (ca. 340 K) for no less than 48 h. 1H and 13C nuclear magnetic resonance spectroscopy analyses were used to ensure the absence of relevant impurities.Methods
A Q2000 differential scanning calorimeter (TA Instruments) was used to determine the melting point of the IL. Applied heating rate was 5 K min−1. N2 (Praxair, 99.999%) was used as purge gas (50 mL min−1). From thermograms, onsets and midpoints were determined to calculate thermal events.
Water and oil mass fractions were determined by means of a Hewlett-Packard HP6890 series GC with a split injector, a TCD detector, and an HP-FFAP capillary column. An empty pre-column was used to prevent IL not retained in the liner reaching the column. IL composition was determined by difference from unity. To that aim, 1-butanol was used as diluent and 2-propanol as standard. Details of the chromatographic method are presented in Table 1.
| Column | HP-FFAP (25 m × 0.2 mm × 0.33 μm) |
| Detector type | TCD |
| Carrier gas | Helium (split ratio 1![[thin space (1/6-em)]](https://www.rsc.org/images/entities/char_2009.gif) :50) :50) |
| Injector temperature | 523.15 K, injection volume 1 μL |
| Detector temperature | 503.15 K |
| Flow rate | 1 mL min−1 |
| Column oven | 333.15 K (5 min for n-octane and cyclohexane, 7 min for toluene) |
| Ramp, 75 K min−1 up to 473.15 K | |
| 473.15 K (1 min) |
Correlation
The Gibbs common tangent condition was used to formulate the equilibrium equations required during correlation. This method is especially suitable when solid phases are present in the system. The NRTL model was used to calculate the dimensionless Gibbs energy of mixing (gM). The parameter αij was set to 0.2. The procedure simultaneously solves orthogonal derivatives, the tangent plane equations and the mass balances.22 These equations are described below for the different equilibrium regions.In the LLE region, where two liquid phases α and β are in equilibrium (tie-line), the following equations must be fulfilled:
 | (1) |
 | (2) |
 | (3) |
In the LLLE region three liquid phases α, β and γ are in equilibrium (tie-triangle) so the eqn (1)–(3) must be solved along with other equivalents where α or β is replaced by γ.
For those systems where SLE is also present, the following equation is imposed to guarantee the fulfillment of the common tangent plane to both solid and liquid phases:
 | (4) |
Some additional useful strategies were required to facilitate the convergence of the optimisation procedure, obtaining a unique set of correlation parameters to represent all the different equilibrium regions of the system at working temperature and pressure. These pivotal strategies are based on the step-by-step optimisation of correlation parameters: firstly fitting binary systems to obtain initial correlation parameters, secondly tie-triangle data are added, and finally SLE and LLE data are also incorporated. The convergence of the algorithm was further improved by using additional parameters related to mole fractions. More details can be seen in a previous paper.11
The optimisation of the NRTL model parameters was carried out using the GRG (Generalized Reduced Gradient) nonlinear method with the objective function defined as:
 | (5) |
The solutions obtained for all the correlations were checked to guarantee global stability and discard any possible metastable equilibrium solution.23
3. Results
Thermal characterisation
Td and Td,5% for [C6C1py][OTf] are 621.88 K and 595.58 K (TGA thermograms are presented in the ESI†). The latter value constitutes a more conservative value of the decomposition temperature that, in any case, is relatively high.A melting temperature (onset) of 335.7 K and also a solid–solid transition temperature at 308.96 K were found (DSC thermograms are presented in the ESI†). This is in accordance with results obtained by Domanska et al.21 for this IL. As they determined these values from midpoints, these were also calculated from our thermograms obtaining values of 337.69 K and 309.88 K for melting and solid transition temperature, in comparison to 337.76 K and 310.3 K reported by Domanska and col. The agreement is excellent, even when we have used different heating rates (5 K min−1 instead of 10 K min−1).
Phase equilibria
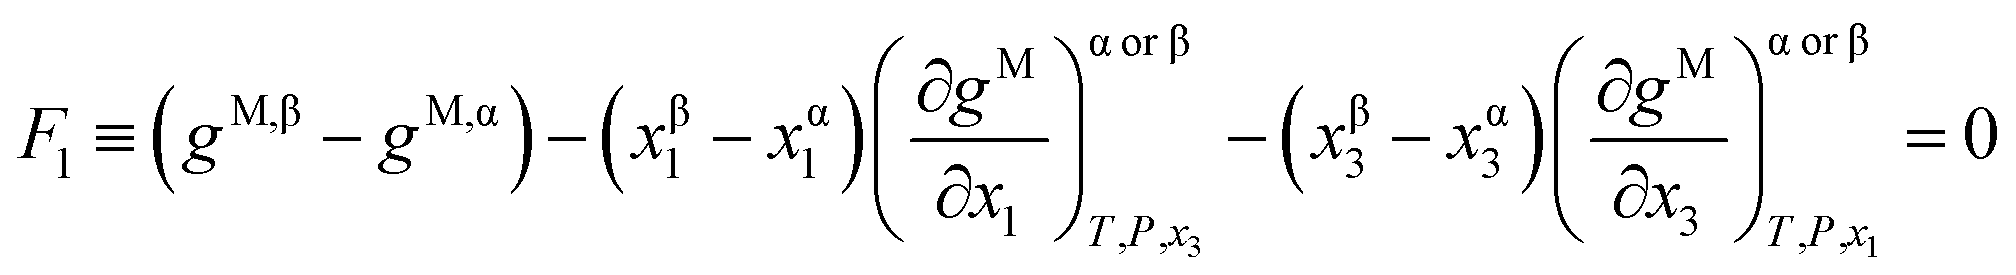
Phase diagrams for water + [C6C1py][OTf] + n-octane, water + [C6C1py][OTf] + toluene and water + [C6C1py][OTf] + cyclohexane, at 298.15 K and 323.15 K and atmospheric pressure are shown in Fig. 1–6. The IL is solid at both temperatures, thus in the diagrams different regions of LLE, LLLE and SLE were found. The corresponding equilibrium data are presented in the ESI.† | ||
Fig. 1 Phase diagram of the ternary system water (1) + [C6C1py][OTf] (2) + n-octane (3) at 298.15 K ( Exp, Exp,  Corr). Corr). | ||
Regarding the binary water + [C6C1py][OTf], Domanska et al.21 found a liquid–liquid immiscibility window with UCST at low concentrations of the IL. This fits perfectly with our results. Moreover, the authors report solubilities of the solid IL in water at 298.15 K and 323.15 K of 0.314 and 0.708 in mole fraction, respectively (interpolated values). There is a good agreement with our value at 298.15 K of 0.304 (0.888 in mass fraction). However, there is a significant discrepancy at 323.15 K because we obtained a value of 0.617 (0.967 in mass fraction). We conducted the experiment three times and values were repeated within the uncertainty of measurement. This difference could be due to the authors using a visual method as opposed to the analytical method in the present work. In relation to LLE, the comparison is more difficult because Domanska and col.21 only visually determined the temperature of disappearance of the two phases at fixed compositions, but the range of immiscibility is coincident.
The solubility of [C6C1py][OTf] in n-octane and cyclohexane was negligible (not detectable by chromatography). However, in the case of toluene, similar behaviour to water was found with a region of SLE and another of LLE. Solubility of the IL in toluene is 0.641 and 0.896 in mass fraction at 298.15 K and 323.15 K, respectively. No comparative data were found in the literature.
The ternary system water + [C6C1py][OTf] + n-octane (Fig. 1 and 2) shows a triphasic region limited by three biphasic regions. The LLE area present at low water concentrations, limits with a SLLE region caused by the practically total immiscibility between the IL (solid) and n-octane. Also, at high concentration of the IL and null or very low concentration of the hydrocarbon, a small region of SLE appears. Increasing the temperature diminishes the size of the LLLE and SLLE regions. Very similar phase diagrams (Fig. 5 and 6) were found for the water + [C6C1py][OTf] + cyclohexane system, due again to practically total immiscibility, this time between the IL and the cycloalkane.
 | ||
Fig. 2 Phase diagram of the ternary system water (1) + [C6C1py][OTf] (2) + n-octane (3) at 323.15 K ( Exp, Exp,  Corr). Corr). | ||
 | ||
Fig. 3 Phase diagram of the ternary system water (1) + [C6C1py][OTf] (2) + toluene (3) at 298.15 K ( Exp, Exp,  Corr). Corr). | ||
 | ||
Fig. 4 Phase diagram of the ternary system water (1) + [C6C1py][OTf] (2) + toluene (3) at 323.15 K ( Exp, Exp,  Corr). Corr). | ||
 | ||
Fig. 5 Phase diagram of the ternary system water (1) + [C6C1py][OTf] (2) + cyclohexane (3) at 298.15 K ( Exp, Exp,  Corr). Corr). | ||
 | ||
Fig. 6 Phase diagram of the ternary system water (1) + [C6C1py][OTf] (2) + cyclohexane (3) at 323.15 K ( Exp, Exp,  Corr). Corr). | ||
Pi-stacking interactions among aromatic rings of pyridinium and toluene lead to a different phase diagram for the ternary water + [C6C1py][OTf] + toluene system. The LLE regions corresponding to the involving binaries, generate a three-phase system (LLLE) surrounded by three biphasic systems. At high IL concentrations, a SLE region appears. There is little influence of temperature on the triphasic system but the size of the SLE region significantly decreases when temperature increases from 298 to 323 K.
Correlation
The correlation results obtained for water + [C6C1py][OTf] + n-octane, toluene or cyclohexane ternary systems at 298.15 K and 323.15 K are shown in Table 2, 3 and 4. These tables include the NRTL interaction parameters (J mol−1), the objective function values (eqn (5)) and the mean deviation (%) between calculated (cal) and experimental (exp) mole fractions obtained using the following equation:
 | (6) |
| T (K) | i | j | Δgij (J mol−1) | Δgji (J mol−1) | αij = αji | gS | O.F. | σ (%) |
|---|---|---|---|---|---|---|---|---|
| 298.15 | 1 | 2 | 23952.1 |
−8027.27 | 0.2 | −2.43 | 9.81 | 0.369 |
| 1 | 3 | 23578.0 |
19322.9 |
0.2 | ||||
| 2 | 3 | 4800.24 | 19501.6 |
0.2 | ||||
| 323.15 | 1 | 2 | 26948.8 |
−9482.89 | 0.2 | −0.816 | 11.7 | 0.478 |
| 1 | 3 | 25556.0 |
20943.9 |
0.2 | ||||
| 2 | 3 | 3758.62 | 21758.8 |
0.2 |
| T (K) | i | j | Δgij (J mol−1) | Δgji (J mol−1) | αij = αji | gS | O.F. | σ (%) |
|---|---|---|---|---|---|---|---|---|
| 298.15 | 1 | 2 | 23342.6 |
−7909.46 | 0.2 | −2.11 | 7.19 | 1.70 |
| 1 | 3 | 23477.4 |
18442.1 |
0.2 | ||||
| 2 | 3 | −6944.46 | 28388.3 |
0.2 | ||||
| 323.15 | 1 | 2 | 26319.9 |
−9380.68 | 0.2 | −0.602 | 9.10 | 1.68 |
| 1 | 3 | 25556.0 |
20943.9 |
0.2 | ||||
| 2 | 3 | −7361.19 | 30592.1 |
0.2 |
Considering that all the different equilibrium regions are simultaneously fitted by a unique set of model parameters, it can be said that equilibrium data (all the systems and temperatures) have been quite satisfactorily fitted with the NRTL model (see Fig. 1–6). Mean deviations calculated by eqn (6) go from 0.369 to 1.70% with higher values for the system with toluene, due to the inclusion of the SLE region in the correlation.
The Gibbs energy values for the solid IL (gS) obtained by optimisation during data correlation, of each system and temperature, have also been included in Tables 2–4. The reference state for the IL in these calculations is the pure liquid at working temperature. A unique gS value for the [C6C1py][OTf] ionic liquid, common to the three systems, was not imposed during the correlation procedure, but rather was calculated independently in each correlation. Even so, the values obtained are acceptably similar: −2.43, −2.11 and −2.42 at 298.15 K and −0.816, −0.602 and −0.815 at 323.15 K, for n-octane, toluene and cyclohexane, respectively. This result is consequence of the correlation procedure used in the present work, where the model must simultaneously fit all the different equilibrium regions of the system providing a more meaningful solution. The major differences are for the ternary system including toluene with quite different phase equilibrium behaviour. gS value increases with temperature for the three ternary systems.
| T (K) | i | j | Δgij (J mol−1) | Δgji (J mol−1) | αij = αji | gS | O.F. | σ (%) |
|---|---|---|---|---|---|---|---|---|
| 298.15 | 1 | 2 | 23912.1 |
−7990.24 | 0.2 | −2.42 | 8.63 | 0.571 |
| 1 | 3 | 23584.4 |
19322.0 |
0.2 | ||||
| 2 | 3 | −1032.97 | 22920.1 |
0.2 | ||||
| 323.15 | 1 | 2 | 27741.3 |
−9264.83 | 0.2 | −0.815 | 11.5 | 1.23 |
| 1 | 3 | 25351.7 |
21116.7 |
0.2 | ||||
| 2 | 3 | −471.321 | 24355.8 |
0.2 |
Something similar happens with the water + [C6C1py][OTf] binary system that is common to the three ternary systems: the binary interaction parameters obtained for this binary subsystem through the correlation of the ternary systems at each temperature are quite close.
All the correlation results were checked to guarantee global stability and discard any possible metastable equilibrium solution. Thus, the Gibbs energy surfaces for the liquid phase (gM,L) were calculated and graphically represented versus composition (mole fraction) along with the point corresponding to the solid phase (gS) and the calculated LLE and SLE tie-lines and LLLE tie-triangles. The topological analysis of these 3D-figures allowed the validation of the correlation results checking the existence of tangent planes in the calculated equilibrium compositions from all regions, ensuring that they do not intersect the gM,L surface in any other composition, as is required. As an example, these graphical representations for the system including toluene are shown in Fig. 7 and 8 for the binary subsystems and for the ternary system, respectively. Molar basis has been used in these representations as it is required by the correlations. The shape of the gM,L curves and surface, and also the position of the gS points show the fulfilment of the Gibbs common tangent equilibrium condition and the stability test. Fig. 7 shows the coexistence of LLE and SLE in the water + IL (Fig. 7a) and toluene + IL (Fig. 7c) pairs. Fig. 7b shows the typical gM,L curve for a highly immiscible system such as the water + toluene pair. Fig. 8 is a 3D-representation that has been thoroughly inspected by rotation, to guarantee the fulfilment of the common tangencies required by the Gibbs equilibrium conditions in the different regions of the system. Fig. 8 also shows some cuts of the 3D-figure that have been selected to illustrate the consistency of the solution in the different regions (LLLE, LLE, SLE and in the homogeneous L region).
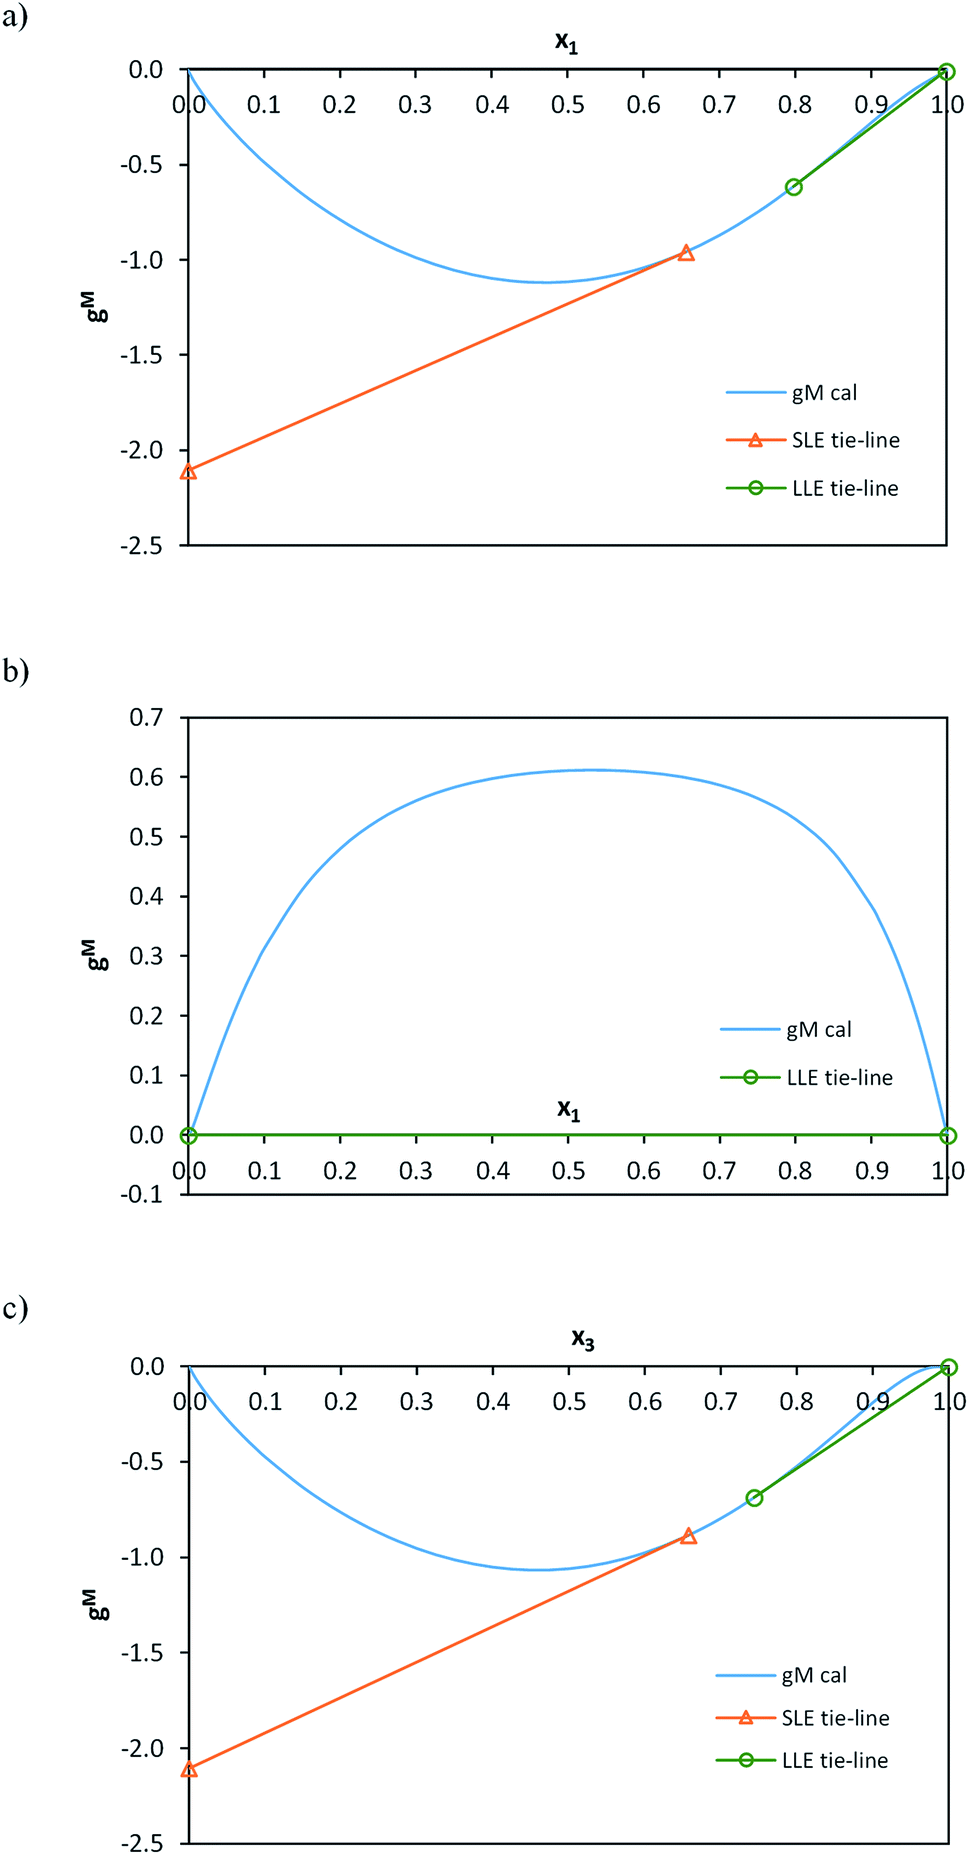 | ||
| Fig. 7 gM values calculated with the NRTL model with parameters in Table 3 as a function of composition (mole fraction) for each binary subsystem of water (1) + [C6C1py][OTf] (2) + toluene (3) ternary system at 298.15 K. (a) Binary (1)–(2); (b) binary (1)–(3); (c) binary (2)–(3). | ||
 | ||
| Fig. 8 Calculated gM,L surface (NRTL model with parameters in Table 3) and gS value for water (1) + [C6C1py][OTf] (2) + toluene (3) ternary system at 298.15 K. Figure shows the tangent lines and plane in each equilibrium region: LL, SL and LLL. Compositions in mole fractions. | ||
4. Conclusions
The chemical compound [C6C1py][OTf] is solid at room temperature but can be considered IL due to its melting point of about 336 K. This solid character leads, at 298.15 and 323.15 K and atmospheric pressure, to phase diagrams of systems comprising the IL, water, and oil (n-octane, toluene and cyclohexane) with many different regions (LLE, LLLE, SLE and SLLE). This phase behaviour must be carefully considered in petrochemical applications with this IL. All the systems contain a region with three liquid phases surrounded by three biphasic systems. The phase enriched in IL solubilises limited quantities of water and oil, the quantity of oil being very low in the case of octane and cyclohexane, and higher in the case of toluene due to pi-stacking interactions with the pyridinium cation. The regions close to the IL, in all the systems, involve the appearance of solid phases.The NRTL model is a useful tool to carry out the simultaneous correlation of all the equilibrium regions found in the phase diagrams, however, well-defined equilibrium conditions and pivotal strategies are required. Higher deviations have been obtained for the system including toluene, but even in this case a quite good representation of data in the different equilibrium regions (LLE, LLLE and SLE) is achieved. The Gibbs energy (gS) values for [C6C1py][OTf] increase with the temperature. The topological analysis based on the Gibbs common tangent criterion and the stability test have allowed validation of the correlation solutions obtained, guaranteeing global stability of the solutions.
List of symbols
| F | Function |
| g | Gibbs energy (dimensionless) |
| P | Pressure |
| T | Temperature |
| x | Mole fraction |
Subscripts
| calc | Calculated |
| exp | Experimental |
| i,j | Component identifiers |
| nd | Total number of equilibrium data |
Superscripts
| L | Liquid phase |
| M | Mixing |
| S | Solid phase |
| t | Number of equilibrium regions |
Greek letters
| α | NRTL non-randomness parameter |
| α, β, γ | Liquid phases |
| ε | Tolerance value |
| σ | Deviation (eqn (6)) |
Acronyms
| LLE | Liquid–liquid equilibrium |
| LLLE | Liquid–liquid–liquid equilibrium |
| O.F. | Objective function |
| SLE | Solid–liquid equilibrium |
Conflicts of interest
There are no conflicts to declare.Acknowledgements
The authors acknowledge the Ministry of Science, Innovation and Universities (Spain) for financial support throughout project PGC2018-097342-B-I00 (including European Regional Development Fund advanced funding).References
- A. R. Ferreira, M. G. Freire, J. C. Ribeiro, F. M. Lopes, J. G. Crespo and J. A. P. Countinho, Ind. Eng. Chem. Res., 2012, 51, 3483–3507, DOI:10.1021/ie2025322.
- M. H. Ibrahim, M. Hayyan, M. A. Hashim and A. Hayyan, Renewable Sustainable Energy Rev., 2017, 76, 1534–1549, DOI:10.1016/j.rser.2016.11.194.
- A. Soto, Ionic liquids for extraction processes in refinery-related applications. in Ionic liquids for better separation processes, ed H. Rodríguez, Springer-Verlag, Berlin, 2016, DOI:10.1007/978-3-662-48520-0.
- A. Bera and H. Belhaj, J. Mol. Liq., 2016, 224, 177–188, DOI:10.1016/j.molliq.2016.09.105.
- A. A. Sulaimon and M. Z. Md Tajuddin, Fluid Phase Equilib., 2017, 450, 194–199, DOI:10.1016/j.fluid.2017.07.023.
- N. Hazrati, A. Beigi, M. Akbar and M. Abdouss, Fuel, 2018, 229, 126–134, DOI:10.1016/j.fuel.2018.05.010.
- M. Hejazifar, M. Earle, K. R. Seddon, S. Weber, R. Zirbs and K. Bica, J. Org. Chem., 2016, 81, 12332–12339, DOI:10.1021/acs.joc.6b02165.
- M. Kar, N. V. Plechkova, K. R. Seddon, J. M. Pringle and D. R. MacFarlane, Aust. J. Chem., 2019, 72, 3–10, DOI:10.1071/ch18541.
- S. S. Sarangi, B. L. Bhargava and S. Balasubramanian, Phys. Chem. Chem. Phys., 2009, 11, 8745–8751, 10.1039/b908339a.
- I. Rodríguez-Palmeiro, O. Rodríguez, A. Soto and C. Held, Phys. Chem. Chem. Phys., 2015, 17, 1800–1810, 10.1039/c4cp04336g.
- I. Rodríguez-Escontrela, A. Arce, A. Soto, A. Marcilla, M. M. Olaya and J. A. Reyes-Labarta, Phys. Chem. Chem. Phys., 2016, 18, 21610–21617, 10.1039/c6cp03467e.
- R. Corchero, I. Rodríguez-Escontrela, O. Rodríguez and A. Soto, Fluid Phase Equilib., 2019, 483, 144–152, DOI:10.1016/j.fluid.2018.11.010.
- U. Domanska, M. Zawadzki, M. Krolikowski and A. Lewandrowska, Chem. Eng. J., 2012, 181–182, 63–71, DOI:10.1016/j.cej.2011.10.001.
- A. Bharti and T. Banerjee, Fluid Phase Equilib., 2015, 400, 27–37, DOI:10.1016/j.fluid.2015.04.029.
- A. Bharti, R. Verma, P. Prerna, S. Namdeo, A. Malviya, T. Banerjee and S. I. Sandler, Fluid Phase Equilib., 2018, 462, 73–84, DOI:10.1016/j.fluid.2018.01.026.
- H. Renon and J. M. Prausnitz, AIChE J., 1968, 14, 135–144, DOI:10.1002/aic.690140124.
- D. S. Abrams and J. M. Prausnitz, AIChE J., 1975, 21, 116–128, DOI:10.1002/aic.690210115.
- S. T. Lin and S. I. Sandler, Ind. Eng. Chem. Res., 2002, 41, 899–913, DOI:10.1021/ie001047w.
- J. Gross and G. Sadowski, Ind. Eng. Chem. Res., 2001, 40, 1244–1260, DOI:10.1021/ie0003887.
- K. M. Docherty, J. K. Dixon and C. F. Kulpa Jr, Biodegradation, 2007, 18, 481–493, DOI:10.1007/s10532-006-9081-7.
- U. Domanska, M. Krolikowski, A. Pobudkowska and P. Bochenska, J. Chem. Thermodyn., 2012, 55, 225–233, DOI:10.1016/j.jct.2012.06.003.
- A. Marcilla, J. A. Reyes-Labarta, M. M. Olaya and M. D. Serrano, Ind. Eng. Chem. Res., 2008, 47, 2100–2108, DOI:10.1021/ie071290w.
- A. Marcilla, J. A. Reyes-Labarta and M. M. Olaya, Fluid Phase Equilib., 2017, 433, 243–252, DOI:10.1016/j.fluid.2016.11.009.
Footnote |
| † Electronic supplementary information (ESI) available. See DOI: 10.1039/c9ra09283h |
| This journal is © The Royal Society of Chemistry 2019 |