 Open Access Article
Highly water-dispersible calcium lignosulfonate-capped MnO nanoparticles as a T1 MRI contrast agent with exceptional colloidal stability, low toxicity and remarkable relaxivity†
Mahdi Ariana,
Ali Zamanian *a and
Salman Taheri
 *b
*b
aBiomaterials Research Group, Nanotechnology and Advanced Materials Department, Materials and Energy Research Center (MERC), PO Box 14155-4777, Tehran, Iran. E-mail: a-zamanian@merc.ac.ir
bChemistry and Chemical Engineering Research Center of Iran (CCERCI), PO Box 14335-186, Tehran, Iran. E-mail: taheri@ccerci.ac.ir
First published on 6th December 2019
Abstract
A simple and efficient method to synthesize highly water-dispersible calcium lignosulfonate-coated manganese oxide nanoparticles as a potential candidate for the current magnetic resonance imaging (MRI) T1 contrast agents was reported. Hydrophobic MnO nanoparticles with dimensions of about 10 nm were prepared by thermal decomposition of manganese(II)acetylacetonate in the presence of oleic acid as a surfactant. The characteristics of the synthesized nanoparticles, cytotoxicity assay and in vitro MRI properties were investigated in detail. Results showed that calcium lignosulfonate has a great influence on the colloidal stability and biocompatibility of MnO nanoparticles in water. Furthermore, this coating agent ensures abundant exposure of external Mn ion with protons of water, which endows the nanoparticles with a longitudinal molar relaxivity (r1) of 4.62 mM−1 s−1. An efficient contrast enhancement effect was observed in the study of MRI investigations.
Introduction
Magnetic resonance imaging (MRI) is one of the most prominent methods of medical imaging which provides a non-invasive approach to obtain accurate anatomical information.1–3 However, in some cases, the use of contrast agents is essential for improving sensitivity in clinical diagnostics.4 The majority of MRI contrast agents are either paramagnetic ion complexes or superparamagnetic particles.5–9 The spin of unpaired electrons in paramagnetic compounds perturbs the relaxation of protons of water and results in an effective shortening of longitudinal relaxation time (T1). These compounds can increase the signal intensity of tissues and are known as positive MRI contrast agents. The accumulation of these compounds in the tissue will make it possible to have brighter points in a T1-weighted MRI image. The first introduced negative contrast agent in T2-weighted MRI imaging, which has been used so far, was superparamagnetic iron oxide nanoparticles (SPIONs).7,10–12 Applying SPIONs reduces transverse relaxation time (T2) and results in a darker contrast. However, SPIONs have several drawbacks that limit their extensive clinical applications. Dark signals from negative contrast agents reduce the accuracy of medical diagnosis. Furthermore, the high magnetic susceptibility artifacts of T2 contrast agents induce distortion of the magnetic field and generates obscure images, which demolishes the background around the lesions. Because of the inherent limitations of SPIONs, application of gadolinium-based compound as a positive contrast agent is more prevalent in clinical MRI.13–16 On the other hand, the inherent toxicity of Gd3+ ion can increase the risk of nephrogenic systemic fibrosis (NSF) and limits the use of these contrast agents.17–21 These restrictions have led to new concerns and food and drug administration (FDA) restrictions on the application of Gd-based compounds as T1 MRI contrast agent. Therefore, the current T1 contrast replacement is necessary for the new generation of MRI contrast agent. Preparing T1 MRI contrast agents with low toxicity, high colloidal stability, and large relaxivity is the most challenging task. Manganese has many effective properties such as high spin number, long electronic relaxation time, natural prevalence, known as human biochemistry, and lower toxicity than Gd, which make it as a potential substitute for Gd-based contrast agents.22–28 The synthesis of high-quality and uniform manganese oxide nanoparticles (MnO NPs) for biomedical applications is of key importance because uniformly sized nanoparticles have efficient magnetic resonance imaging contrast agents. Thermal decomposition method is a commonly used approach for synthesis of desired NPs in which a precursor is heated in high boiling point solvent and refluxed to produce narrow size distribution of NPs.29–32 The size and shape of the NPs have a great influence on their function as MRI contrast agent.33–37 As the size of the MnO NPs gets smaller, its specific surface area increases, and as a result, the contrast enhancement of the MRI image increases. However, for successful usage of NPs in biomedical applications, they should have good colloidal stability in an aqueous medium and low toxicity in a biological environment.38 Three efficient protocols have been used to convert hydrophobic NPs to water-dispersible NPs, which comprises ligand exchange with a water-soluble coating agent, encapsulation in amphiphilic polymer and embedding into micelles.39–41 The goal in all of the aforementioned approaches is minimizing cytotoxicity and increasing biocompatibility as well as maximizing contact between protons of water and manganese ions. To achieve much safer contrast agents, various manganese-based NPs with different coating agents have been prepared.38,42–50 Unfortunately, the longitudinal relaxivity (r1) of most synthesized MnO NPs were considerably lower than those of commercial Gd-based contrast agents.51–57 A suitable capping agent has a significant effect on the NPs performance with changing their polarity. Lignin is one of the most plentiful natural polymers and composed of complex cross-linked three-dimensional phenolic polymers. Calcium lignosulfonate (CaLs), as a byproduct from the papermaking process, has a high solubility in an aqueous medium due to a large number of polar functional groups.58,59 This renewable and biodegradable chemical can be considered for phase transfer of magnetic nanoparticles (Scheme 1).Herein, we report a facile and single emulsion technique for phase transfer of MnO NPs and their potential applications as a T1 MRI contrast agent. Oleic acid-capped manganese oxide NPs (MnO-OA NPs) with a size of ≈ 10 nm were prepared using thermal decomposition of manganese(II)acetylacetonate at high temperature in benzyl ether. Then, highly water-dispersible NPs were obtained by ligand exchange of oleic acid with CaLs. In this case, the CaLs moiety played a role to enhance biocompatibility and physiological stability. The CaLs provides abundant exposure of water molecules to manganese ion, which endows the MnO NPs with high longitudinal relaxivity. The colloidal stability of MnO NPs in water is a critical issue that has been improved by this coating agent. To the best of our knowledge, this is the first report on the use of CaLs to convert hydrophobic NPs to hydrophilic NPs. Furthermore, the MTT assay was performed to check the toxicity of CaLs and phase transferred NPs. Finally, longitudinal molar relaxivity (r1) of MnO-CaLs NPs was obtained using a 3.0 T clinical MRI scanner and then it was compared with Gd-based and MnO-based contrast agents.
Experimental
Materials
Manganese(II)acetylacetonate (Mn(acac)2, Sigma-Aldrich), oleic acid (extra pure, Samchun Chemical), benzyl ether, (98%, Merck), dimethyl sulfoxide (DMSO 99.8%, Samchun Chemical), calcium lignosulfonate (MW = 18![[thin space (1/6-em)]](https://www.rsc.org/images/entities/char_2009.gif) 000, Sigma-Aldrich), solvents such as ethanol, acetone, n-hexane and chloroform (all from Merck), phosphate buffered saline (Sigma-Aldrich), 3-(4,5-dimethyl-2-thiazolyl)-2,5-diphenyl-2H-tetrazolium bromide (MTT) (Sigma-Aldrich), penicillin–streptomycin (Sigma-Aldrich), RPMI 140 culture media (National Cell Bank of Iran (NCBI)), fetal bovine serum (FBS) (Gibco-BRL, Life Technologies Co. Ltd. (NY)), and argon (99.99%) as an inert atmosphere were used without further purification. Also, ultrapure water was used as a solvent for aqueous medium.
000, Sigma-Aldrich), solvents such as ethanol, acetone, n-hexane and chloroform (all from Merck), phosphate buffered saline (Sigma-Aldrich), 3-(4,5-dimethyl-2-thiazolyl)-2,5-diphenyl-2H-tetrazolium bromide (MTT) (Sigma-Aldrich), penicillin–streptomycin (Sigma-Aldrich), RPMI 140 culture media (National Cell Bank of Iran (NCBI)), fetal bovine serum (FBS) (Gibco-BRL, Life Technologies Co. Ltd. (NY)), and argon (99.99%) as an inert atmosphere were used without further purification. Also, ultrapure water was used as a solvent for aqueous medium.
Synthesis of MnO nanoparticles
Uniform MnO NPs were prepared by the method described elsewhere with some modifications.60 Typically, 4 mmol of Mn(acac)2 as precursor and 4 mL oleic acid as surfactant were dissolved in 40 mL of benzyl ether as a solvent. The mixture while stirring was degassed at 100 °C for 30 min to remove any moisture and oxygen. The reaction mixture was quickly heated to 300 °C and refluxed at this temperature for 1 h under the argon atmosphere using a standard Schlenk line. The color of the solution gradually changed to deep green. After cooling to room temperature, 200 mL of ethanol was added and precipitated NPs collected by centrifugation (4000 rpm, 10 min). The precipitated NPs were washed by a mixture of acetone, ethanol, and n-hexane three times. Finally, the oleic acid-coated MnO nanoparticles (MnO-OA NPs) were dispersed in n-hexane for storage.Phase transfer of MnO nanoparticles
Typically, 100 mg of synthesized hydrophobic MnO-OA NPs were dispersed in 100 mL of chloroform in a three-necked flask and were sonicated about 10 min until all NPs dispersed completely. A solution of 400 mg of CaLs with an average molecular weight of MW = 18![[thin space (1/6-em)]](https://www.rsc.org/images/entities/char_2009.gif) 000 in 100 mL of dimethyl sulfoxide (DMSO) was added dropwise to the reaction mixture. The ligand exchange process was completed under an inert atmosphere by stirring at 50 °C for 4 h. The NPs were collected by centrifugation (4000 rpm, 10 min) and washed with a mixture of acetone and hexane three times. Finally, hydrophilic MnO-CaLs NPs were washed with ethanol and dispersed in ultrapure water.
000 in 100 mL of dimethyl sulfoxide (DMSO) was added dropwise to the reaction mixture. The ligand exchange process was completed under an inert atmosphere by stirring at 50 °C for 4 h. The NPs were collected by centrifugation (4000 rpm, 10 min) and washed with a mixture of acetone and hexane three times. Finally, hydrophilic MnO-CaLs NPs were washed with ethanol and dispersed in ultrapure water.
Characterization
To identify crystal structure, X-ray powder diffraction (XRD) was performed on ≈ 100 mg of dry MnO-OA NPs utilizing a PW 3710 X-ray diffractometer (PHILIPS) with Cu-Kα radiation (λ = 1.54442 Å). Transmission electron microscopy (TEM) images were obtained using Philips CM30 microscope operated at 150 kV. Samples for TEM were prepared by dropping the NPs dispersions on a carbon-coated copper grid and the solvent was evaporated under vacuum. Field emission scanning electron microscopy (FESEM) study was carried out using a MIRA3-XMU microscope (TESCAN) at operating voltage of 15 kV. Fourier transform infrared spectroscopy was recorded using Spectrum 65 FT-IR spectrometer (PerkinElmer) in the wavenumber range of 400–4000 cm−1. The concentration of manganese ion was measured using inductively coupled plasma optical emission spectroscopy by SPECTRO ARCOS ICP-OES spectrometer. Thermal gravimetric analysis (TGA) and derivative thermogravimetry (DTG) were obtained by using TG 209 F1 Iris thermogravimetric analyzer (NETZSCH) with temperature varying from room temperature to 900 °C in a nitrogen atmosphere at a heating rate of 20 °C min−1. The hydrodynamic diameter and zeta potential of MnO NPs were obtained using HS C 1330-3000 Zetasizer (Malvern). The UV absorption spectrum was recorded on a Lambda 35 UV/Vis spectrometer (PerkinElmer).In vitro relaxivity measurement
In vitro MRI study was performed on a clinical 3.0 T MRI scanner (SIEMENS, MAGNETOM PRISMA) at room temperature. Signal reception and radio frequency (RF) excitation were performed using head coil. Dispersions of MnO-CaLs NPs with six different concentrations of Mn (0.44, 0.53, 0.66, 0.88, 1.32, and 2.64 mM) were prepared in ultrapure water (pH = 6.89). The T1-weighted images were acquired with parameters as following: standard spin echo, # of echoes = 12, time to echo (TE) = 15 ms, repetition time (TR) = 100, 150, 200, 300, 400, 500, 600, 700, 900, 1100, 1500, and 2000 ms, matrix = 384 × 252, slice thickness = 2 mm, flip angle (FA) = 50°, NEX = 1. The T2-weighted images were acquired with parameters as following: multiple-echo, # of echoes = 12, time to echo (TE) = 14.2, 28.4, 42.6, 56.8, 71, 85.2, 99.4, 113.6, 127.8, 142, 156.2, and 170.4 ms, repetition time (TR) = 3000 ms, matrix = 384 × 252, slice thickness = 2 mm, flip angle (FA) = 180°, NEX = 2. Relaxation times (T1, T2) and the corresponding relaxation rates (R1, R2) of each concentration were calculated by fitting the averaged pixel intensity to Iz = Io(1 − e−TR/T1) and Ix,y = Io(e−TE/T2) equations using Matlab program. Longitudinal and transverse molar relaxivity (r1, r2) were obtained from the relaxation rate (R1, R2) by the general relation: R(1,2) = 1/T(1,2) + r(1,2) × C. In this equation C shows Mn concentration of NPs and T(1,2) are the relaxation times in pure media. The r(1,2) can be obtained by plotting the relaxation rates (R1, R2) as a function of Mn concentration and calculating slope of the fitted curve.In vitro cytotoxicity evaluation
To evaluate the possible cytotoxicity of CaLs and MnO-CaLs NPs, cell viability was assessed with colorimetric MTT assay. For this purpose 3-(4,5-dimethyl-2-thiazolyl)-2,5-diphenyl-2H-tetrazolium bromide (MTT) with the concentration of 5 mg mL−1 was prepared in phosphate buffered saline (PBS) and stored at 4 °C. Human fibroblast cells HFFF2 line, which purchased from National Cell Bank of Iran (NCBI) were seeded in a 96-well plate for 24 h at a density of 1 × 10⁴ cells per well and then incubated at 37 °C under 90% humidity at 5% CO2. The medium (RPMI 140) supplemented with 10% fetal bovine serum (FBS) and 1% penicillin–streptomycin was used to culturing the cells. To examine the cytotoxicity, different concentrations of CaLs and MnO-CaLs NPs (0, 5, 10, 25, and 50 μg mL−1) were added to each well and incubated for 24 h. The MTT solution (100 μL, 10%) was added to each well and incubated for another 4 h in the dark. After the medium was discarded, 100 μL of DMSO added to each well until precipitated formazan dissolved completely. The optical density (OD) value was measured using an ELISA reader Titertek spectrophotometer at a wavelength of 570 nm. The cells cultured in medium without CaLs and MnO-CaLs NPs served as control (100% cell viability). According to measuring optical density value, which carried out in triplicates, the cell viability was obtained. The results were presented as the mean value with standard deviations from independent measurements.Results and discussion
Synthesis and characterization of MnO-CaLs nanoparticles
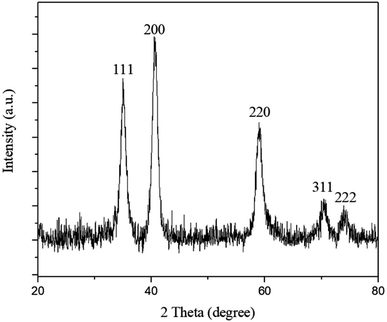
Oleic acid-capped MnO NPs were synthesized by thermal decomposition of manganese(II)acetylacetonate in benzyl ether. The crystalline structure of synthesized MnO NPs was confirmed by X-ray powder diffraction (XRD). All characteristic peaks of (111), (200), (220), (311), and (222), can be indexed to a cubic structure of MnO without other phases (Fig. 1).Crystallite size of MnO NPs was calculated ≈ 9 nm using the Debye–Scherrer equation. Transmission electron microscopy (TEM) image (Fig. 2a) and FESEM micrograph of MnO NPs (Fig. 2c) depict that NPs before phase transfer is composed of 20–60 nm aggregates of several 8–12 nm cores. The TEM image taken after the phase transfer, showed separate MnO NPs that were attached to the polymeric structure of CaLs (Fig. 2b).
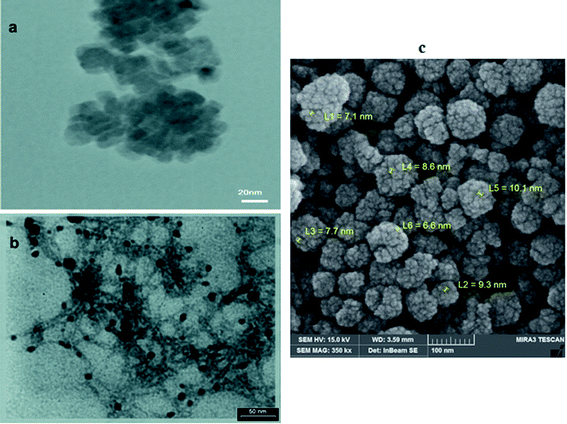 | ||
| Fig. 2 TEM images of (a) hydrophobic MnO-OA NPs; (b) hydrophilic MnO NPs, which stick in calcium lignosulfonate polymeric network (MnO-CaLs NPs) and (c) FESEM micrograph of hydrophobic MnO NPs. | ||
Solvent dispersity of MnO NPs shows that oleic acid-coated NPs are dispersed in chloroform and after ligand exchange, they have good colloidal stability in water (Fig. 3a). A sample of MnO-CaLs NPs was prepared in an aqueous medium and stored at room temperature. After two months, the MnO-CaLs NPs had exhibited exceptional colloidal stability and no aggregation found in suspension. This high colloidal stability can be attributed to the hydrophilic nature of CaLs and strong bonding between MnO NPs and CaLs. The observed average hydrodynamic size of the MnO-CaLs NPs by dynamic light scattering (DLS) analysis (Fig. 3b) was 141 nm, which was bigger than the value of 20–60 nm measured by TEM (Fig. 2). This size difference can be explained by the fact that the larger size measured by DLS originates from the hydration layer of CaLs coated onto the surface of NPs.
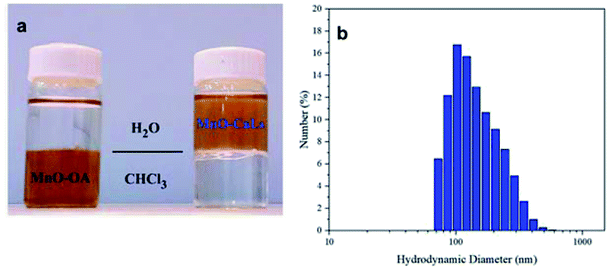 | ||
| Fig. 3 (a) Solvent dispersity of MnO NPs (left oleic acid-coated MnO NPs and right after phase transfer with calcium lignosulfonate) and (b) dynamic light scattering (DLS) of MnO-CaLs NPs. | ||
Zeta potential was also confirmed the high colloidal stability of the MnO-CaLs NPs in the aqueous medium (ESI, Fig. S1†). To verify the exchange of oleic acid with CaLs, Fourier transform infrared (FT-IR) spectroscopy was carried out on the pure CaLs, MnO NPs before and after phase transfer (Fig. 4a). In the FT-IR spectrum of hydrophobic MnO NPs, a pair of bands at 2920 and 2855 cm−1 were attributed to asymmetric and symmetric stretching of the CH2 bands of oleic acid, respectively. A pair of bands observed at 1550 and 1410 cm−1 correspond to symmetric and asymmetric stretching of the carboxylate group (COO−) of oleic acid. These two bands almost disappeared in the FT-IR spectrum of MnO-CaLs NPs. In the FT-IR spectra of CaLs, absorption bands at 1460, 1514, and 1602 cm−1 are characteristic peaks of benzene rings, which were observed in the FT-IR spectrum of MnO-CaLs NPs. Additionally, the peak at 3420 cm−1 attributed to the hydroxyl (O–H) stretching vibration. The obvious increase in the intensity of this band assigned to the exchange of oleic acid by CaLs. Also, absorption bands at 520 and 655 cm−1 were assigned to Mn–O stretching vibrations. The attachment of CaLs was further confirmed by the appearance of three characteristic peaks of CaLs in UV spectrum of MnO-CaLs NPs (Fig. 4b).
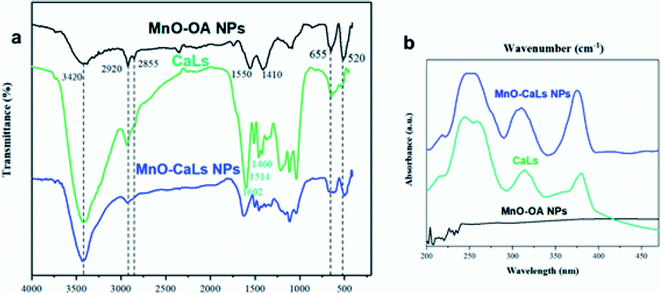 | ||
| Fig. 4 (a) FT-IR spectra and (b) UV absorption spectra of oleic acid-coated MnO NPs (MnO-OA NPs); calcium lignosulfonate (CaLs); and calcium lignosulfonate-coated MnO NPs (MnO-CaLs NPs). | ||
Furthermore, solid-state UV absorption spectra of MnO-CaLs NPs was showed a characteristic shoulder (λ ≈ 216 nm), which was attributed to CaLs on the MnO NPs surface (ESI Fig. S2†).
The immobilization of CaLs onto MnO NPs was further confirmed by thermal gravimetric analysis (TGA) of CaLs and MnO-CaLs NPs as shown in (Fig. 5). A weight loss of about 4% and 7% wt% before 100 °C in the TG curves of MnO-CaLs NPs and CaLs, respectively was due to the evaporation of water. The decomposition of CaLs moiety takes place from 200 to 400 °C in both curves but with low intensity in TG curve of MnO-CaLs NPs, due to high thermal stability of MnO-CaLs NPs. The total loss of mass in the MnO-CaLs NPs and CaLs were 23.64% and 72.54%, respectively. Calculations showed that the total amount of CaLs on MnO-CaLs NPs was 51.1% and the remaining mass (48.9%) was due to the MnO NPs.
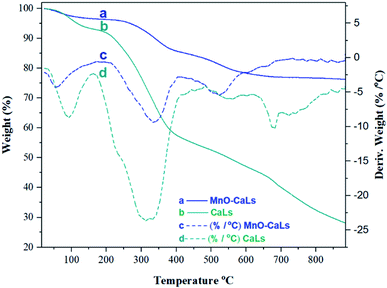 | ||
| Fig. 5 Thermal gravimetric analysis (TGA) and derivative thermogravimetry (DTG) of calcium lignosulfonate-coated MnO NPs (MnO-CaLs NPs) and calcium lignosulfonate (CaLs). | ||
In vitro relaxivity
To investigate the effectiveness of the MnO-CaLs NPs as a MRI contrast agent, T1 and T2 weighted images were obtained using a clinical 3.0 T MRI scanner. The MnO-CaLs NPs was shortened the longitudinal relaxation times of protons of water leading to signal enhancement effect in the T1-weighted image (Fig. 6a). Brightening in the T1-weighted MRI image was directly proportional to the Mn concentration but saturation effect was shown in the high concentration of Mn ion (2.64 mM), which results in darkening the image. Longitudinal relaxation rate (R1) was calculated for each concentration of Mn and molar relaxivity, which shows the efficiency of contrast agent, was obtained r1 = 4.62 mM−1 s−1 from the slope of the fitted curve. This enhanced relaxivity of MnO-CaLs NPs might be due to facile water permeation inside the CaLs polymeric network and abundant exposure of protons of water to manganese paramagnetic center, which endows the MnO NPs with high longitudinal relaxivity. Furthermore, MnO-CaLs NPs seems to exhibit additional potential as an efficient T2 contrast agent. In the T2-weighted images, the transverse relaxation rate (R2) was calculated for each concentration of Mn and molar relaxivity was obtained r2 = 22.86 mM−1 s−1 (Fig. 6b).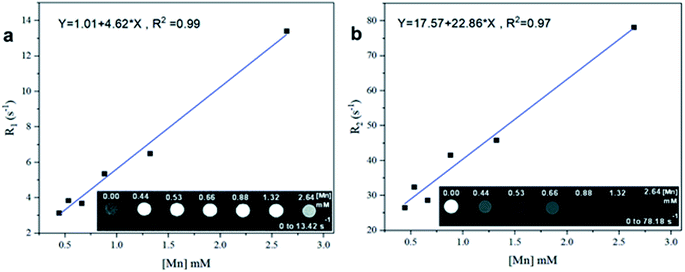 | ||
| Fig. 6 (a) Longitudinal relaxation rate R1 and (b) transverse relaxation rate R2 as a function of different Mn concentrations. | ||
Signal intensity against TR and TE in T1 and T2 weighted images for each concentration of Mn was drawn up (ESI, Fig. S3 and S4†). Results showed that in T1-weighted MRI images optimum concentration of Mn for maximum signal intensity was 0.66 mM but in T2-weighted MRI images maximum T2 effect, which results in reducing signal intensity was seen at 2.64 mM of Mn. It is highly desirable that a T1 MRI contrast agent has a high longitudinal molar relaxivity value (r1) and relaxivity ratio (r2/r1) close to one. Also, the transverse molar relaxivity (r2) in T2 contrast agents is close to ≈30 mM−1 s−1. The r1 value determined for MnO-CaLs NPs is greater than that of most MnO NPs reported in articles (Table 1). Also, the comparison between molar relaxivity of clinical gadolinium-based contrast agents and MnO-CaLs NPs show acceptable results. Most of the gadolinium-based contrast agents (such as MAGNEVIST, GADOVIST, OMNISCAN, and DOTAREM) have longitudinal molar relaxivity about r1 = 3 mM−1 s−1 in water at 3.0 T magnetic field.61 The only manganese-based contrast agent ever approved for clinical use is mangafodipir (sold under the brand name Teslascan), which has r1 = 1.5 mM−1 s−1 and r2 = 2.3 mM−1 s−1 in water at 3.0 T magnetic field.61 The r1 value of MnO-CaLs NPs is considerably higher than those of clinical Gd-based contrast agents and also Teslascan. Additionally, high longitudinal molar relaxivity (r1 = 4.62 mM−1 s−1) and low relaxivity ratio (r2/r1 = 4.95) of MnO-CaLs NPs in comparison with other results of MnO-based contrast agents that have been reported so far (Table 1), can be considered as a good result. These results suggest that the MnO-CaLs NPs is a potential candidate as a T1 MRI contrast agent.
| Nanoparticle@coating | Relaxivity (mM−1 s−1) | H (T) | Ref. | ||
|---|---|---|---|---|---|
| r1 | r2 | r2/r1 | |||
| MnO@CaLs | 4.62 | 22.86 | 4.95 | 3.0 | This study |
| MnO@dextran | 0.44 | 3.45 | 7.84 | 3.0 | 56 |
| MnO@PEG@dopamine@succinic anhydride | 5.98 | — | — | 3.0 | 62 |
| MnO@PEG@dopamine@poly aspartic acid | 10.2 | 62.3 | 6.1 | 3.0 | 63 |
| MnO@phospholipid | 4.1 | 18.9 | 4.6 | 3.0 | 64 |
| Hollow MnO@mesoporous SiO2@PEG | 0.17 | 1.75 | 10.29 | 3.0 | 45 |
| Hollow MnO@doxorubicin | 1.42 | 7.74 | 5.45 | 3.0 | 51 |
| MnO@SiO2 nanocomposites | 1.34 | — | — | 3.0 | 37 |
| Nanoplate MnO@PEG-NH2 | 5.5 | 9.86 | 1.79 | 1.5 | 35 |
| MnO@D-glucuronic acid | 2.5 | 7.02 | 6.83 | 1.5 | 38 |
| Hollow MnO@mesoporous SiO2 | 1.72 | 11.30 | 6.56 | 1.5 | 53 |
| MnO@carboxymethyl-dextran | 5.42 | 31.32 | 5.78 | 1.5 | 54 |
| MnO@poly(lactic-co-glycolic acid) | 1.24 | — | — | 4.0 | 44 |
| MnO@TETT silane | 4.84 | — | — | 7.0 | 47 |
| MnO@arginine–glycine–aspartic acid peptide | 12.1 | — | — | 9.4 | 50 |
| MnO@mercaptosuccinic acid | 2.55 | — | — | 11.7 | 55 |
| MnO@pluronic F127 | 1.91 | — | — | 11.7 | 55 |
| MnO@poly(maleic anhydride-alt-1-octadecene) | 2.42 | — | — | 11.7 | 55 |
| MnO@SiO2 | 0.29 | — | — | 11.7 | 55 |
| Hollow MnO@mesoporous SiO2 | 0.99 | 11.02 | 11.13 | 11.7 | 53 |
Cell culture
For MRI applications, it is a vital need that the toxicity of the NPs themselves is rather low. For this purpose, the cytotoxicity of CaLs and MnO-CaLs NPs against human fibroblast cells HFFF2 was assessed by using the MTT assay. Cell viability was measured after incubation with CaLs and MnO-CaLs NPs at the concentration from 0 to 50 μg mL−1 for 24 h (Fig. 7).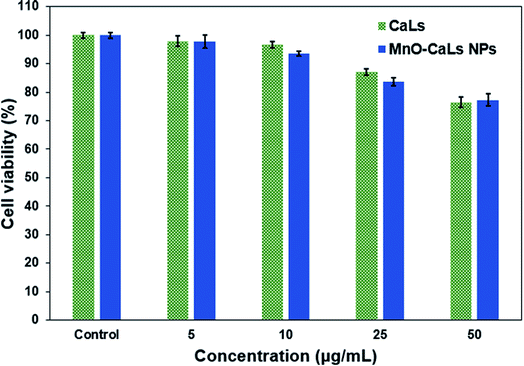 | ||
| Fig. 7 The viability of human fibroblast cells HFFF2 treated with different concentration of CaLs and MnO-CaLs NPs for 24 h measured by MTT assay. | ||
At low concentration (5 μg mL−1) the cell viability of CaLs and MnO-CaLs NPs were reasonably good (both was ≈98%). At high concentration (10 and 25 μg mL−1), the cell viability of MnO-CaLs NPs was observed to be slightly less compared to CaLs. The treated cells maintained over 76% and 77% cell viability for CaLs and MnO-CaLs NPs, respectively which indicate that MnO-CaLs NPs are biocompatible even at high concentration (50 μg mL−1). The concentration of Mn ion in 50 μg mL−1 solution of MnO-CaLs NPs was measured 0.77 mM. Maximum signal intensity on T1-weighted images were obtained in 0.66 mM concentration of Mn ion, which means the toxicity of MnO-CaLs NPs is low and demonstrate the high potentiality of it for biomedical application.
Conclusion
In summary, the calcium lignosulfonate-capped manganese oxide nanoparticles with improved longitudinal relaxivity as a T1 contrast agent for magnetic resonance imaging were synthesized and characterized. For first time, biodegradable and well-accessible calcium lignosulfonate was introduced as a robust coating agent that can be used in a simple, facile, single-phase, and inexpensive route to convert hydrophobic NPs to the highly water-dispersible and biocompatible NPs. The in vitro MRI studies demonstrated that the NPs exhibited promising longitudinal molar relaxivity (r1 = 4.62 mM−1 s−1), low relaxivity ratio (r2/r1 = 4.95) and efficient contrast enhancement effect. The calculated longitudinal molar relaxivity (r1) of this contrast agent is greater than most clinical gadolinium-based contrast agents. In comparison with the other manganese-based contrast agents, the synthesized MnO-CaLs NPs have excellent colloidal stability, high relaxivity, low cytotoxicity and good biocompatibility which make it as a great potential candidate for a T1 MRI contrast agent.Conflicts of interest
There are no conflicts to declare.References
- D. Weishaupt, J. M. Froehlich, D. Nanz, V. D. Koechli, K. P. Pruessmann and B. Marincek, How does MRI work?: An Introduction to the Physics and Function of Magnetic Resonance Imaging, Springer, Berlin, Heidelberg, 2008 Search PubMed.
- M. Elmaoğlu and A. Çelik, MRI handbook: MR physics, patient positioning, and protocols, Springer Science & Business Media, 2011 Search PubMed.
- B. M. Dale, M. A. Brown and R. C. Semelka, MRI: basic principles and applications, John Wiley & Sons, 2015 Search PubMed.
- S. Laurent, C. Henoumont, D. Stanicki, S. Boutry, E. Lipani, S. Belaid, R. N. Muller and L. Vander Elst, MRI Contrast Agents: From Molecules to Particles, Springer, Singapore, 2017 Search PubMed.
- H. B. Na, I. C. Song and T. Hyeon, Adv. Mater., 2009, 21, 2133–2148 CrossRef CAS.
- M. A. Oghabian and N. M. Farahbakhsh, J. Biomed. Nanotechnol., 2010, 6, 203–213 CrossRef CAS PubMed.
- D. Ling, N. Lee and T. Hyeon, Acc. Chem. Res., 2015, 48, 1276–1285 CrossRef CAS PubMed.
- T.-H. Shin, Y. Choi, S. Kim and J. Cheon, Chem. Soc. Rev., 2015, 44, 4501–4516 RSC.
- B. Y. W. Hsu, G. Kirby, A. Tan, A. M. Seifalian, X. Li and J. Wang, RSC Adv., 2016, 6, 45462–45474 RSC.
- X. Wang, D. Niu, Q. Wu, S. Bao, T. Su, X. Liu, S. Zhang and Q. Wang, Biomaterials, 2015, 53, 349–357 CrossRef CAS PubMed.
- F. Herranz, M. P. Morales, I. Rodríguez and J. Ruiz-Cabello, in Magnetic Characterization Techniques for Nanomaterials, ed. C. S. S. R. Kumar, Springer Berlin Heidelberg, Berlin, Heidelberg, 2017, pp. 85–120, DOI:10.1007/978-3-662-52780-1_3.
- Z. Shen, A. Wu and X. Chen, Mol. Pharm., 2017, 14, 1352–1364 CrossRef CAS PubMed.
- P. Caravan, J. J. Ellison, T. J. McMurry and R. B. Lauffer, Chem. Rev., 1999, 99, 2293–2352 CrossRef CAS PubMed.
- J.-L. Bridot, A.-C. Faure, S. Laurent, C. Rivière, C. Billotey, B. Hiba, M. Janier, V. Josserand, J.-L. Coll and L. Vander Elst, J. Am. Chem. Soc., 2007, 129, 5076–5084 CrossRef CAS.
- K. W.-Y. Chan and W.-T. Wong, Coord. Chem. Rev., 2007, 251, 2428–2451 CrossRef CAS.
- W. C. Floyd, P. J. Klemm, D. E. Smiles, A. C. Kohlgruber, V. C. Pierre, J. L. Mynar, J. M. J. Fréchet and K. N. Raymond, J. Am. Chem. Soc., 2011, 133, 2390–2393 CrossRef CAS PubMed.
- S. E. Cowper, Curr. Opin. Rheumatol., 2003, 15, 785–790 CrossRef PubMed.
- G. Bhave, J. B. Lewis and S. S. Chang, J. Urol., 2008, 180, 830–835 CrossRef CAS PubMed.
- P. Stratta, C. Canavese and S. Aime, Curr. Med. Chem., 2008, 15, 1229–1235 CrossRef CAS PubMed.
- A. Kribben, O. Witzke, U. Hillen, J. Barkhausen, A. E. Daul and R. Erbel, J. Am. Coll. Cardiol., 2009, 53, 1621–1628 CrossRef CAS PubMed.
- S. Viswanathan, Z. Kovacs, K. N. Green, S. J. Ratnakar and A. D. Sherry, Chem. Rev., 2010, 110, 2960–3018 CrossRef CAS PubMed.
- Y. J. Lin and A. P. Koretsky, Magn. Reson. Med., 1997, 38, 378–388 CrossRef CAS PubMed.
- A. C. Silva, J. H. Lee, I. Aoki and A. P. Koretsky, NMR Biomed., 2004, 17, 532–543 CrossRef CAS PubMed.
- D. Pan, A. H. Schmieder, S. A. Wickline and G. M. Lanza, Tetrahedron, 2011, 67, 8431–8444 CrossRef CAS PubMed.
- J. Xie and Z. Zhen, Theranostics, 2012, 2, 45–54 CrossRef PubMed.
- N. Pothayee, N. Pothayee, N. Hu, R. Zhang, D. F. Kelly, A. P. Koretsky and J. S. Riffle, J. Mater. Chem. B, 2014, 2, 1087–1099 RSC.
- M. Zhang, L. Xing, H. Ke, Y.-J. He, P.-F. Cui, Y. Zhu, G. Jiang, J.-B. Qiao, N. Lu, H. Chen and H.-L. Jiang, ACS Appl. Mater. Interfaces, 2017, 9, 11337–11344 CrossRef CAS PubMed.
- L. García-Hevia, M. Bañobre-López and J. Gallo, Chem.–Eur. J., 2019, 25, 431–441 CrossRef PubMed.
- J. Park, K. An, Y. Hwang, J.-G. Park, H.-J. Noh, J.-Y. Kim, J.-H. Park, N.-M. Hwang and T. Hyeon, Nat. Mater., 2004, 3, 891–895 CrossRef CAS PubMed.
- Y. Chen, E. Johnson and X. Peng, J. Am. Chem. Soc., 2007, 129, 10937–10947 CrossRef CAS PubMed.
- H. Si, H. Wang, H. Shen, C. Zhou, S. Li, S. Lou, W. Xu, Z. Du and L. S. Li, CrystEngComm, 2009, 11, 1128–1132 RSC.
- T. D. Schladt, T. Graf and W. Tremel, Chem. Mater., 2009, 21, 3183–3190 CrossRef CAS.
- C.-C. Huang, N.-H. Khu and C.-S. Yeh, Biomaterials, 2010, 31, 4073–4078 CrossRef CAS PubMed.
- T. Kim, E.-J. Cho, Y. Chae, M. Kim, A. Oh, J. Jin, E.-S. Lee, H. Baik, S. Haam, J.-S. Suh, Y.-M. Huh and K. Lee, Angew. Chem., Int. Ed., 2011, 50, 10589–10593 CrossRef CAS.
- M. Park, N. Lee, S. H. Choi, K. An, S.-H. Yu, J. H. Kim, S.-H. Kwon, D. Kim, H. Kim, S.-I. Baek, T.-Y. Ahn, O. K. Park, J. S. Son, Y.-E. Sung, Y.-W. Kim, Z. Wang, N. Pinna and T. Hyeon, Chem. Mater., 2011, 23, 3318–3324 CrossRef CAS.
- K. An, M. Park, J. H. Yu, H. B. Na, N. Lee, J. Park, S. H. Choi, I. C. Song, W. K. Moon and T. Hyeon, Eur. J. Inorg. Chem., 2012, 2148–2155 CrossRef CAS.
- Y. Lu, L. Zhang, J. Li, Y.-D. Su, Y. Liu, Y.-J. Xu, L. Dong, H.-L. Gao, J. Lin, N. Man, P.-F. Wei, W.-P. Xu, S.-H. Yu and L.-P. Wen, Adv. Funct. Mater., 2013, 23, 1534–1546 CrossRef CAS.
- M. J. Baek, J. Y. Park, W. Xu, K. Kattel, H. G. Kim, E. J. Lee, A. K. Patel, J. J. Lee, Y. Chang, T. J. Kim, J. E. Bae, K. S. Chae and G. H. Lee, ACS Appl. Mater. Interfaces, 2010, 2, 2949–2955 CrossRef CAS PubMed.
- U. I. Tromsdorf, N. C. Bigall, M. G. Kaul, O. T. Bruns, M. S. Nikolic, B. Mollwitz, R. A. Sperling, R. Reimer, H. Hohenberg, W. J. Parak, S. Förster, U. Beisiegel, G. Adam and H. Weller, Nano Lett., 2007, 7, 2422–2427 CrossRef CAS PubMed.
- Y. Liu, T. Chen, C. Wu, L. Qiu, R. Hu, J. Li, S. Cansiz, L. Zhang, C. Cui, G. Zhu, M. You, T. Zhang and W. Tan, J. Am. Chem. Soc., 2014, 136, 12552–12555 CrossRef CAS PubMed.
- J. Li, C.-Y. Hong, S.-X. Wu, H. Liang, L.-P. Wang, G. Huang, X. Chen, H.-H. Yang, D. Shangguan and W. Tan, J. Am. Chem. Soc., 2015, 137, 11210–11213 CrossRef CAS PubMed.
- H. B. Na, J. H. Lee, K. An, Y. I. Park, M. Park, I. S. Lee, D.-H. Nam, S. T. Kim, S.-H. Kim, S.-W. Kim, K.-H. Lim, K.-S. Kim, S.-O. Kim and T. Hyeon, Angew. Chem., 2007, 119, 5493–5497 CrossRef.
- T. D. Schladt, K. Schneider, M. I. Shukoor, F. Natalio, H. Bauer, M. N. Tahir, S. Weber, L. M. Schreiber, H. C. Schroder, W. E. G. Muller and W. Tremel, J. Mater. Chem., 2010, 20, 8297–8304 RSC.
- M. F. Bennewitz, T. L. Lobo, M. K. Nkansah, G. Ulas, G. W. Brudvig and E. M. Shapiro, ACS Nano, 2011, 5, 3438–3446 CrossRef CAS PubMed.
- Y.-K. Peng, C.-W. Lai, C.-L. Liu, H.-C. Chen, Y.-H. Hsiao, W.-L. Liu, K.-C. Tang, Y. Chi, J.-K. Hsiao, K.-E. Lim, H.-E. Liao, J.-J. Shyue and P.-T. Chou, ACS Nano, 2011, 5, 4177–4187 CrossRef CAS PubMed.
- M. Létourneau, M. Tremblay, L. Faucher, D. Rojas, P. Chevallier, Y. Gossuin, J. Lagueux and M.-A. Fortin, J. Phys. Chem. B, 2012, 116, 13228–13238 CrossRef.
- N. Chen, C. Shao, Y. Qu, S. Li, W. Gu, T. Zheng, L. Ye and C. Yu, ACS Appl. Mater. Interfaces, 2014, 6, 19850–19857 CrossRef CAS PubMed.
- B. Li, Z. Gu, N. Kurniawan, W. Chen and Z. P. Xu, Adv. Mater., 2017, 29, 373–380 Search PubMed.
- M. Lei, C. Fu, X. Cheng, B. Fu, N. Wu, Q. Zhang, A. Fu, J. Cheng, J. Gao and Z. Zhao, Adv. Funct. Mater., 2017, 27, 978–990 Search PubMed.
- J. Gallo, I. S. Alam, I. Lavdas, M. Wylezinska-Arridge, E. O. Aboagye and N. J. Long, J. Mater. Chem. B, 2014, 2, 868–876 RSC.
- J. Shin, R. M. Anisur, M. K. Ko, G. H. Im, J. H. Lee and I. S. Lee, Angew. Chem., Int. Ed., 2009, 48, 321–324 CrossRef CAS PubMed.
- H. Yang, Y. Zhuang, H. Hu, X. Du, C. Zhang, X. Shi, H. Wu and S. Yang, Adv. Funct. Mater., 2010, 20, 1733–1741 CrossRef CAS.
- T. Kim, E. Momin, J. Choi, K. Yuan, H. Zaidi, J. Kim, M. Park, N. Lee, M. T. McMahon, A. Quinones-Hinojosa, J. W. M. Bulte, T. Hyeon and A. A. Gilad, J. Am. Chem. Soc., 2011, 133, 2955–2961 CrossRef CAS PubMed.
- J. Park, D. Bang, E. Kim, J. Yang, E.-K. Lim, J. Choi, B. Kang, J.-S. Suh, H. S. Park, Y.-M. Huh and S. Haam, Eur. J. Inorg. Chem., 2012, 5960–5965 CrossRef CAS.
- Y.-C. Lee, D.-Y. Chen, S. J. Dodd, N. Bouraoud, A. P. Koretsky and K. M. Krishnan, Biomaterials, 2012, 33, 3560–3567 CrossRef CAS PubMed.
- H. R. Neves, R. A. Bini, J. H. O. Barbosa, C. E. G. Salmon and L. C. Varanda, Part. Part. Syst. Charact., 2016, 33, 167–176 CrossRef CAS.
- X. Li, W. Zhao, X. Liu, K. Chen, S. Zhu, P. Shi, Y. Chen and J. Shi, Acta Biomater., 2016, 30, 378–387 CrossRef CAS PubMed.
- J. Zakzeski, P. C. A. Bruijnincx, A. L. Jongerius and B. M. Weckhuysen, Chem. Rev., 2010, 110, 3552–3599 CrossRef CAS PubMed.
- C. Li, X. Zhao, A. Wang, G. W. Huber and T. Zhang, Chem. Rev., 2015, 115, 11559–11624 CrossRef CAS PubMed.
- J. Park, K. An, Y. Hwang, J.-G. Park, H.-J. Noh, J.-Y. Kim, J.-H. Park, N.-M. Hwang and T. Hyeon, Nat. Mater., 2004, 3, 891–895 CrossRef CAS.
- M. Rohrer, H. Bauer, J. Mintorovitch, M. Requardt and H.-J. Weinmann, Invest. Radiol., 2005, 40, 715–724 CrossRef PubMed.
- H. Huang, T. Yue, Y. Xu, K. Xu, H. Xu, S. Liu, J. Yu and J. Huang, J. Appl. Polym. Sci., 2015, 132, 42360–42367 CrossRef.
- H. Huang, T. Yue, K. Xu, J. Golzarian, J. Yu and J. Huang, Colloids Surf., B, 2015, 131, 148–154 CrossRef CAS PubMed.
- D. Pan, A. Senpan, S. D. Caruthers, T. A. Williams, M. J. Scott, P. J. Gaffney, S. A. Wickline and G. M. Lanza, Chem. Commun., 2009, 3234–3236, 10.1039/B902875G.
Footnote |
| † Electronic supplementary information (ESI) available: Zeta potential of MnO-CaLs NPs; solid-state UV absorption spectra of MnO-OA NPs, CaLs and MnO-CaLs NPs; signal intensity against TR in T1-weighted MRI images and signal intensity against TE in T2-weighted MRI images. See DOI: 10.1039/c9ra09125d |
| This journal is © The Royal Society of Chemistry 2019 |


