 Open Access Article
Effects of different calcium sources on the mineralization and sand curing of CaCO3 by carbonic anhydrase-producing bacteria
Ling Pan a,
Qiongfang Li
 *ab,
Yi Zhou*c,
Na Songa,
Lujia Yua,
Xuhui Wanga,
Ke Xionga,
LikSen Yapa and
Jianlin Huoa
aLife Science and Engineering College, Southwest University of Science and Technology, Mianyang 621010, China. E-mail: liqiongfang1992@126.com; Fax: +86-816-6089521; Tel: +86-816-6089521
bKey Laboratory of Solid Waste Treatment and Resource Recycle, Ministry of Education of China, Mianyang 621010, China
cSchool of Agriculture, Food & Wine, Waite Campus, The University of Adelaide, Urrbrae, South Australia 5064, Australia
First published on 10th December 2019
Abstract
The deposition and dissolution of calcium carbonate can be affected by the action of biological factors, such as microbial-induced carbonate precipitation (MICP). Bacillus spp. has been isolated and applied to prevent soil erosion, increase the stability of slopes, dikes and dunes. However, previous studies have been always limited to a single calcium source (CaCl2) to evaluate the roles of bacteria, and the deposition and curing effect has not yet been quantified. Here, we designed deposition experiments to determine the effect of Bacillus cereus with different calcium sources and applied it to sand curing to measure the amount of deposition and curing. The results demonstrated that vaterite was produced when the Bacillus cereus participated. Also, more deposition was produced in the Ca(CH3COO)2 and CaCl2 groups, but the Ca(NO3)2 group showed optimal curing effects in the sand curing test due to the denser and more uniform deposition. This research will provide an important reference for the design and application of microbial-induced carbonate precipitation.
1 Introduction
CaCO3 is a common mineral and represents the major constituent of the earth's crust, such as in marble and limestone. The deposition of carbonate minerals is observed in organisms such as pearls, shells and bones to rocks and soil. Carbonate precipitation can be directly formed from supersaturated carbonate water or by biological processes, while chemical deposition often occurs with biological factors in the natural environment.1 Biological factors are indispensable to the special karst landforms and travertine landforms, where the deposition and dissolution of carbonate can be affected by the activities of microbes, and thus can change the structure, morphology and formation.2,3 Even in extreme environments, such as at the travertine with high temperatures in Yellowstone National Park, USA, the peculiar stromatolite lithofacies were formed by the silica-encrusted cyanobacterial mats.4,5 In addition, a study in the Arctic thermal spring showed that the formation of rocks is inextricably linked to microbial communities.6 Many microorganisms can induce the mineralization of CaCO3, but mainly from two groups: carbonic anhydrase- and urea-producing microorganisms.7–13 Urease-producing bacteria require urea as a reactant and release NH3 during biomineralization, which is harmful to human health and the environment (CO(NH)2 + H2O → NH2COOH + NH3; NH2COOH + H2O → NH3 + H2CO3). Carbonic anhydrase could catalyze the reaction converting CO2 into HCO3− to improve the concentration of CO32− and the biomineralization (CO2 + H2O ↔ HCO3− + H+; HCO3− ↔ CO32− + H+).Bacillus is a widely distributed genus of bacteria, most strains of which have functions closely related to the microbe-induced carbonate deposition. The study on Bacillus cereus isolated from Qatari soils suggested that the aboriginal bacteria could be used to enhance biomineralization in areas where serious erosion has been induced by wind, with an aim to improve the soil stability.7 Another Bacillus cereus strain isolated from the dolomite surfaces of karst topographies had properties yielding CO2 and carbonic anhydrase (CA) to regulate the concentration of HCO3−, thereby inducing the production of CaCO3 crystals.8 Similarly, Li screened Bacillus cereus from a karst soil in Southwest China and studied the biocatalytic precipitation of CaCO3 at different initial concentrations of Ca2+ and CA.9,10 However, the above studies were always limited to a single calcium source (CaCl2) to evaluate the roles of bacteria, while for the purpose of practical application, multiple calcium sources should be involved to decide which reaction condition can be the most suitable for the bacteria strain to function.
Microbial-induced carbonate precipitation (MICP) can increase the deposition of carbonate and produce a calcite crust with high strength.11,12 It was found that a urease-producing bacteria (Bacillus sp.) isolated from tropical beach sand was able to form a thin but strong calcite crust with decreased permeability.13 Moreover, Soon studied the curing effects of MICP on tropical residual soil and sand using Bacillus megaterium, and found a significant improvement in shearing strength and anti-permeability from the bacteria treatment.14 However, the deposition of calcium carbonate and the hardness of the calcite crust formed by the bacteria have not been quantitatively determined yet, hence a comparison of the efficiency between different bacteria strains for forming calcium carbonate is impossible.
Recently, we isolated a dominant bacteria strain from Huanglong, identified as Bacillus cereus. The experimental microbes in previous biomineralization studies were mostly derived from rocks or soils in plain or high mountain areas, and the temperature and humidity of the growth environment were basically at a medium level; however, the Huanglong scenic in Sichuan, China, is located in the eastern part of the Qinghai-Tibet Plateau. Here, a large amount of cold-water travertine was formed with the perennially low temperature (4 °C) and at a high elevation (3145–3578 m).15 Studies on the travertine in Huanglong have shown that the biodiversity of bacteria and algae is significantly high, and the water contains a large amount of Ca2+, Mg2+ and HCO3−, thus forming an unique travertine landform and cold adaption condition.16 Hence, a study of aboriginal bacteria in Huanglong can provide reference for the research and application of biomineralization in a low temperature environment.
The objectives of this study were: (1) to evaluate the Bacillus cereus-induced carbonate precipitation under different calcium sources (CaCl2, Ca(NO3)2 and Ca(CH3COO)2); (2) to quantify the deposition amount and shear strength of a treated sand column.
2 Materials and methods
2.1 Bacterial strain
Experimental bacteria (Bacillus cereus) were provided by the Microbiology Laboratory of Southwest University of Science and Technology, with this indigenous bacteria strain isolated from travertine pool water in Huanglong, which has been demonstrated to possess the property of carbonic anhydrase production.17 The bacteria were incubated for 24 h in a beef extract peptone medium (per 1000 mL of a medium containing beef extract 3.0 g, peptone 10.0 g, NaCl 5.0 g and deionized water 1000 mL, pH 7.4–7.6), with the condition of 30 °C, 120 rpm shaking incubator cultivation.2.2 Preparation of the deposition systems
Each system contained 100 mL NaHCO3 (0.15 M), and the calcium sources were CaCl2, Ca(NO3)2 and Ca(CH3COO)2, respectively. The bacterial seed was inoculated into the liquid medium at a 1% inoculation ratio as the experimental group. The control group had the same volume of sterilized liquid medium. The total volume of the deposition system was 300 mL. The composition of each system is shown in Table 1. Each system was mineralized in a conical flask under the condition of 25 °C, 120 rpm, and the experiment lasted for 72 h.| Group | 1 | 2 | 3 | 4 | 5 | 6 |
|---|---|---|---|---|---|---|
| NaHCO3 (mL) | 100 | 100 | 100 | 100 | 100 | 100 |
| CaCl2 (mL) | 100 | 100 | 0 | 0 | 0 | 0 |
| Ca(NO3)2 (mL) | 0 | 0 | 100 | 100 | 0 | 0 |
| Ca(CH3COO)2 (mL) | 0 | 0 | 0 | 0 | 100 | 100 |
| Bacteria solution (mL) | 100 | 0 | 100 | 0 | 100 | 0 |
| Sterilizing medium (mL) | 0 | 100 | 0 | 100 | 0 | 100 |
2.3 Characterization
The pH and conductivity of each system were monitored using a pH meter (PHS-320) and conductivity meter (DDS-307) every 3 h for the first 12 h, and every 12 h after that. The supernatant was discarded, and the sediment was thoroughly washed with deionized water after the deposition. The total weight (M0) of the bottle and sediment after drying (60 °C) were recorded. Then, we scraped out the deposition, cleaned the bottle, and weighed the empty bottle (M1) after drying. The amount of deposition was calculated by subtraction (M0 − M1), and the dried deposition was used in the subsequent tests.18X-ray diffraction (XRD, D/max2200VPC, Japan) was performed to identify the crystalline phases of the deposition, with the condition of a diffraction angle (2θ) 3°–80° at a scan rate of 0.1° min−1. The functional groups of the deposition were determined on a Fourier-transform infrared spectrometer (FT-IR, Nico-let 5700, USA). The samples were scanned from 4000 to 400 cm−1 with a resolution of 0.4 cm−1. We ground the dried deposition into powder and characterized the microstructure via scanning electron microscopy (SEM, Carl Zeiss NTS GmbH UItra5, Germany).19
2.4 Preparation for the sand-curing experiment
Geotextile possesses a property of good permeability and shaping, so it was selected as the mould material (400 g m−2, Shandong Jiantong Geosynthetics Co., Ltd.). We cropped the geotextile into pieces of a suitable shape and size and sewed them into a cylindrical shape with a diameter of 60 mm and a height of 50 mm. Xiamen ISO standard sand (particle size 0.28–0.85 mm) were used in this experiment.20 We soaked the sand with 1 M HCl until there were no bubbles generated, then washed it repeatedly with deionized water 4–5 times and finally dried it.We loaded the sands into each geotextile mould with the same weight (150 g), and then, injected the microbial reaction mixture into the sand column using a plastic dropper. The microbial reaction mixture was the same as the deposition experiment. Grouting was performed once a day for seven days, 25 mL each time. After completing the experiment, demoulding the sand column and then drying it at 60 °C, the shear strength was measured using a strain-controlled direct shear tester (ZJ-2). The weight of specimen in each group was weighed (M0) after a complete curing test. Then, we washed the specimen with 1 M hydrochloric acid and ultrapure water after the shearing test, until there were no bubbles generated, and weighed it after drying (M1). The amount of deposition generated by the cured process was obtained by the method of subtraction.21
3 Results and discussion
3.1 pH and conductivity
The variations in pH and conductivity during the deposition process are shown in Fig. 1. In the first 3 h, the pH and conductivity decreased sharply with the chemical deposition (Fig. 1A). Ca2+ and CO32− combined rapidly to form CaCO3, and the consumption of CO32− promoted the ionization of HCO3−, and thus accelerated the chemical deposition. H+ in the solution rapidly increased because of the consumption of CO32−, which resulted in a significant decline in the pH value. Then, the chemical reaction was basically in equilibrium.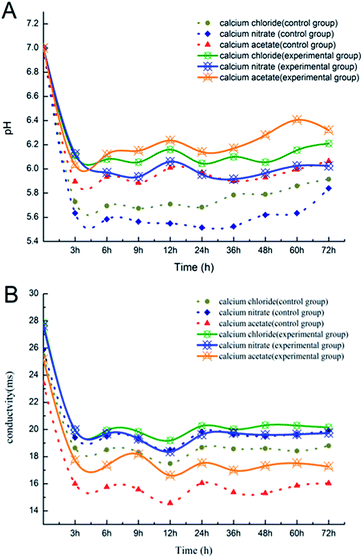 | ||
| Fig. 1 (A) The change in pH during the deposition process; (B) the change in electric conductivity during the deposition process. | ||
The pH of the experimental groups fluctuated more significantly than that of the control groups of Ca(NO3)2 and CaCl2 due to the supplementation of bacteria.22 However, the fluctuation of pH in the Ca(CH3COO)2 control group was clearly comparable to the Ca(NO3)2 and CaCl2 ones. This might have been due to the reversible ionization of the weak electrolyte (CH3COOH → CH3COO− + H+);23 hence, the pH in the Ca(CH3COO)2 control group was more sensitive to the change in ions in the system. In addition, although the experiment was performed at a constant temperature, since the incubator shaker was opened for each test, this could have possibly led to a temperature change and also the instability of the test results. The pH and conductivity of the experimental groups were all higher than those for the control group. It was speculated that the metabolism of bacteria increased the pH of the experimental groups. It seems that while the controls became stable, the pH of the experimental groups still fluctuated greatly at the end of the experiment. Hence, it was possible that the pH value would rise again after 72 h. It is known that microorganisms are rich in metabolites, and many of the complex compounds produced through the metabolic pathways could influence the pH of the solution, and thus the biomineralization of CaCO3 could be affected.24–26
3.2 Deposition amount
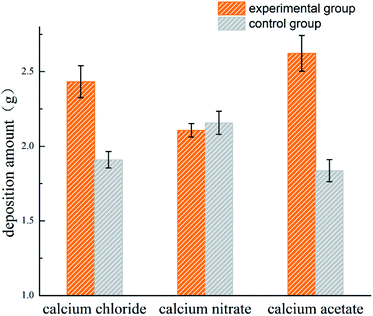
The amount of CaCO3 precipitated in each system is shown in Fig. 2. More deposition was produced in the experimental groups as compared to the control groups of Ca(CH3COO)2 and CaCl2, suggesting the presence of bacteria increased the production of deposition when Ca(CH3COO)2 and CaCl2 were provided as the calcium sources. The nucleation site is one of the main factors for calcium carbonate precipitation, whose availability significantly increased in the presence of bacteria, as the bacterial cells or their metabolites could serve as a nucleation site for the precipitation reaction.27,28 The pH of each system changed greatly with the addition of the initial reactants in practice, and the loss of CO2 occurred during the process, which was hard to quantify. The Ca(CH3COO)2 group has weak acidity compared with Ca(NO3)2 and CaCl2, which was associated with its higher pH value from Fig. 1. Therefore, less CO2 was lost and more deposition was produced in the Ca(CH3COO)2 group, which enhanced the utilization of CO2 by the experimental bacteria.29 In addition, CaCO3 deposition was inevitable in all systems because of the supersaturated environment. Nevertheless, the deposition systems of the inoculated and uninoculated bacteria were used, and they showed comparable deposition amounts.3.3 Morphological observation and crystal characterization
The FT-IR spectra for the CaCO3 crystals produced during deposition are shown in Fig. 3. The characteristic peaks of calcite were at 712 cm−1, 875 cm−1 and 2515 cm−1 for all the systems, which indicated that calcite was the most predominant polymorphs produced in each system.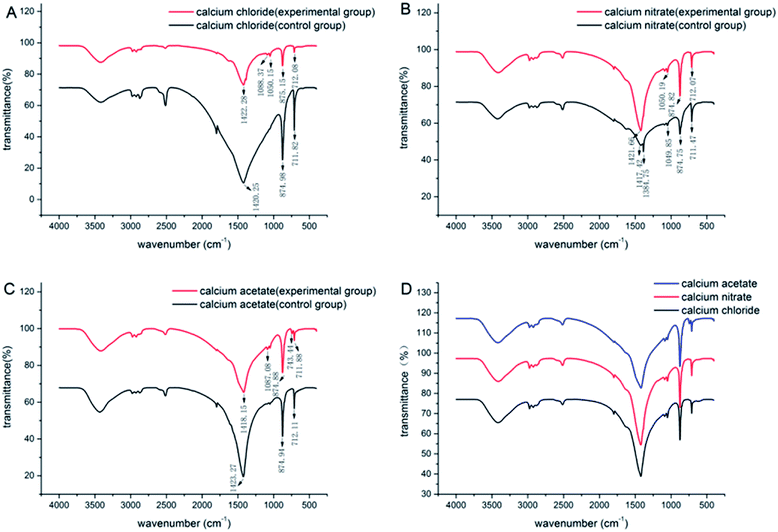 | ||
| Fig. 3 IR patterns of CaCO3 formed with the three different calcium sources: (A) CaCl2 system; (B) Ca(NO3)2 system; (C) Ca(CH3COO)2 system; (D) comparison of the three experimental groups. | ||
However, a combination of vaterite and calcite was induced when the bacteria were added to the deposition systems (Fig. 4), and the peaks at 1087 cm−1 and 744 cm−1 were the characteristic peaks of vaterite. Besides, there were also some other absorptions that peaked at 3430 cm−1, 2950–2850 cm−1, 2500 cm−1, 1750 cm−1, and 1450 cm−1, which mainly generated due to the vibration of the O–H, C–H and N–H groups in the water and organics. These organic functional groups were potentially derived from the culture medium or Bacillus cereus bacteria. However, new crystalline polymorphs were generated only in the experimental groups. Therefore, the vaterite produced in the deposition was not due to the culture medium but rather due to the metabolic activity of Bacillus cereus. In addition, the morphology of minerals can also be affected by some specific organic functional groups.30,31
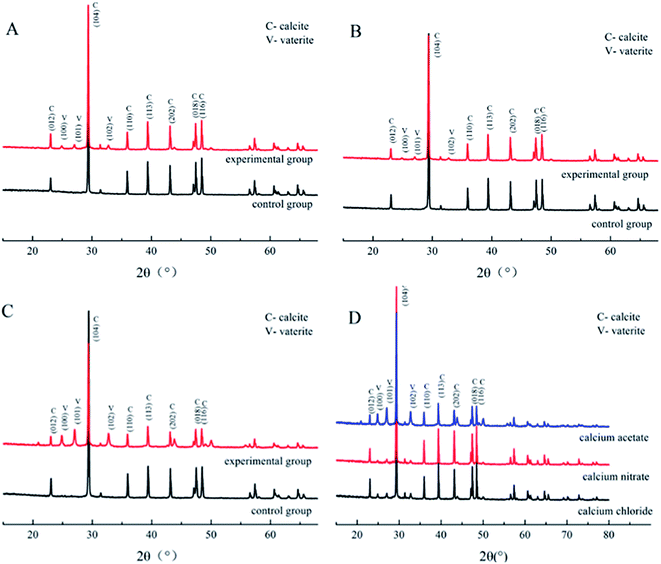 | ||
| Fig. 4 XRD patterns of CaCO3 formed with the three different calcium sources: (A) CaCl2 system; (B) Ca(NO3)2 system; (C) Ca(CH3COO)2 system; (D) comparison of the three experimental groups. | ||
To determine the mineral phases, we characterized the CaCO3 crystals produced in each system via XRD. The diffraction angles (2θ) of the deposition in the calcium acetate experiment group were 22.9°, 24.8°, 27.0°, 29.3°, 31.3°, 32.7°, 35.9°, 39.3°, 43.0°, 47.3°, and 48.4°, corresponding to the (hkl) indices (012), (100), (101), (104), (006), (102), (110), (113), (202), (018), and (116) (Fig. 4). In the control group without the biological factor, the diffraction angles (2θ) were 23.0°, 29.3°, 31.4°, 35.9°, 39.3°, 43.1°, 47.4°, and 48.4°, corresponding to the (hkl) indices (012), (104), (006), (110), (113), (202), (018) and (116). According to the diffraction angles (2θ) 24.8°, 27.0° and 32.7°, corresponding to the (hkl) indices (100), (101) and (102), both calcite and vaterite were produced with the bacteria, rather than calcite only in the control groups, which is consistent with the FT-IR analysis. The result was similar to that of the calcium chloride and calcium nitrate groups, and a comparison of the three experimental groups revealed that the calcium acetate group with bacteria induced a higher portion of vaterite than the calcium chloride and calcium nitrate groups. These data indicated that the presence of Bacillus cereus prompted the precipitation of vaterite particles. Previous studies have demonstrated that the bioprecipitation of CaCO3 may result in the production of different polymorphs, including calcite, vaterite, aragonite, and ikaite.32,33 The bacterial extracellular polymeric substance (EPS) is the key factor influencing the morphology of the precipitated particles,34 which generally possess the property of metal binding, such as Ca2+, as its high molecular weight compounds with charged functional groups.35 Besides, it is also affected by complex enzymatic systems, such as a diverse range of EPS, and enzymes, including protein, nucleic acid, and polysaccharides, that are produced via the metabolic activities of bacteria. Furthermore, many of the biomineralization-related substances have common characteristics, such as highly glycosylated, acidic,36,37 and anionic functional groups.38,39 These differences between the control and experimental groups were due to the presence of the bacteria. In addition, the complex interactions between EPS and inorganic ions also affected the deposition.
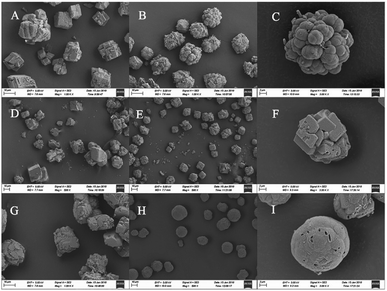
The crystal shapes of CaCO3 particles in each system were distinguishable by SEM. The majority of the crystals precipitated in the control groups were basically the same, mainly square or rhombohedral with overlaps and an irregular structure (Fig. 5A, D and G). While the bioprecipitation of CaCO3 may result in different polymorphs,40 it was visually confirmed that different shapes of crystals were precipitated. With the effect of the bacteria in the experimental groups, the crystal morphology was significantly changed both in the CaCl2 and Ca(CH3COO)2 groups. It could be seen that raspberry-shaped crystals were generated in the CaCl2 system. Plenty of spherical crystals were seen clearly in the Ca(CH3COO)2 experimental group, and the surface was relatively flat and smooth (Fig. 5H), and a large number of holes of bacterial activity were visualized on the surface or interior of the crystals (Fig. 5C, F and I). It is worth noting that the size of particles in the control group of Ca(NO3)2 were generally between 10–40 μm, while the size of particles was mainly 15–20 μm when the bacteria were added (Fig. 5E). The uniform and smaller size contributed to the enhancement of the effectiveness of cracks remediation and sand cohesiveness.41 In our investigation, the results obtained by FT-IR and XRD disclosed that the vaterite formation was facilitated with the presence of Bacillus cereus and its metabolites. Besides, it also had an effect on the CaCO3 morphology, which can be seen clearly in Fig. 5.
3.4 External morphology of the sand-cured specimen
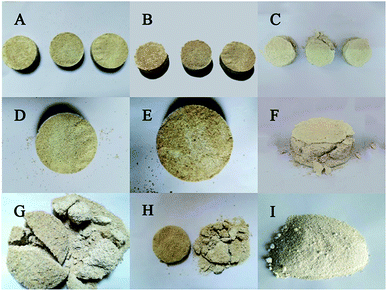
The cured samples in the CaCl2 group and the Ca(NO3)2 group were well formed. The sand column remained a regular and smooth cylindrical shape without any loose sand scattered around, and the surface tended to be brown-yellow (Fig. 6A and B). While the cured samples in the Ca(CH3COO)2 group were not fully formed, with sand grains falling around and with an incomplete shape and yellow-white surface (Fig. 6C). It is remarkable that there were holes on the surface of each specimen, which was likely because of CO2 hydration catalyzed by carbon anhydrase, producing CO2 continuously during that process, thus leaving holes on the surface of these specimens. The sand column without any treatment could not be cured to a whole block, and thus they were still loose sands without any strength after demoulding. After the shearing test, the upper and lower parts of the sample in the Ca(NO3)2 and CaCl2 groups were fragmented (Fig. 6G and H), while those in the Ca(CH3COO)2 group were sanded (Fig. 6I). This suggested that the Ca(NO3)2 group had the best curing effect with the presence of the experimental bacteria.3.5 Deposition and shearing strength
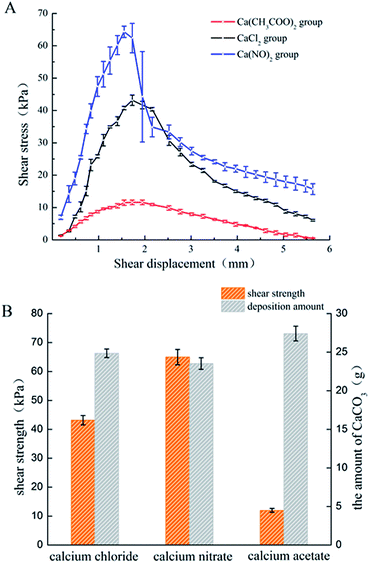
The amount of CaCO3 from the different calcium sources deposited during the curing process was different. The Ca(CH3COO)2 group possessed the largest deposition amount, while the difference between the CaCl2 group and Ca(NO3)2 group was not significant, which is basically consistent with the results from the deposition experiment. The relationship between the shear stress and displacement is shown in Fig. 7A. With the effect of the experimental bacteria, the sand was cured into a whole sand column, but the curing effect was different. Among the three calcium sources selected in this experiment, the sand column of the Ca(NO3)2 group had the highest shearing strength (62.33 kPa), followed by the CaCl2 group, while the Ca(CH3COO)2 group had the worst curing effect (only 11.19 kPa).The calcite crystals produced by the CaCl2 and CaNO3 systems were combined closely and well distributed (Fig. 9A and C), which were clustered to the sand particles to improve the cementation of sands, and also enhanced the cured strength of the column. Conversely, calcite crystals from the Ca(CH3COO)2 systems were inhomogeneous and most of them were scattered around the sand, instead of attached to the surface of the sand (Fig. 9E), which presented a lower shearing strength.42 In addition, the crystals on the surface of the sand in the Ca(NO3)2 and CaCl2 groups were denser than that of Ca(CH3COO)2, which was the key factor that reduced the adhesion between sands and also the shearing strength.43 XRD results showed the crystal type and its approximate content. The diffraction of vaterite observed in the calcium acetate group was more obvious than in the other two groups, but the evidence of calcite was limited (Fig. 8), which is unfavourable to the curing of sands.44,45 In addition, there was a large difference in the size of particles in the calcium acetate group, which was generally between 10–30 μm. However, the size of particles was mainly 10–15 μm in the other two groups (Fig. 5), which may be the reason for the difference in shearing strength.41 Although the largest amount of deposition was produced in the Ca(CH3COO)2 system, most of them were unable to bond the sand particles, which we termed as a non-effective connection.46 These results suggested that a good uniform calcite distribution and size contributed to enhancing the effectiveness of the shearing strength.
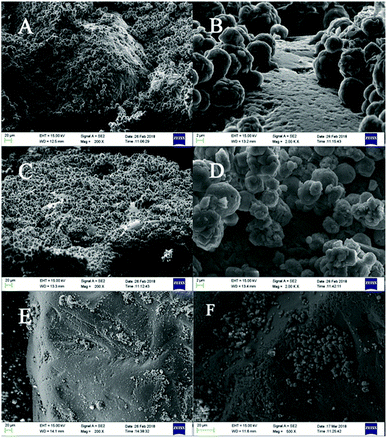 | ||
| Fig. 9 SEM images of sand and CaCO3 formed in the sand columns: (A and B) CaCl2 group; (C and D) Ca(NO3)2 group; (E and F) Ca(CH3COO)2 group. | ||
4 Conclusion
The current study showed that the presence of Bacillus cereus strain increased the pH of deposition systems, and also increased the amount of deposition when Ca(CH3COO)2 and CaCl2 were provided as the calcium sources. The formation of vaterite was promoted with the effect of Bacillus cereus in experimental groups, especially in the Ca(CH3COO)2 system. In addition, the deposition formed by the Ca(NO3)2 system in the sand-curing experiment was denser and more uniform, which is favourable to sand curing. Hence, the sand column in the Ca(NO3)2 system possessed the highest shearing strength.Conflicts of interest
There are no conflicts to declare.Acknowledgements
This work was co-founded by the project of the National Natural Science Foundation of China (No. 41572035, 41472309). We would like to thank the College of Life Science and Engineering, Southwest University of Science and Technology for kindly providing the facilities for which to conduct this research. Besides, a significant thanks to School of Agriculture, Food & Wine, Waite Campus, the University of Adelaide for the thesis supervision.Notes and references
- M. Ghobadi and R. Babazadeh, Rock Mech. Rock Eng., 2014, 48(3), 1001–1016 CrossRef.
- C. Glunk, C. Dupraz, O. Braissant, K. Gallagher, E. Verrecchia and P. Visscher, Sedimentology, 2011, 58(3), 720–738 CrossRef.
- C. Bayari, Earth Surf. Processes Landforms, 2002, 27(6), 577–590 CrossRef.
- C. Ranney, W. Berelson, F. Corsetti, M. Treants and J. Spear, Environ. Microbiol., 2012, 14(5), 1182–1197 CrossRef PubMed.
- J. Kim, T. Kogure, K. Yang, S. Kim, Y. Jang, H. Baik and G. Geesey, Clays Clay Miner., 2012, 60(5), 484–495 CrossRef CAS.
- V. Starke, J. Kirshtein, M. Fogel and A. Steele, Environ. Microbiol. Rep., 2013, 5(5), 648–659 Search PubMed.
- S. Bibi, M. Oualha, M. Ashfaq, M. Suleiman and N. Zouari, RSC Adv., 2018, 8, 5854–5863 RSC.
- J. Han, B. Lian and H. Ling, Geomicrobiol. J., 2013, 30(8), 682–689 CrossRef CAS.
- W. Li, W. Chen, P. Zhou, S. Zhu and L. Yu, Chem. Eng. J., 2013, 218, 65–72 CrossRef CAS.
- W. Li, W. Chen, P. Zhou and L. Yu, Chem. Eng. J., 2013, 232, 149–156 CrossRef CAS.
- L. Cheng, M. Shahin, R. Cordruwisch, M. Addis, T. Hartanto and C. Elms, 7th International Congress on Environmental Geotechnics, 2014, pp. 1105–1112 Search PubMed.
- R. Tarczewski, Procedia Manuf., 2015, 3, 1704–1711 CrossRef.
- J. Chu, V. Stabnikov and V. Ivanov, Geomicrobiol. J., 2012, 29(6), 544–549 CrossRef CAS.
- N. Soon, L. Lee, T. Khun and H. Ling, KSCE J. Civ. Eng., 2013, 17(4), 718–728 CrossRef.
- Q. Li, F. Dong, Q. Dai, T. Huo, D. An and S. Tang, Adv. Mater. Res., 2012, 518, 136–139 Search PubMed.
- S. Sun, F. Dong, H. Ehrlich, X. Zhao, M. Liu, Q. Dai, Q. Li, D. An and H. Dong, Int J Environ Res Public Health, 2014, 11(12), 13084–13096 CrossRef CAS PubMed.
- Q. Yang, X. He, Q. Li, L. Yu, X. Wang and L. Pan, Ind. Constr., 2018, 48(7), 38–43 Search PubMed.
- S. Katsev and M. Dittrich, Ecol. Model., 2013, 251, 246–259 CrossRef CAS.
- X. Jiang, Q. Lin, M. Zhang, G. He and Z. Sun, Nanoscale Res. Lett., 2015, 10(1), 1–6 CrossRef PubMed.
- A. Jotisankasa and N. Rurgchaisri, Geotext. Geomembranes, 2018, 46(3), 338–353 CrossRef.
- H. Eid, R. Amarasinghe, K. Rabie and D. Wijewickreme, Can. Geotech. J., 2015, 52(2), 198–210 CrossRef.
- B. Mortensen, M. Haber, J. Dejong, L. Caslake and D. Nelson, J. Appl. Microbiol., 2011, 111(2), 338–349 CrossRef CAS PubMed.
- S. Fisher, A. Kovalevsky, J. Domsic, M. Mustyakimov, D. Silverman, R. Mckenna and P. Langan, Acta Crystallogr. D, 2010, 66(11), 1178–1183 CrossRef CAS PubMed.
- G. Falini, M. Reggi, S. Fermani, F. Sparla, S. Goffredo, Z. Dubinsky, O. Levi, Y. Dauphin and J. Cuif, J. Struct. Biol., 2013, 183(2), 226–238 CrossRef CAS PubMed.
- M. Kiran, K. Pakshirajan and G. Das, Chem. Eng. Sci., 2017, 158, 606–620 CrossRef.
- L. Ren, Z. Hong, W. Qian, J. Li and R. Xu, Environ. Pollut., 2018, 237, 39–49 CrossRef CAS PubMed.
- G. Long, P. Zhu, Y. Shen and M. Tong, Environ. Sci. Technol., 2009, 43(7), 2308–2314 CrossRef CAS PubMed.
- M. Obst, J. Dynes, J. Lawrence, G. Swerhone, K. Benzerara, C. Karunakaran, K. Kaznatcheev, T. Tyliszczak and A. Hitchcock, Geochim. Cosmochim. Acta, 2009, 73(14), 4180–4198 CrossRef CAS.
- M. Edman and A. Omstedt, Limnol. Oceanogr., 2012, 58(1), 74–92 CrossRef.
- C. Glunk, C. Dupraz, O. Braissant, K. Gallagher, E. Verrecchia and P. Visscher, Sedimentology, 2010, 58(3), 720–736 CrossRef.
- J. Aizenberg, G. Lambert, S. Weiner and L. Addadi, J. Am. Chem. Soc., 2002, 124(1), 32–39 CrossRef CAS PubMed.
- N. Dhami, M. Reddy and A. Mukherjee, J. Microbiol. Biotechnol., 2013, 23(5), 707–714 CrossRef CAS PubMed.
- R. Sevcik, P. Sasek and A. Viani, J. Mater. Sci., 2017, 53(6), 4022–4033 CrossRef.
- M. Seifan, A. Samani and A. Berenjian, Appl. Microbiol. Biotechnol., 2016, 100(23), 9895–9906 CrossRef CAS PubMed.
- P. Bhaskar and N. Bhosle, Environ. Int., 2006, 32(2), 191–198 CrossRef CAS PubMed.
- N. Wada, K. Kanamura and T. Umegaki, J. Colloid Interface Sci., 2001, 233(1), 65–72 CrossRef CAS PubMed.
- H. Wang, C. Bocker, B. Li, H. Lin, R. Christian and L. Luo, Solid State Sci., 2017, 70, 6–12 CrossRef CAS.
- M. Suzuki, K. Saruwatari, T. Kogure, Y. Yamamoto, T. Nishimura, T. Kato and H. Nagasawa, Science, 2009, 325(5946), 1388–1390 CrossRef CAS PubMed.
- S. Collino and J. Evans, Biomacromolecules, 2008, 9(7), 1909–1918 CrossRef CAS PubMed.
- M. Seifan, A. Samani, S. Hewitt and A. Berenjian, Fermentation, 2017, 3(4), 57 CrossRef.
- M. Seifan and A. Berenjian, World J. Microbiol. Biotechnol., 2018, 34(11), 168 CrossRef PubMed.
- X. Wang, W. Guo, F. Yu, Z. Yi and L. Sun, Rock Soil Mech., 2016, 37(2), 363–368 Search PubMed.
- K. Andersen and K. Schjetne, J. Geotech. Geoenviron. Eng., 2013, 139(7), 1140–1155 CrossRef.
- M. Cui, J. Zheng, R. Zhang, H. Lai and J. Zhang, Acta Geotech., 2017, 12(5), 971–986 CrossRef.
- H. Son, H. Kim, S. Park and H. Lee, Materials, 2018, 11(5), 782 CrossRef PubMed.
- Y. Zhang, H. Guo and X. Cheng, Constr. Build. Mater., 2015, 77, 160–167 CrossRef.
| This journal is © The Royal Society of Chemistry 2019 |

