
 Open Access Article
 This Open Access Article is licensed under a Creative Commons Attribution-Non Commercial 3.0 Unported Licence
Enhanced sodium ion conductivity in Na3VS4 by P-doping
Yu Hea,
Fengqi Lu *b and
Xiaojun Kuangab
*b and
Xiaojun Kuangab
aCollege of Chemistry and Bioengineering, Guilin University of Technology, Guilin 541004, P. R. China
bGuangxi Key Laboratory of Optical and Electronic Materials and Devices, MOE Key Laboratory of New Processing Technology for Nonferrous Metal and Materials, College of Materials Science and Engineering, Guilin University of Technology, Guilin 541004, P. R. China. E-mail: lufengqi@glut.edu.cn
First published on 29th November 2019
Abstract
All-solid-state sodium-ion batteries are promising candidates for renewable energy storage applications, owing to their high safety, high energy density, and the abundant resources of sodium. The critical factor for an all-solid-state battery is having a sodium solid electrolyte that has high Na ion conductivity at room temperature and outstanding thermal stability, low flammability, and long battery lifespan. Herein, a new Na ion solid-state electrolyte, Na3VS4, is prepared by a solid state reaction. It shows conductivity of ∼1.16 × 10⁻⁸ to 1.46 × 10⁻⁶ S cm−1 from 25 to 100 °C. The sodium ion conductivity was enhanced to ∼1.49 × 10⁻⁷ to 1.20 × 10⁻⁵ S cm−1 through P substitution for V in the composition Na3P0.1V0.9S4. Such sodium ion conduction enhancement could be attributed to P substitution for V leading to a wider Na migration path and the generation of sodium vacancies.
Introduction
There is growing demand for high performance rechargeable batteries used in large-scale energy storage, including electric vehicles and backup storage at individual houses and large-scale solar and wind farms.1 To date, rechargeable battery technology is dominated by lithium ion batteries, but the geographically constrained Li resources will ultimately push up prices, in turn limiting their application potential in large-scale energy storage. Moreover, from a battery producer viewpoint, principal importance is always given to material abundance and low cost when designing an electrode, i.e., sodium, which is an abundant element in nature while lithium is not. As one classic ion battery, the sodium ion battery has risen to prominence as a key supplement for large-scale energy storage systems.2 However, severe safety issues also exist in sodium ion batteries using organic liquid electrolytes, because of extremely high reactivity of volatile sodium metal and flammable organic liquid electrolytes.3–6 Among various methods for improving the safety of electrolytes, the inorganic solid electrolytes have been proposed for development of thermally stable electrolytes.7 Compared with traditional organic electrolytes, solid state electrolytes have excellent thermal stability,8 low flammability, and potentially better battery life due to the increased electrochemical stability.9,10 Based on these advantages, solid-state electrolytes are considered to the most promising components for next generation secondary batteries.Sulfur-based Na-ion solid electrolytes offer promising room temperature conductivities. The tetragonal phase of Na3PS4 had been known as a sodium conductor for more than 20 years.11 Na3PS4 has gained renewed attention since Hayashi et al. synthesized a room temperature stable glass–ceramic phase, which showed a Na ionic conductivity of 2 × 10⁻⁴ S cm−1 and subsequently increased to 4.6 × 10⁻⁴ S cm−1 by using high purity raw materials.12–15 The conductivity of (1 − x)c–Na3PS4−xNa4SiS4 pseudo-binary system could achieve as high as 7.4 × 10⁻⁴ S cm−1 at x around 0.0629.16,17 The Cl-doped tetragonal Na3PS4 (ref. 18) (t-Na2.9375PS3.9375Cl0.0625) solid electrolyte displayed a Na ion conductivity exceeded 1 × 10⁻³ S cm−1 at room-temperature. Moreover, the cell parameters had played an important role for Na ion transport, such as Na3PSe4 (ref. 19) and Na3SbS4,20 which owned larger cell parameters than Na3PS4, their ionic conductivity increased to 1.16 × 10⁻³ S cm−1 and 3 × 10⁻³ S cm−1, respectively. Recently, Luo and Wang reported a Na-ion solid-state electrolyte of Na3P0.62As0.38S4,21 which had a high ionic conductivity of 1.46 × 10⁻³ S cm−1. Richards et al. reported a family of Na10MP2S12 (M = Sn, Ge, and Si) with a high ionic conductivity of 4 × 10⁻⁴ S cm−1 for Na10SnP2S12, and also predicted a super high ionic conductivity of 10.28 × 10⁻³ S cm−1 for Na10SiP2S12 based on first-principles simulations.22,23 Nonetheless, the sodium superionic conductors are still rate and their room-temperature ionic conductivities can't satisfy the actual needs. Looking for new solid-state sodium ion conductor is highly anticipated for all-solid-state rechargeable sodium ion batteries.
Na3VS4 crystals were reported more than twenty years ago,24 which adopted a tetragonal structure closely related to the Na3PS4.11 However, there is no attention on its sodium ionic conductivity so far. In this study, Na3VS4 was synthesized by solid state method, which owns sodium ionic conductivity of ∼1.16 × 10⁻⁸ to 1.46 × 10⁻⁶ S cm−1 from 25 °C to 100 °C. In order to improve its sodium ionic conductivity, P-doped Na3VS4 (i.e. Na3PxV1−xS4, 0 ≤ x ≤ 0.2) was prepared, which resulted in higher Na-ion conductivity of ∼1.49× 10⁻⁷ to 1.20 × 10⁻⁵ S cm−1 from 25 °C to 100 °C on composition x = 0.1.
Experimental section
Synthesis
Na3PxV1−xS4 (0 ≤ x ≤ 0.2) electrolytes were prepared by solid-state reaction in vacuum. The stoichiometric amounts of Na2S (Aladdin, >95%), P2S5 (Aladdin, 99%), and V (Aladdin, 99.99%) were well-mixed and ground with an agate mortar and pestle for one hour. Then, the mixture powder was vacuum-sealed in a quartz tube and heated at 500 °C for 6 h with a heating or cooling rate of 2 °C min−1. All the processes were carried out in a high purity argon-filled glove box with H2O and O2 below 0.1 ppm.Materials characterization
The X-ray diffraction (XRD) data of as-synthesized samples were collected using a PANalytical X'pert Powder X-ray diffractometer equipped with a Cu Kα radiation operating at an accelerating voltage of 40 kV and current of 40 mA. For Rietveld refinement, the data was acquired in the 2θ range of 10–80° with 0.2028° min−1. For all the XRD measurements, to avoid any undesirable influence of air exposure, the as-obtained powders were sealed in an air-tight container with Kapton tape in an argon-filled glove box. The Rietveld refinements of the XRD data were carried out using Topas-Academic software.25 Raman scattering measurements were performed using DXR Raman Microscope with a 532 nm excitation source. In order to avoid any undesirable influence of air exposure, the as-obtained powders were sealed in an air-tight quartz box.Electrochemical tests
The alternate current (AC) impedance spectroscopy measurements were performed by using a Solartron SI1260 impedance/gain-phase analyzer over a temperature range from 25 to 100 °C and a frequency range from 106 to 10−1 Hz. The pellets (φ 6 mm) for AC impedance spectroscopy measurements were pressed from powders at 1000 MPa. The density of the pressed pellet was about 2.14 g cm−3, and achieved a theoretical density of 90%. Platinum foil was placed on both sides of the pellets as electrodes and current collectors. Platinum wire were attached to both sides as current collectors in a cell. The electrochemical stability of as-obtained sample with metallic sodium was determined via linear sweep voltammograms (LSV) of the Na/Na3VS4/Pt and Na/Na3P0.1V0.9S4/Pt cells at a scan rate of 0.2 mV s−1 from 1 to 6 V at room temperature. To determine electronic conductivity, potentiostatic direct current (DC) polarization measurements were performed on Pt/Na3VS4/Pt and Pt/Na3P0.1V0.9S4/Pt cells by using a Solartron SI1287 electrochemical interface at 25 °C.Results and discussion
The crystalline phase of as-synthesized samples by solid-state reaction were characterized by XRD. The XRD patterns were shown in Fig. 1, the halo patterns from 10° to 30° reflected from the polyimide film. As shown in Fig. 1a, the major diffraction peaks of Na3VS4 could index in tetragonal system with the space group P![[4 with combining macron]](https://www.rsc.org/images/entities/char_0034_0304.gif) 21c (space group no. 114)24 beside some impurities, such as V2O5, S. The XRD data of Na3VS4 was also analyzed with Rietveld refinement (Fig. 1b). The fitting was satisfactory with rather low factors of Rwp ∼ 4.98% and Rp ∼ 3.61%. The cell parameters are a = b = 13.5246(1) Å and c = 7.9500(7) Å, with a unit volume of 1454.1(1) Å3. According the Rietveld refinement results, the content of V2O5 and S was 2.62 wt% and 6.78 wt%, respectively. Detailed structural informations, including the atomic parameters determined from Rietveld refinement, were listed in Table 1. After P-doping, the Na3P0.1V0.9S4 sample could get a single phase (Fig. 1a), however, it exists a second phase of Na3PS4 in Na3P0.2V0.8S4 (Fig. 1a and d). This indicate that the solid-solution in Na3V1−xPxS4 was rather small. The Rietveld refinement of Na3P0.1V0.9S4 with tetragonal Na3VS4 structure model was shown in Fig. 1c. The refined profiles fitted well the observed data, which converged to Rwp ∼ 5.03% and Rp ∼ 3.68%. The refined structural data and refinement parameters were listed in Table 2. The ratio of V/P is 0.88(5)/0.12(5) from the result of Rietveld refinement, which is agreed with the normal composition. The unit cell parameters obtained from the Rietveld refinement are a = b = 13.5051(7) Å, c = 7.9468(4) Å, V = 1449.4(1) Å3, which is a little less than those of Na3VS4. The compared cell parameters were given in Table 3. Due to the ionic radius of P5+ (0.29 Å)11 is smaller than that of V5+ (0.46 Å),25 P doping reduces the unit cell parameters.
21c (space group no. 114)24 beside some impurities, such as V2O5, S. The XRD data of Na3VS4 was also analyzed with Rietveld refinement (Fig. 1b). The fitting was satisfactory with rather low factors of Rwp ∼ 4.98% and Rp ∼ 3.61%. The cell parameters are a = b = 13.5246(1) Å and c = 7.9500(7) Å, with a unit volume of 1454.1(1) Å3. According the Rietveld refinement results, the content of V2O5 and S was 2.62 wt% and 6.78 wt%, respectively. Detailed structural informations, including the atomic parameters determined from Rietveld refinement, were listed in Table 1. After P-doping, the Na3P0.1V0.9S4 sample could get a single phase (Fig. 1a), however, it exists a second phase of Na3PS4 in Na3P0.2V0.8S4 (Fig. 1a and d). This indicate that the solid-solution in Na3V1−xPxS4 was rather small. The Rietveld refinement of Na3P0.1V0.9S4 with tetragonal Na3VS4 structure model was shown in Fig. 1c. The refined profiles fitted well the observed data, which converged to Rwp ∼ 5.03% and Rp ∼ 3.68%. The refined structural data and refinement parameters were listed in Table 2. The ratio of V/P is 0.88(5)/0.12(5) from the result of Rietveld refinement, which is agreed with the normal composition. The unit cell parameters obtained from the Rietveld refinement are a = b = 13.5051(7) Å, c = 7.9468(4) Å, V = 1449.4(1) Å3, which is a little less than those of Na3VS4. The compared cell parameters were given in Table 3. Due to the ionic radius of P5+ (0.29 Å)11 is smaller than that of V5+ (0.46 Å),25 P doping reduces the unit cell parameters.
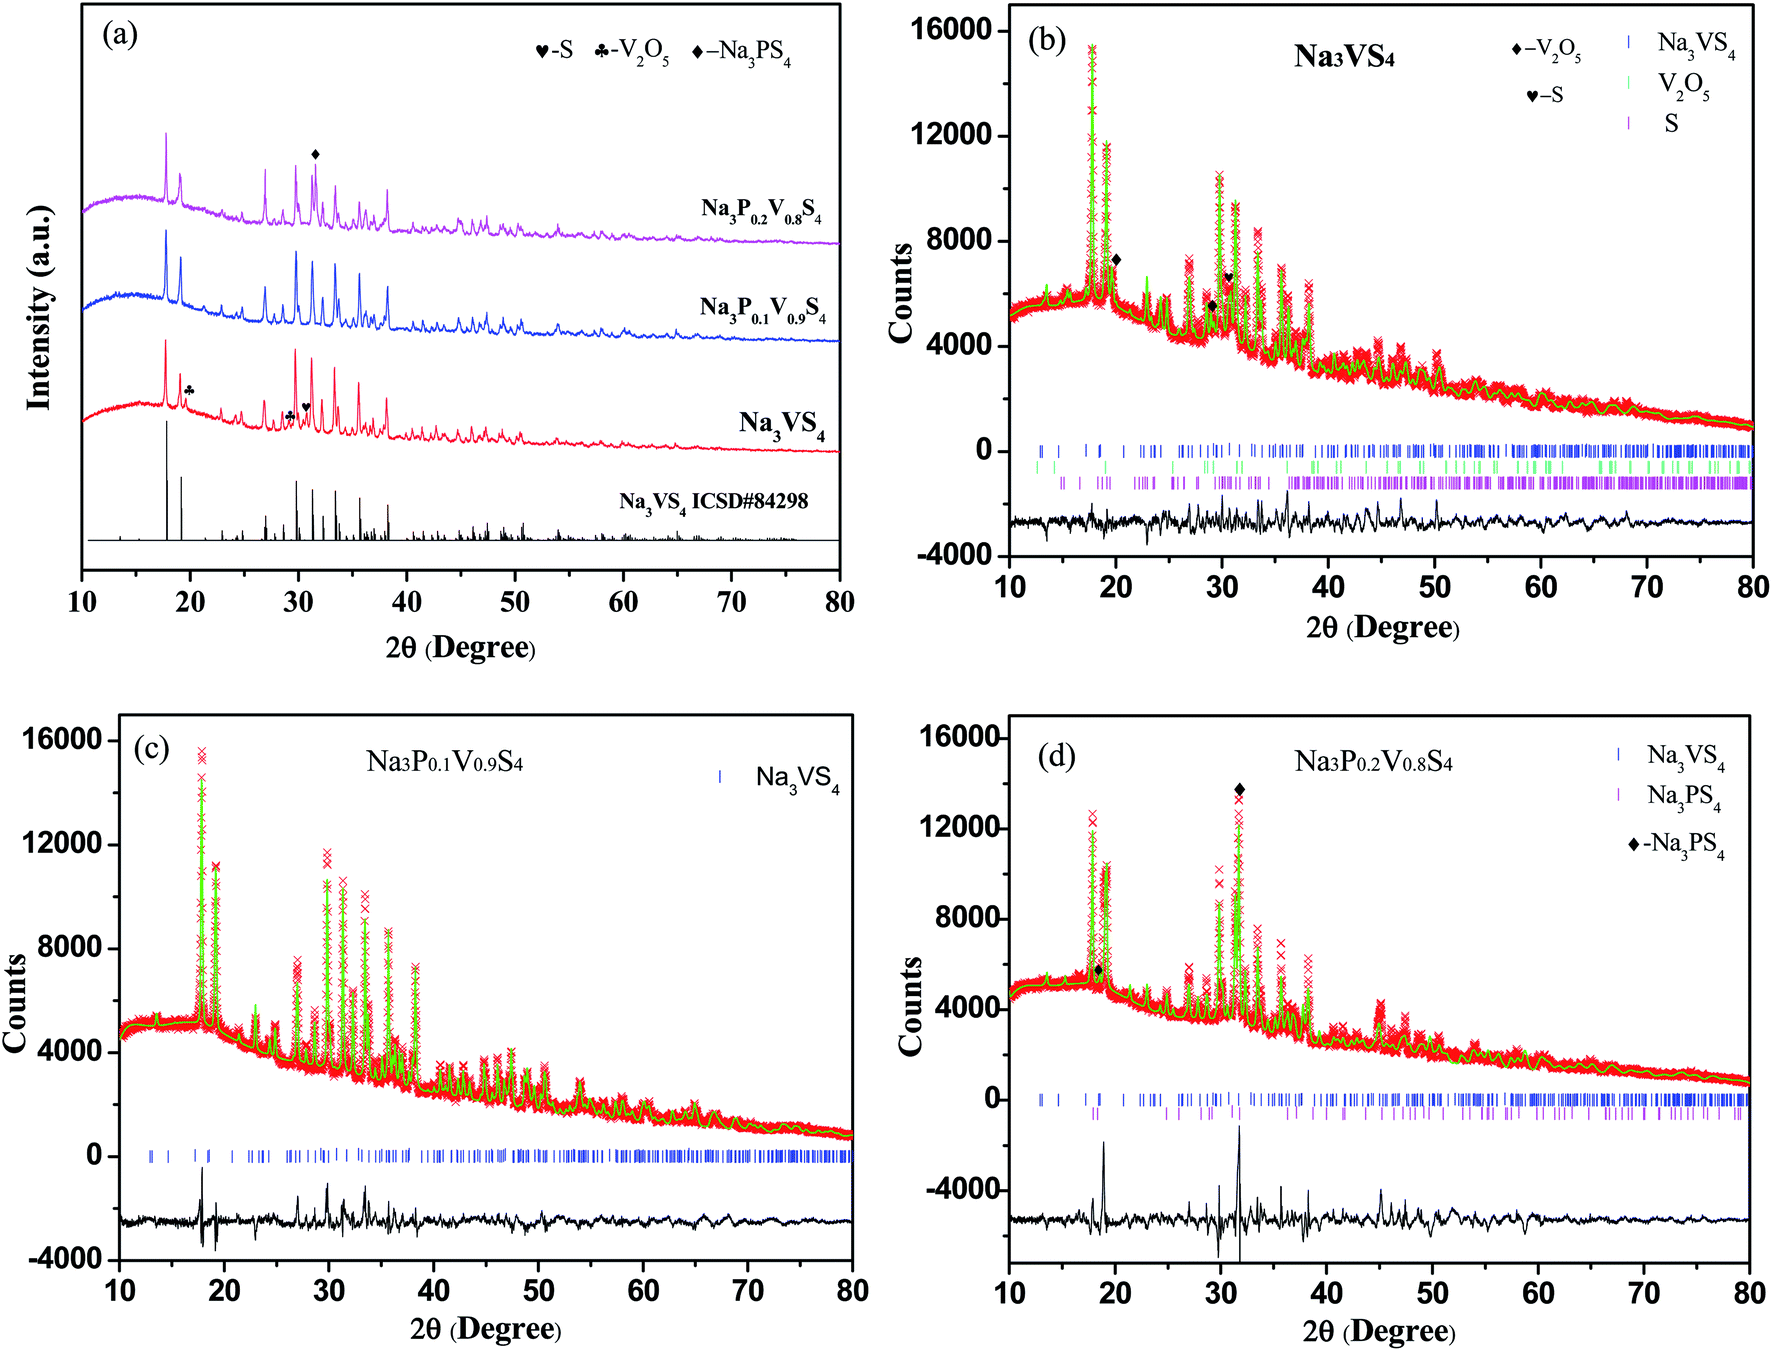 | ||
| Fig. 1 (a) XRD patterns of Na3PxV1−xS4, (0 ≤ x ≤ 0.2) samples. (b) Rietveld refinement plots of XRD for tetragonal Na3VS4, the reliability factors are Rwp = 4.98% and Rp = 3.61%. (c) Rietveld refinement plots of XRD for tetragonal Na3P0.1V0.9S4, the reliability factors are Rwp = 5.03% and Rp = 3.68%. (d) Rietveld refinement plots of XRD for tetragonal Na3P0.2V0.8S4, the reliability factors are Rwp = 7.79% and Rp = 5.18%. | ||
| Atom | Site | x | y | z | Occupancy | Biso (Å2) |
|---|---|---|---|---|---|---|
| a Space group: P21c, a = b = 13.5246(1) Å, c = 7.9500(7) Å, V = 1454.1(2) Å3. |
||||||
| Na1 | 4d | 0 | 0.5 | 0.5314(26) | 1 | 0.9(5) |
| Na2 | 4c | 0.5 | 0.5 | 0.7260(29) | 1 | 0.9(5) |
| Na3 | 8e | 0.7528(13) | 0.5468(10) | 0.8531(16) | 1 | 0.9(5) |
| Na4 | 8e | 0.7544(13) | 0.8004(9) | 0.9030(20) | 1 | 0.9(5) |
| V1 | 8e | 0.0100(5) | 0.7409(5) | 0.7849(9) | 1 | 2.6(2) |
| S1 | 8e | 0.6806(7) | 0.5051(9) | 0.5262(12) | 1 | 1.2(3) |
| S2 | 8e | 0.8660(7) | 0.6853(7) | 0.6699(13) | 1 | 1.2(3) |
| S3 | 8e | 0.6069(7) | 0.9049(8) | 0.7042(15) | 1 | 1.2(3) |
| S4 | 8e | 0.5805(8) | 0.6409(9) | 0.8972(13) | 1 | 1.2(3) |
| Atom | Site | x | y | z | Occupancy | Biso (Å2) |
|---|---|---|---|---|---|---|
| a Space group: P21c, a = b = 13.5051(5) Å, c = 7.9467(4) Å, V = 1449.5(1) Å3. |
||||||
| Na1 | 4d | 0 | 0.5 | 0.5606(19) | 1 | 1.7(2) |
| Na2 | 4c | 0.5 | 0.5 | 0.7189(19) | 0.92(3) | 1.7(2) |
| Na3 | 8e | 0.7580(9) | 0.5477(7) | 0.8339(13) | 1 | 1.7(2) |
| Na4 | 8e | 0.7577(9) | 0.7970(7) | 0.9361(15) | 1 | 1.7(2) |
| V1/P1 | 8e | 0.0101(3) | 0.7347(3) | 0.7811(5) | 0.88(5)/0.12(5) | 0.2(2) |
| S1 | 8e | 0.6860(5) | 0.5140(5) | 0.5226(9) | 1 | 0.8(1) |
| S2 | 8e | 0.8748(5) | 0.6877(5) | 0.6752(10) | 1 | 0.8(1) |
| S3 | 8e | 0.6129(5) | 0.8929(5) | 0.6967(12) | 1 | 0.8(1) |
| S4 | 8e | 0.5744(6) | 0.6609(6) | 0.8843(8) | 1 | 0.8(1) |
| Composition | a/b (Å) | c (Å) | V (Å3) |
|---|---|---|---|
| Na3VS4 | 13.5246(1) | 7.9500(7) | 1454.1(2) |
| Na3P0.1V0.9S4 | 13.5051(5) | 7.9467(4) | 1449.5(1) |
Fig. 2 shows the Raman spectrum of Na3VS4 and Na3P0.1V0.9S4 at room temperature. The broad peak located at 450 cm−1 derived from the quartz box, and the peaks situated at about 490, 600 and 800 cm−1 could assign to the V–S or V/P–S vibrations of the isolated of VS43− or V/PS43− group, verifying the successful formation of VS43− or V/PS43− group.12,20
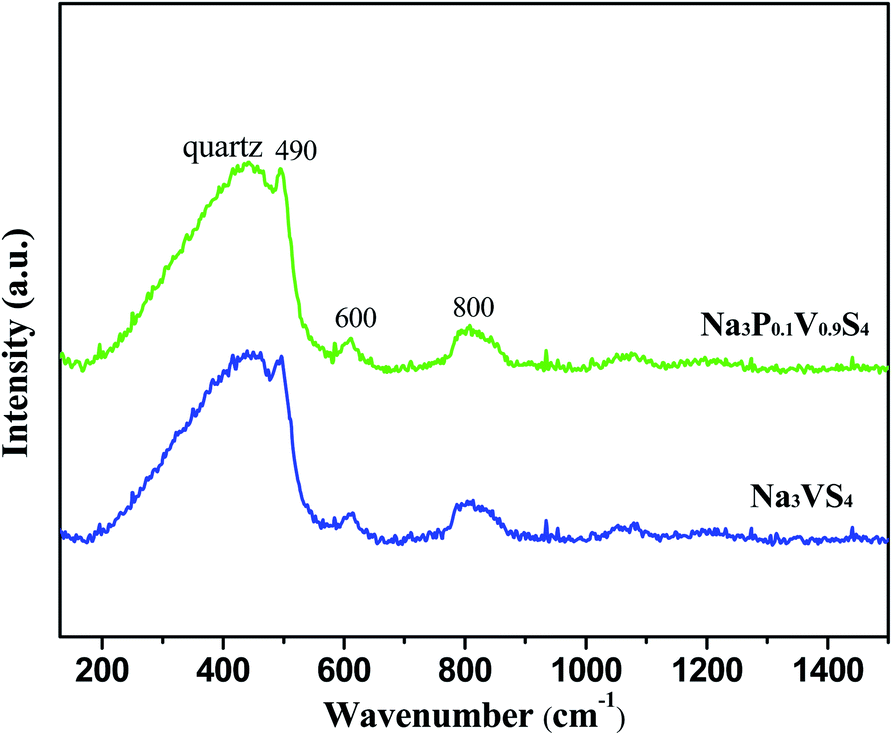 | ||
| Fig. 2 Raman spectrum of Na3VS4 and Na3P0.1V0.9S4. | ||
The crystal structure of tetragonal Na3VS4 viewed along c axes is given in Fig. 3a. The crystallographic structure unit cell can be simply described as consisting of isolated VS43− tetrahedral groups separated by sodium cations. In unit cell, the Na1, Na2, Na3, Na4 atoms sit on 4d, 4c, 8e, 8e Wyckoff sites, V atoms locate at 8e sites and S atoms situate in 8e Wyckoff sites. The V–S distance are 2.38(1) Å (V–S1), 2.28 Å(1) (V–S2), 2.37(1) Å (V–S3), 2.36(1) Å (V–S4) and the S–V–S angles are 104.3° (S4–V–S1), 115.4° (S2–V–S1), 102.3° (S3–V–S2), 111.3° (S3–V–S4), 114.5° (S3–V–S1), 108.8° (S2–V–S4). In the crystal structure, Na atoms site on 4d (Na1), 4c (Na2), 8e (Na3), 8e (Na4) Wyckoff sites with different coordination environments (Fig. 3b), which are six-coordination for Na1, eight-coordination for Na2, six-coordination for Na3 and seven-coordination for Na4, respectively. Especially, Na2 atom connects to eight sulfur atoms and from an anion framework, all of these Na2 ion diffusion channels are constructed along mutually perpendicular paths (inset in the Fig. 3a). This anion framework is body-centered cubic framework, which benefits Na ion diffusion. This phenomenon similar to Gerbrand Ceder and co-workers proposed design principles for superionic conductors, they suggested that the body-centered cubic frameworks allow the migration of ions with a lower activation barrier than in other close-packed frameworks, thus resulting in fast ion diffusion.26 Moreover, because of the ionic radius of P5+ less than the V5+, the bond length of V/P–S is shorter than that of V–S (Fig. 3c). Also, as comparing in Table 4, the average bond length of Na2–S in Na3V0.9P0.1S4 (3.60(6) Å) was larger than that of Na3VS4 (3.51(7) Å), indicating that sulfur anion channels in Na3P0.1V0.9S4 were larger than the sulfur anion channels in Na3VS4. The larger channel reduced the force between sodium and sulfur, which is beneficial for Na ion diffusion.
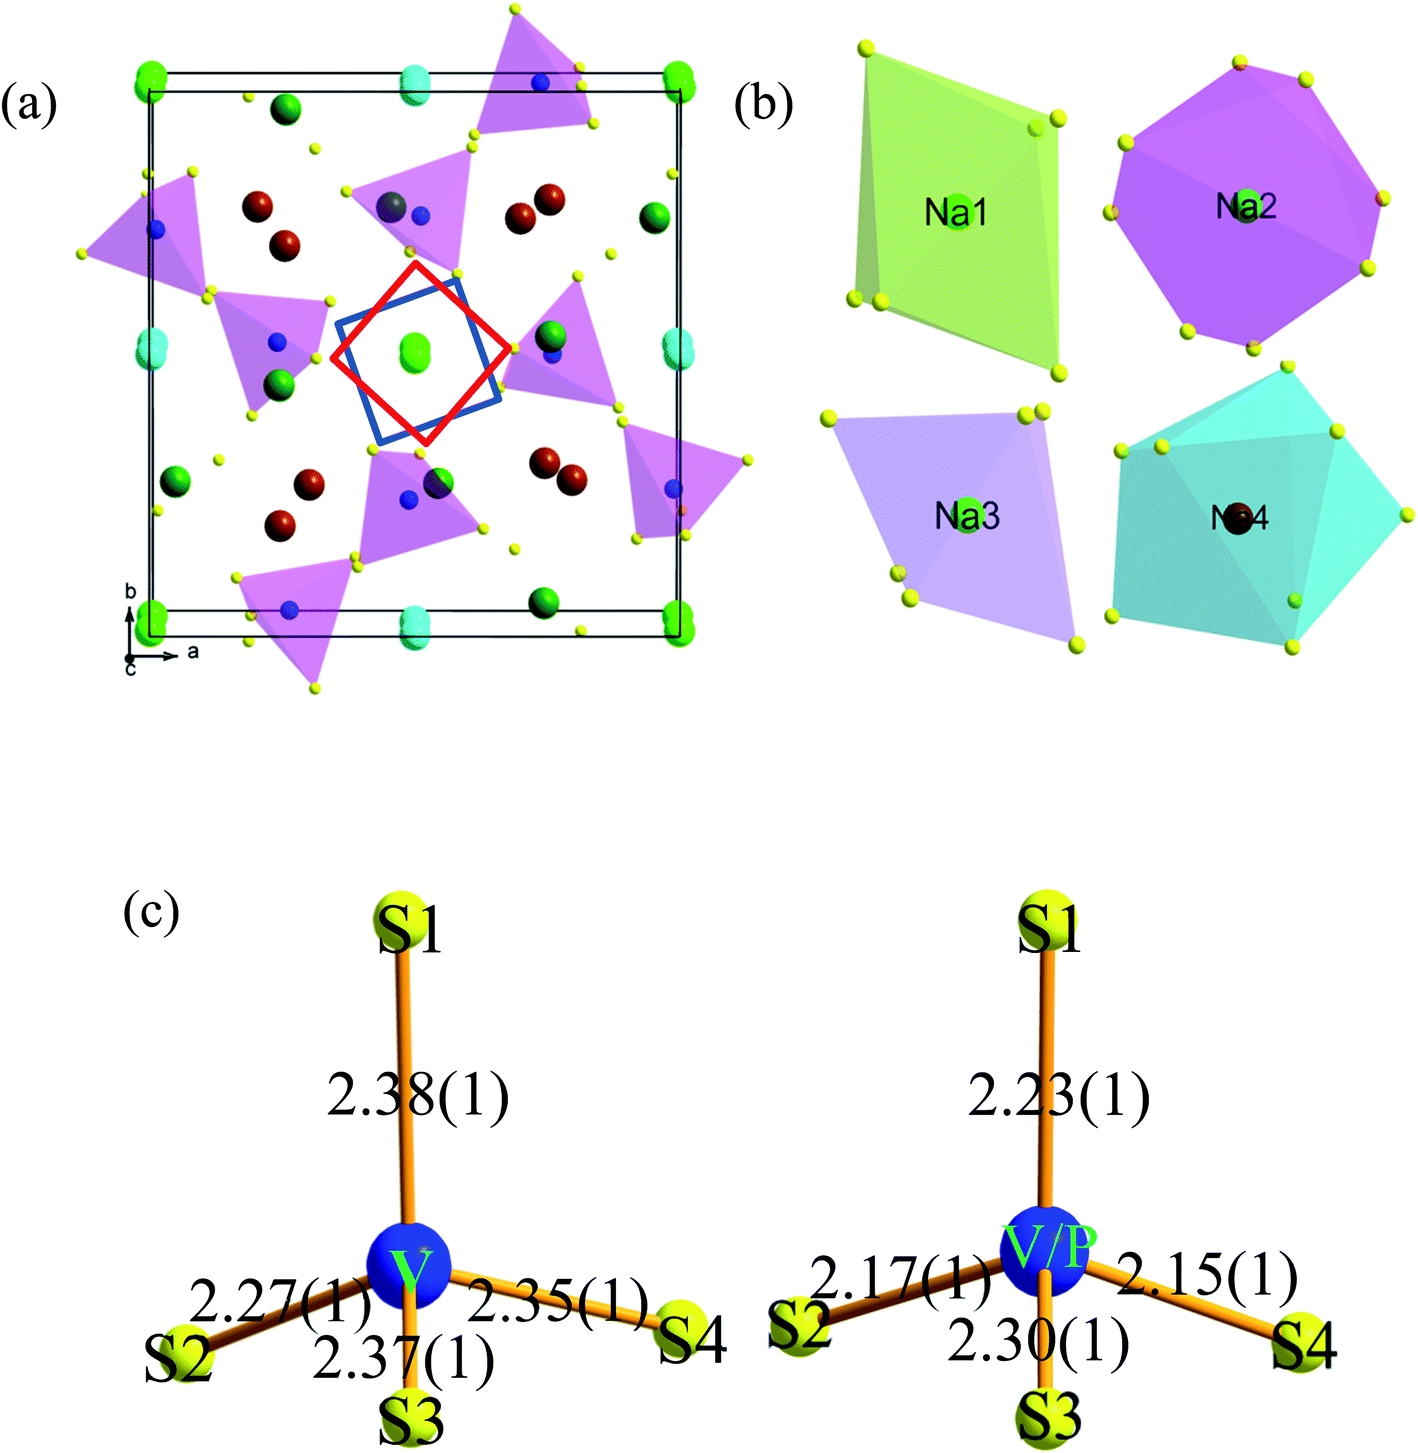 | ||
| Fig. 3 (a) The crystal structure of Na3VS4 viewed along c, Na1 (turquoise), Na2 (bright green), Na3 (green), Na4 (brown), V (blue), S (yellow). (b) Na1 (turquoise), Na2 (bright green), Na3 (green), Na4 (brown) coordination environments. (c) Atomic and bond lengths of VS4 and V/PS4 polyhedron. | ||
| Na3VS4 | Length (Å) | Na3V0.9P0.1S4 | Length (Å) |
|---|---|---|---|
| Na2–S1(×2) | 3.15(1) | Na2–S1(×2) | 3.25(1) |
| Na2–S1(×2) | 2.91(1) | Na2–S1(×2) | 2.98(1) |
| Na2–S4(×2) | 2.58(1) | Na2–S4(×2) | 2.69(1) |
| Na2–S4(×2) | 5.41(1) | Na2–S4(×2) | 5.48(1) |
| 〈L〉 | 3.51(6) | 〈L〉 | 3.60(7) |
The conductivity of pressed pellets of Na3VS4 and Na3V0.9P0.1S4 were evaluated by AC impedance spectroscopy, which were conducted in the frequency range from 106 Hz to 0.1 Hz at 25–100 °C. The Nyquist plots of the impedance spectra of Na3VS4 and Na3P0.1V0.9S4 were shown in Fig. 4a and b, respectively. The impedance spectra both of Na3VS4 and Na3P0.1V0.9S4 contained a semicircle in the high-frequency region, which became smaller with increasing temperature. In the low frequency region, the semicircle segments follow a Warburg-type impedance,27–29 which is associated with capacitive behavior and similar to the blocking electrodes.30 The linear spike in the low-frequency region indicates Na3VS4 and Na3P0.1V0.9S4 were typical ionic conductor.
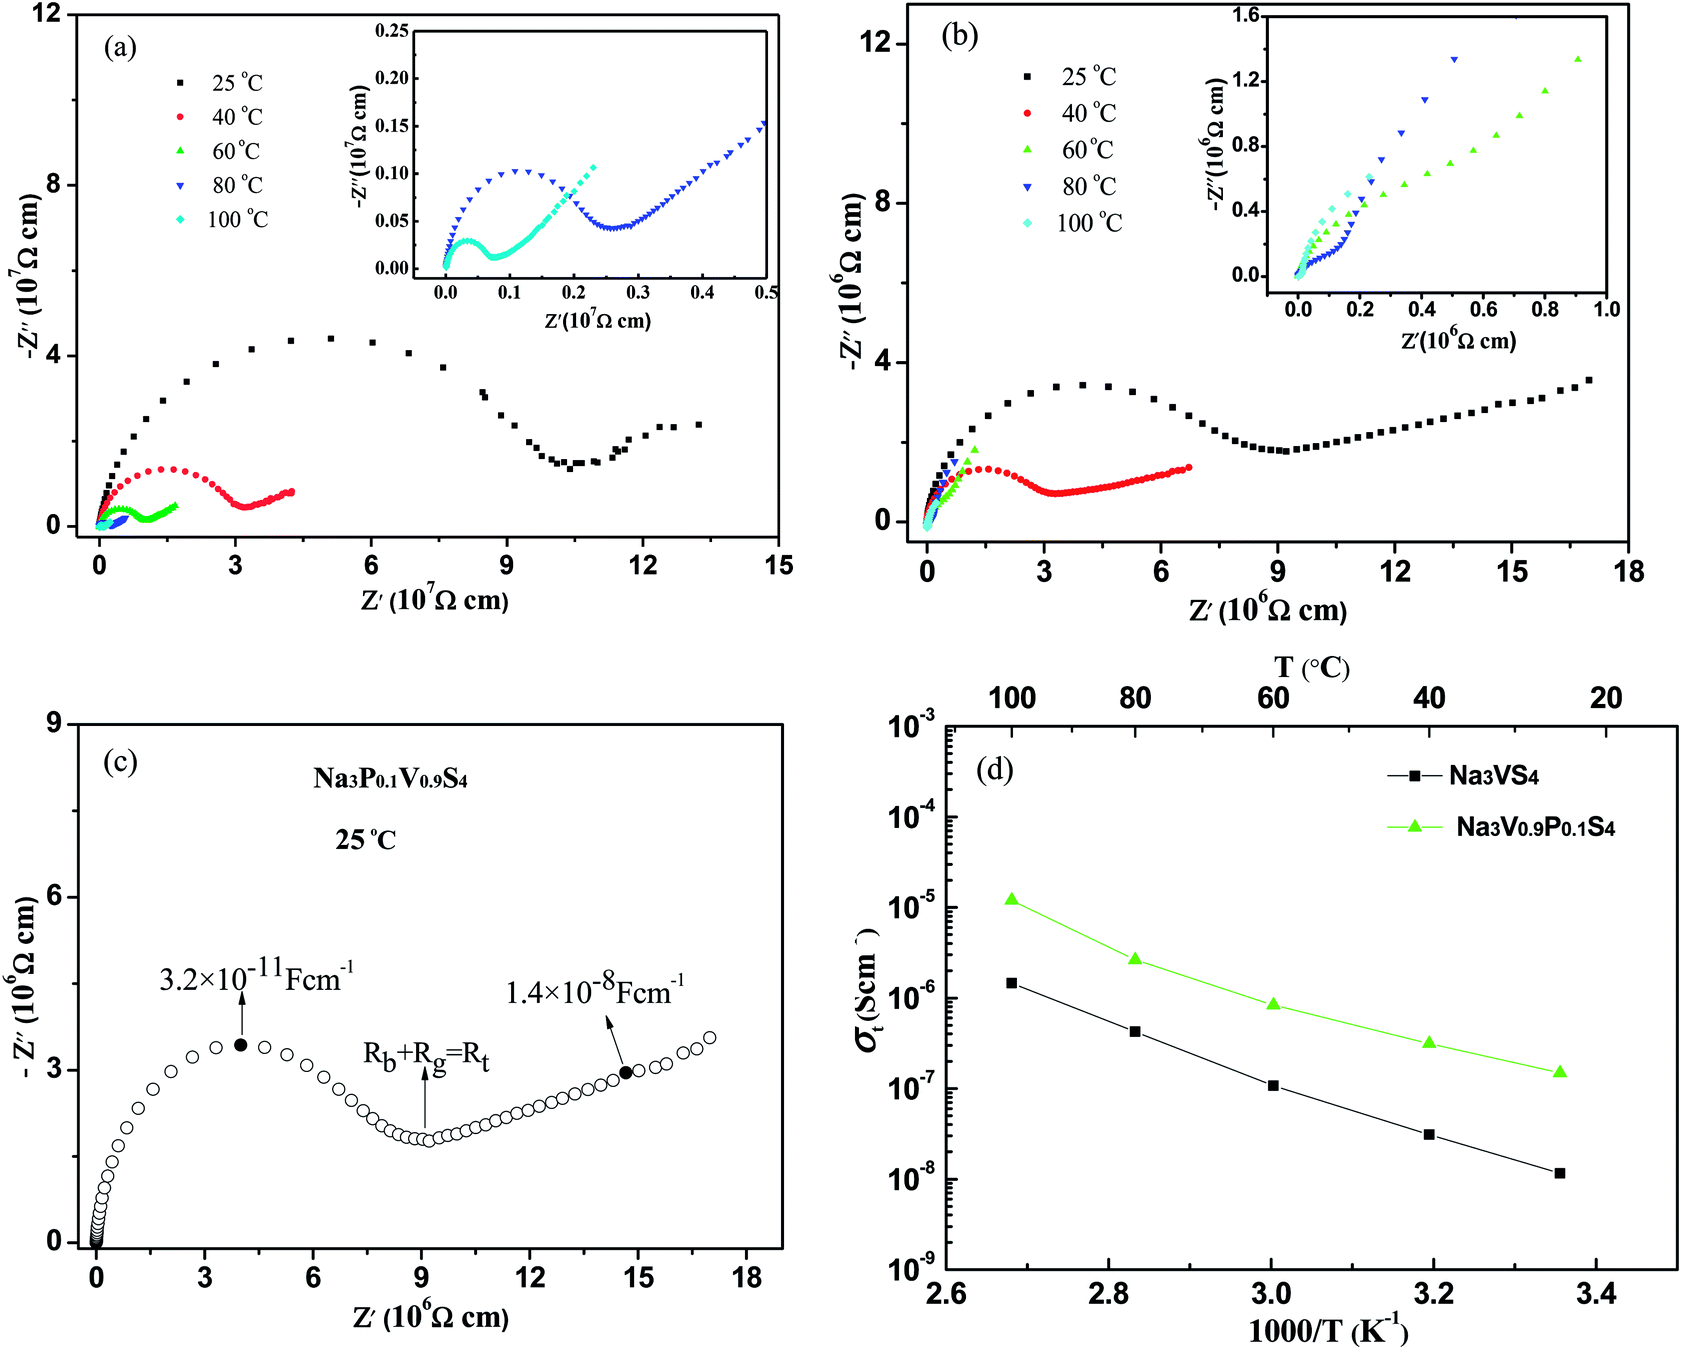 | ||
| Fig. 4 (a) Nyquist impedance plot of Na3VS4 from 25 to 100 °C. (b) Nyquist impedance plot of Na3P0.1V0.9S4 from 25 to 100 °C. (c) Typical complex impedance plots of Na3P0.1V0.9S4 at 25 °C, Rb, Rg and Rt denote bulk, grain boundary and total resistivities, respectively. (d) Arrhenius conductivity plots of Na3VS4 and Na3P0.1V0.9S4 from 25 to 100 °C. | ||
The Nyquist plot of Na3P0.1V0.9S4 at 25 °C (Fig. 4c) comprised bulk, grain boundary and electrode polarization. The high-frequency semicircle is characterized by a capacitance about 3 × 10⁻¹¹ F cm−1 and could be attributed to ion transport in the crystalline and crystalline grains.31 The electrode response was a Warburg-type spike characteristic of ion conductor. The total ionic conductivity (σt) could be calculated according to the formula:31
| σ = R/(L·S) | (1) |
The linear dependence of log![[thin space (1/6-em)]](https://www.rsc.org/images/entities/char_2009.gif) σt versus (1/T) follows the Arrhenius law and indicates phase stability over the given temperature range. As show in the Table 5, the total ionic conductivity of Na3VS4 located in the range from 1.16 × 10⁻⁸ S cm−1 at 25 °C to 1.46 × 10⁻⁶ S cm−1 at 100 °C. However, the total ionic conductivity of Na3P0.1V0.9S4 placed 1.49 × 10⁻⁷ S cm−1 at 25 °C to 1.20 × 10⁻⁵ S cm−1 at 100 °C, which almost one order of magnitude higher than those of Na3VS4. The activation energy Ea for the sodium-ion conductor is determined from the slope of the linear Arrhenius plot using below equation:32
σt versus (1/T) follows the Arrhenius law and indicates phase stability over the given temperature range. As show in the Table 5, the total ionic conductivity of Na3VS4 located in the range from 1.16 × 10⁻⁸ S cm−1 at 25 °C to 1.46 × 10⁻⁶ S cm−1 at 100 °C. However, the total ionic conductivity of Na3P0.1V0.9S4 placed 1.49 × 10⁻⁷ S cm−1 at 25 °C to 1.20 × 10⁻⁵ S cm−1 at 100 °C, which almost one order of magnitude higher than those of Na3VS4. The activation energy Ea for the sodium-ion conductor is determined from the slope of the linear Arrhenius plot using below equation:32
|
σt = Aexp(−Ea/kBT)
| (2) |
| Composition | 25 °C (S cm−1) | 40 °C (S cm−1) | 60 °C (S cm−1) | 80 °C (S cm−1) | 100 °C (S cm−1) |
|---|---|---|---|---|---|
| Na3VS4 | 1.16 × 10⁻⁸ | 3.11 × 10⁻⁸ | 1.07 × 10⁻⁷ | 4.23 × 10⁻⁷ | 1.46 × 10⁻⁶ |
| Na3P0.1V0.9S4 | 1.49 × 10⁻⁷ | 3.14 × 10⁻⁷ | 8.30 × 10⁻⁷ | 2.63 × 10⁻⁶ | 1.20 × 10⁻⁵ |
Compared with Na3VS4, the P-doping Na3P0.1V0.9S4 showed higher Na ionic conductivity. Through P substitution for V on Na3P0.1V0.9S4 composition, it could decrease the size of V/PS43− tetrahedra and enlarge some sulfur anion channels. From the Rietveld refinement of Na3P0.1V0.9S4 data, the occupancy of Na2 sites contains 92% Na plus 8% vacancies rather than full occupancy of Na. Recently, theoretical investigations on both Na3PS4 (ref. 14) and Na3PSe4 (ref. 19) revealed that a defect-driven diffusion mechanism (either Na ion interstitial or Na ion vacancy) accounts for the high ionic conductivity. Actually, Na ion deficiency is the reality during synthesis as it is a very reactive metal. Therefore, an ultrafast ion diffusion is expected if the conductor meets the prerequisites of sodium vacancy defects. In this work, these are about 8% of sodium vacancies in the Na2 position, therefore, these sodium vacancies are conducive to the diffusion of sodium ions. Benefit from these favorable features, P doping Na3V0.9P0.1S4 gets higher Na ion conductivity.
The total conductivity generally includes ionic conductors, minor electrons and/or holes (σ(e+h)). Na3VS4 and Na3P0.1V0.9S4 total conductivity can be expressed by σt = σNa+ + σ(e+h). The transference number for sodium ions is accordingly derived by tNa+ = σNa+/σt.20 To evaluate the exactly contribution of the electronic contribution to the total conductivity in the Na3VS4 and Na3P0.1V0.9S4 electrolytes, potentiostatic (0.5 V was used in the present work) DC measurements were carried out on Pt/Na3VS4/Pt and Pt/Na3P0.1V0.9S4/Pt cells at 25 °C. The electronic conductivity curves were displayed in Fig. 5a and b. When the measurement was performed, as there are no external sources for Na+ ions, the electrodes are therefore blocking for Na+ ions, and the conductivity at steady stage under a DC voltage could be ascribed to the electronic conduction. According to the chronoamperometric curves, the electronic resistance can calculate from the formula R = U/I at steady stage, and then according to eqn (1) get the electronic conduction. The calculated values of σ(e+h) are about 8.60 × 10⁻⁹ and 1.76 × 10⁻⁸ S cm−1 for Na3VS4 and Na3P0.1V0.9S4, respectively. Therefore, the calculated transport number of sodium ions (tNa+) are about 0.3 for Na3VS4 and 0.9 for Na3P0.1V0.9S4 according to t Na+ = σNa+/σt, indicating that P-doing could greatly improve the transport number of sodium ions leading to higher total conductivity.
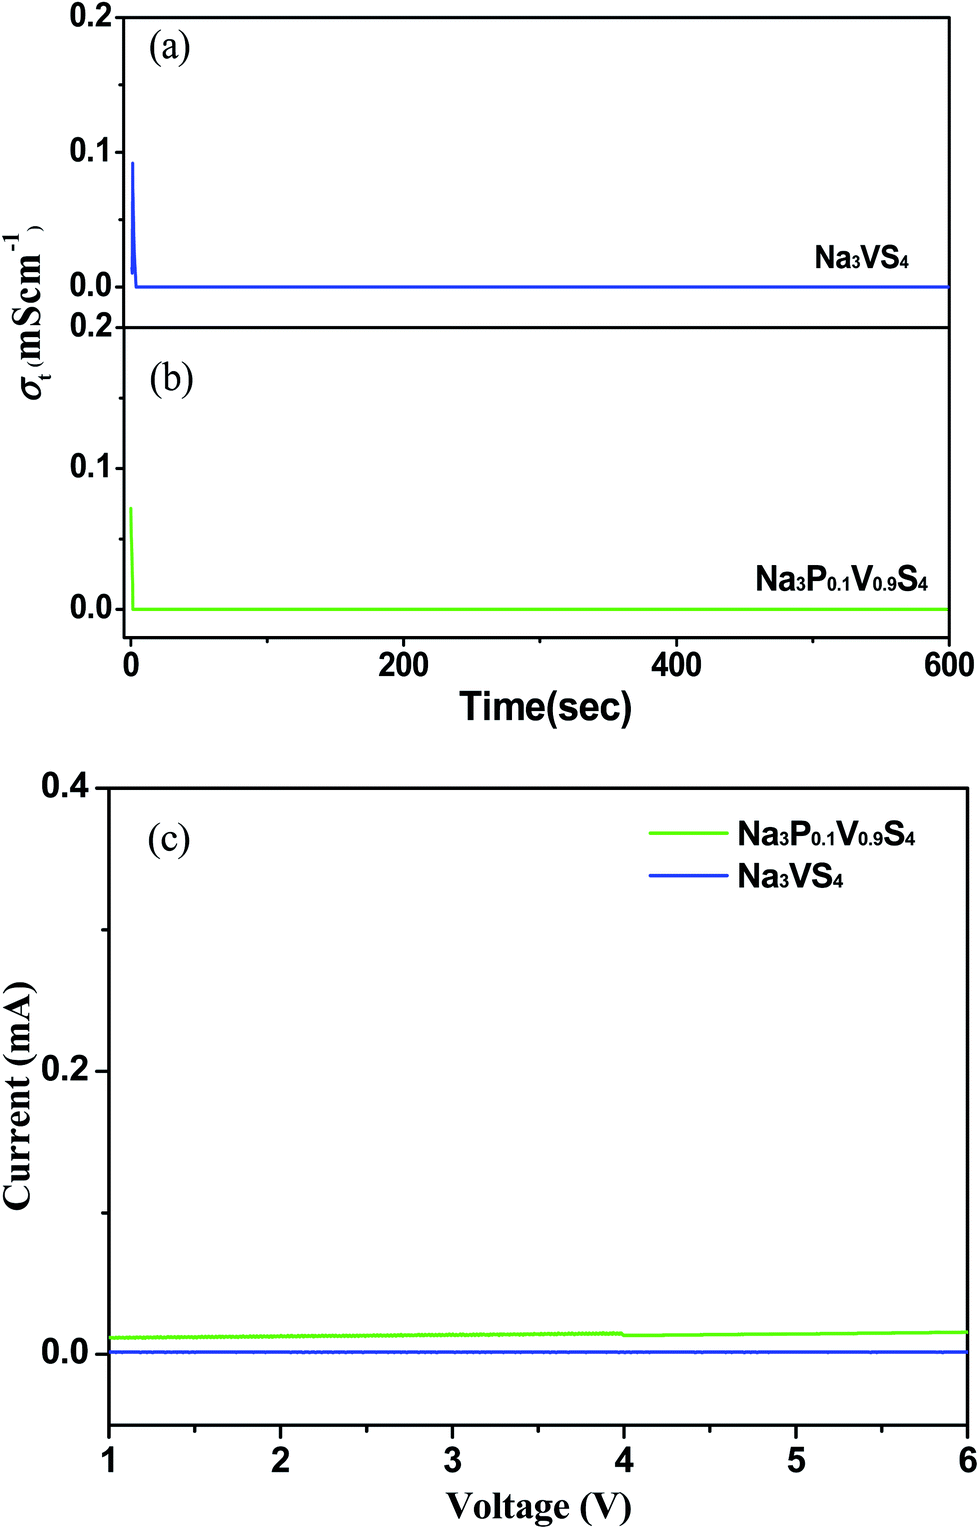 | ||
| Fig. 5 Electronic conductivity curves for Na3VS4 (a) and Na3P0.1V0.9S4 (b), (c) LSV curves of Na3VS4 and Na3P0.1V0.9S4. | ||
The electrochemical stability of Na3VS4 and Na3P0.1V0.9S4 with metallic sodium was estimated by using linear sweep voltammograms (LSV) on the Na/Na3VS4/Pt and Na/Na3P0.1V0.9S4/Pt cells,33 as shown in Fig. 5c. Both of LSV curves do not appear apparent redox peak, indicating Na3VS4 and Na3P0.1V0.9S4 solid-state electrolytes exhibit a high electrochemical stability window up to 6 V.
Conclusion
In summary, a new Na-ion solid-state electrolyte Na3VS4 with the space group P21c was synthesized and investigated. Na1, Na2, Na3 and Na4 atoms locate at the 4d, 4c, 8e and 8e Wyckoff sites in the structure, respectively. Na2 atom sites bound to eight sulfur atoms and from a body-centered cubic anion framework, which is beneficial for Na ion diffusion. The total ionic conductivity of the parent composition Na3VS4 is ∼1.16 × 10⁻⁸ to 1.46 × 10⁻⁶ S cm−1 from 25 to 100 °C. After substituting for V with P, the P-doping composition Na3P0.1V0.9S4, got the conductivity of 1.49 × 10⁻⁷ to 1.20 × 10⁻⁵ S cm−1 from 25 to 100 °C, which was higher than that of parent Na3VS4. The improvement of ion conductivity could ascribe to small P substitution for the large V giving rise to broaden the Na migration path and create of sodium vacancies. Also, both of Na3VS4 and Na3P0.1V0.9S4 solid-state electrolytes exhibit a high electrochemical stability window up to 6 V. This work will enrich the field of view sulfate-based sodium ion conductors and paves a new way to design new solid-state conductors for the next generation of solid-state Na ion batteries.
Conflicts of interest
There are no conflicts to declare.Acknowledgements
The authors acknowledge the financial support of the National Natural Science Foundation of China (No. 21622101) and Guangxi Natural Science Foundation (No. 2017GXNSFBA198149).References
- D. Larcher and J. M. Tarascon, Nat. Chem., 2015, 7, 19–29 CrossRef CAS PubMed
.
- H. Kim, Z. Ding, M. H. Lee, K. Lim and G. Yoon, Adv. Energy Mater., 2016, 6, 1600943 CrossRef
- X. B. Cheng, R. Zhang, C. Z. Zhao, F. Wei, J. G. Zhang and Q. Zhang, Adv. Sci., 2016, 3, 1500213 CrossRef PubMed
- H. Cheng, J. Liang and Z. Tao, Adv. Mater., 2011, 23, 1695–1715 CrossRef PubMed
- J. B. Goodenough and Y. Kim, Chem. Mater., 2010, 22, 587–603 CrossRef CAS
- D. Bruce, K. Haresh and J. M. Tarascon, Science, 2011, 334, 928–935 CrossRef PubMed
- J. J. Kim, K. Yoon, I. Park and K. Kang, Small Methods, 2017, 1, 1700219 CrossRef
- J. Zhang, H. Wen, L. Yue, J. Chai, J. Ma and P. Hu, Small, 2017, 13, 1–10 Search PubMed
- K. Noriaki, H. Kenji, Y. Yuichiro, H. Masaaki, K. Ryoji and Y. Masao, Nat. Mater., 2011, 10, 682–686 CrossRef PubMed
- Y. Kato, S. Hori, T. Saito, K. Suzuki, M. Hirayama and A. Mitsui, Nat. Energy, 2016, 1, 16030 CrossRef CAS
- M. Jansen and U. Henseler, J. Solid State Chem., 1992, 99, 110–119 CrossRef CAS
- A. Hayashi, K. Noi, A. Sakuda and M. Tatsumisago, Nat. Commun., 2011, 3, 856 CrossRef PubMed
- A. Hayashi, K. Noi, N. Tanibata, N. Motohiro and M. Tatsumisago, J. Power Sources, 2011, 258, 420–423 CrossRef
- N. J. J. D. Klerk and M. Wagemaker, Chem. Mater., 2016, 28, 3122–3130 CrossRef
- K. Noi, A. Hayashi and M. Tatsumisago, J. Power Sources, 2014, 269, 260–265 CrossRef CAS
- N. Tanibata, K. Noi, A. Hayashi, N. Kitamura, Y. Idemoto and M. Tatsumisago, ChemElectroChem, 2014, 1, 1130–1132 CrossRef CAS
- N. Tanibata, K. Noi, A. Hayashi and M. Tatsumisago, RSC Adv., 2014, 4, 17120 RSC
- I. H. Chu, C. S. Kompella, N. Han, Z. Zhu, S. Hy and Z. Deng, Sci. Rep., 2016, 6, 33733 CrossRef CAS PubMed
- L. Zhang, K. Yang, J. Mi, L. Lu, L. Zhao and L. Wang, Adv. Energy Mater., 2015, 5, 1501294 CrossRef
- L. Zhang, D. Zhang, K. Yang, X. Yan, L. Wang and J. Mi, Adv. Sci., 2016, 3, 1600089 CrossRef PubMed
- Z. Yu, S. Sl, S. Jh, D. Wang, X. Luo and Q. Huang, Adv. Mater., 2017, 29, 1605561 CrossRef PubMed
- M. Duchardt, U. Ruschewitz, S. Dehnen and B. Roling, Angew. Chem., Int. Ed., 2018, 57, 1351 CrossRef CAS PubMed
- W. D. Richards, T. Tsujimura, L. J. Miara, Y. Wang, J. C. Kim and S. P. Ong, Nat. Commun., 2016, 7, 11009 CrossRef CAS PubMed
- K. O. Klepp and G. Gabl, Eur. J. Solid State Inorg. Chem., 1997, 34, 1143–1154 CAS
- A. A. C. Coelho Software, Brisbane, Australia, 2005
- Y. Wang, W. D. Richards, S. P. Ong, L. J. Miara, J. C. Kim, Y. Mo and G. Ceder, Nat. Mater., 2015, 14, 1026 CrossRef CAS PubMed
- P. Bron, S. Johansson, K. Zick, J. Schmedt auf der Günne, S. Dehnen and B. Roling, J. Am. Chem. Soc., 2013, 135, 15694–15697 CrossRef CAS PubMed
- M. Tatsumisago, M. Nagao and A. Hayashi, J. Asian Ceram. Soc., 2013, 1, 17–25 CrossRef
- M. Duchardt, U. Ruschewitz, S. Dehnen and B. Roling, Angew. Chem., Int. Ed., 2017, 57, 1351–1355 CrossRef PubMed
- X. Feng, P. H. Chien, Z. Zhu, I. H. Chu, P. Wang, M. Immediato-Scuotto, H. Arabzadeh, S. P. Ong and Y. Y. Hu, Adv. Funct. Mater., 2019, 29, 1807951 CrossRef
- T. S. Irvine, C. Sinclair and A. R. West, Adv. Mater., 1990, 2, 132–138 CrossRef
- G. Sahu, L. Zhan, J. Li, Z. Liu and C. Liang, Energy Environ. Sci., 2014, 7, 1053–1058 RSC
- G. K. Kim, Y. J. Lim, H. Kim, Z. Liu and G. B. Cho, Energy Environ. Sci., 2015, 8, 3589–3596 RSC
| This journal is © The Royal Society of Chemistry 2019 |