DOI:
10.1039/C9RA08665J
(Paper)
RSC Adv., 2019,
9, 42509-42515
Synthesis and biological evaluation of geldanamycin–ferulic acid conjugate as a potent Hsp90 inhibitor†
Received
22nd October 2019
, Accepted 16th December 2019
First published on 23rd December 2019
Abstract
A novel geldanamycin–ferulic acid conjugate LZY228 was prepared and evaluated for anti-proliferation activity on human cancer cell line MDA-MB-231. Compound LZY228 exhibited potent cytotoxicity with IC50 value of 0.27 μM, which was more potent than 17-AAG. Hepatotoxicity test in mice demonstrated that the levels of both AST and ALT of LZY228-treated group were lower than that of GA-treated group, indicating that LZY228 was a promising antitumor candidate. In addition, excellent in vivo antitumor potency of LZY228 was observed in MDA-MB-231 xenograft model, which was superior to reference drug 17-AAG. Docking and MD refinement of the Hsp90-LZY228 complex give us an explanation of theoretical binding model of 17-ferulamido-17-demethoxygeldanamycins at molecular level.
1. Introduction
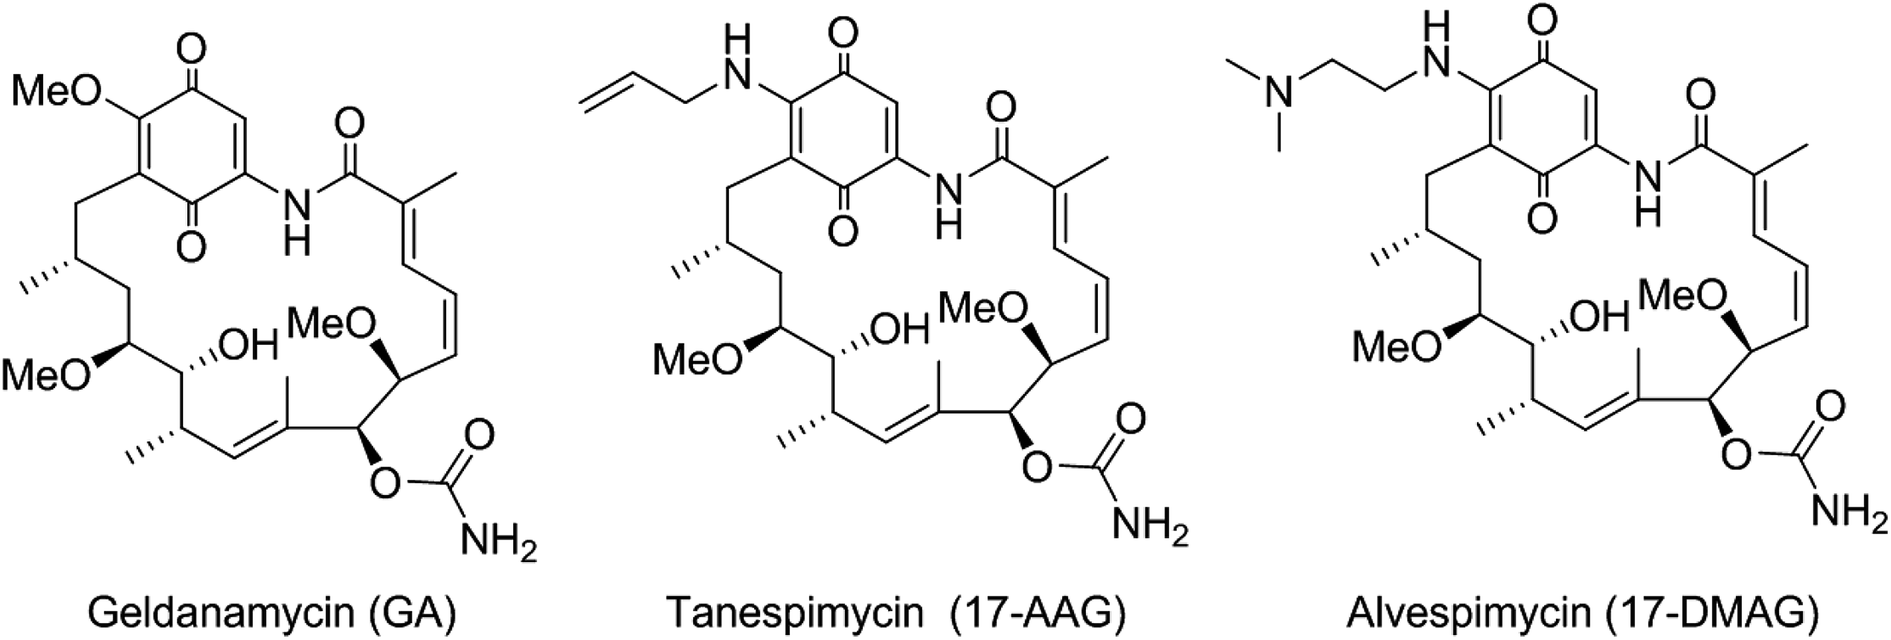
Geldanamycin (GA), a benzoquinone ansamycin antibiotic, binds to the N-terminal ADP/ATP binding domain of heat shock protein 90 (Hsp90) leading to its degradation.1,2 Hsp90 is a highly abundant protein, essential for cell viability, and plays an important regulatory role by interacting with a range of client proteins. Due to its central role in oncogenic signaling, Hsp90 provides an attractive target for the treatment of cancer.3
Despite GA providing an excellent lead for drug discovery, it was not progressed to the clinic, due to poor solubility and stability and, in particular, unacceptable levels of hepatotoxicity.4 Consequently, the more stable and soluble semi-synthetic GA derivatives 17-allylamino-17-demethoxygeldanamycin (tanespimycin, 17-AAG) and 17-(dimethylaminoethylamino)-17-demethoxygeldanamycin (alvespimycin, 17-DMAG) (Fig. 1) were developed and advanced to clinical trials,5,6 although continuing difficulties with formulation and toxicity meant their progress was also terminated. Thus, to develop new generations of GA derivatives with low hepatotoxicity by structure modification is urgent in demand.
 |
| | Fig. 1 Known ansamycin Hsp90 inhibitors. | |
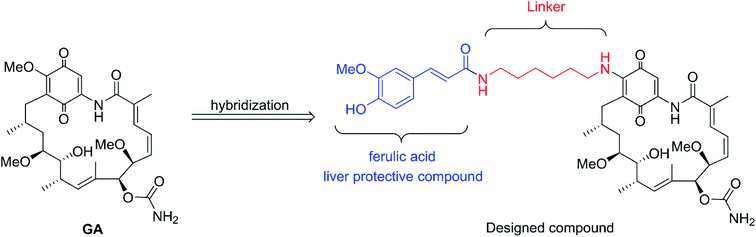
Inspired by the above breakthroughs, in present research, we decided to undertake a study of 17-feruloylamido-17-demethoxygeldanamycins, because modification of 17-position of GA with amino compounds would reduce its hepatotoxicity, e.g. 17-AAG.7 In the designed compound, liver protective compound ferulic acid8–11 was introduced in order to acquire the pharmacologically combinational effects based on the hybridization principle (Fig. 2).12 Herein, the cytotoxicities of the geldanamycin derivative against seven cancer cells as well as their in vivo hepatotoxicity were evaluated. Also, the preliminary mechanism study and in vivo antitumor activity of the designed compound was investigated.
 |
| | Fig. 2 Design of novel Hsp90 inhibitor. | |
2. Materials and methods
2.1. General
Except where specified, all reagents were purchased from commercial sources and were used without further purification. All melting points were determined on a micromelting point apparatus and were uncorrected. 1H-NMR and 13C-NMR spectra were recorded on a Bruker Avance (600 MHz) spectrometer. ESI-MS spectra were recorded using an API 4000 and the high-resolution mass spectral data were determined using an Accela UPLC-LTQ Orbitrap Mass Spectrometer. Thin layer chromatography (TLC) was performed on pre-coated GF254 plates (Qingdao Haiyang Chemical Co., Ltd, Qingdao, China). Flash chromatography was performed using 200–300 mesh silica gel (Qingdao Haiyang Chemical Co., Ltd, Qingdao, China).
2.2. Ethical statement
All animal experimental procedures were conducted according to the Guide for the Care and Use of Laboratory Animals and approved by the Animal Care and Ethics Committee of Shandong Provincial Hospital Affiliated to Shandong University (Jinan, China). All efforts were made to minimize the number of animals used and their suffering.
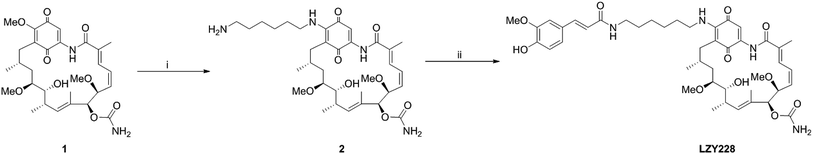
2.3. Procedure for preparation of LZY228
To geldanamycin (39 mg, 0.07 mmol, 1.0 equiv.) in dichloromethane (8 mL) was added 1,6-hexanediamine (96 μL, 1.40 mmol, 20 equiv.), and the reaction mixture was stirred at room temperature for 3.5 h. After the reaction finished, the mixture was diluted with 20 mL of dichloromethane and washed with water (3 × 25 mL) followed by brine (3 × 30 mL). The organic layer was dried over anhydrous sodium sulfate, filtered, and evaporated to dryness, obtaining the intermediate 2. To a solution of intermediate 2 in dimethyl formamide (15 mL) was added EDC·HCl (16 mg, 0.084 mmol, 1.2 equiv.), NHS (10 mg, 0.084 mmol, 1.2 equiv.) and ferulic acid (16 mg, 0.084 mmol, 1.2 equiv.). After stirring at room temperature for 24 h, the mixture was poured into water (50 mL) and extracted with ethyl acetate (3 × 25 mL). The combined organic layer was washed by brine (3 × 30 mL), dried over anhydrous magnesium sulfate, filtered, and evaporated to dryness. The residue was purified by flash column chromatography (silica gel, ethyl acetate/petroleum ether = 1![[thin space (1/6-em)]](https://www.rsc.org/images/entities/char_2009.gif) :1) to afford LZY228 as a purple solid. Yield 24.4%; mp 118–120 °C; 1H NMR (600 MHz, CDCl3) δ 9.15 (s, 1H), 7.55 (d, J = 15.6 Hz, 1H), 7.26 (s, 1H), 7.03 (d, J = 6.8 Hz, 1H), 6.98 (s, 1H), 6.92 (d, J = 11.0 Hz, 1H), 6.87 (d, J = 7.5 Hz, 1H), 6.58 (t, J = 11.1 Hz, 1H), 6.29 (br s, 1H), 6.28 (d, J = 15.6 Hz, 1H), 5.88 (d, J = 11.5 Hz, 1H), 5.84 (t, J = 10.4 Hz, 1H), 5.18 (s, 1H), 4.95 (br s, 2H), 4.30 (d, J = 8.9 Hz, 1H), 3.89 (s, 3H), 3.60–3.49 (m, 2H), 3.48–3.37 (m, 4H), 3.35 (s, 3H), 3.26 (s, 3H), 2.77–2.70 (m, 1H), 2.65 (d, J = 13.5 Hz, 1H), 2.40 (t, J = 12.0 Hz, 1H), 2.02 (s, 3H), 1.81–1.74 (m, 5H), 1.73–1.54 (m, 5H), 1.49–1.35 (m, 4H), 0.99 (br s, 3H), 0.95 (br s, 3H). 13C NMR (150 MHz, CDCl3) δ 184.1, 180.6, 168.5, 166.9, 156.4, 147.6, 146.9, 144.9, 141.6, 141.5, 135.9, 135.1, 132.9, 127.3, 127.0, 126.8, 122.2, 117.9, 114.9, 109.9, 108.7, 108.4, 81.9, 81.5, 81.3, 72.8, 57.3, 56.8, 56.1, 45.8, 39.7, 35.2, 34.5, 32.4, 29.7, 29.6, 28.6, 26.5, 23.0, 13.0, 12.8, 12.5; ESI-MS: m/z 843.6 [M + Na]+ (calcd 844.0).
:1) to afford LZY228 as a purple solid. Yield 24.4%; mp 118–120 °C; 1H NMR (600 MHz, CDCl3) δ 9.15 (s, 1H), 7.55 (d, J = 15.6 Hz, 1H), 7.26 (s, 1H), 7.03 (d, J = 6.8 Hz, 1H), 6.98 (s, 1H), 6.92 (d, J = 11.0 Hz, 1H), 6.87 (d, J = 7.5 Hz, 1H), 6.58 (t, J = 11.1 Hz, 1H), 6.29 (br s, 1H), 6.28 (d, J = 15.6 Hz, 1H), 5.88 (d, J = 11.5 Hz, 1H), 5.84 (t, J = 10.4 Hz, 1H), 5.18 (s, 1H), 4.95 (br s, 2H), 4.30 (d, J = 8.9 Hz, 1H), 3.89 (s, 3H), 3.60–3.49 (m, 2H), 3.48–3.37 (m, 4H), 3.35 (s, 3H), 3.26 (s, 3H), 2.77–2.70 (m, 1H), 2.65 (d, J = 13.5 Hz, 1H), 2.40 (t, J = 12.0 Hz, 1H), 2.02 (s, 3H), 1.81–1.74 (m, 5H), 1.73–1.54 (m, 5H), 1.49–1.35 (m, 4H), 0.99 (br s, 3H), 0.95 (br s, 3H). 13C NMR (150 MHz, CDCl3) δ 184.1, 180.6, 168.5, 166.9, 156.4, 147.6, 146.9, 144.9, 141.6, 141.5, 135.9, 135.1, 132.9, 127.3, 127.0, 126.8, 122.2, 117.9, 114.9, 109.9, 108.7, 108.4, 81.9, 81.5, 81.3, 72.8, 57.3, 56.8, 56.1, 45.8, 39.7, 35.2, 34.5, 32.4, 29.7, 29.6, 28.6, 26.5, 23.0, 13.0, 12.8, 12.5; ESI-MS: m/z 843.6 [M + Na]+ (calcd 844.0).
2.4. Cell growth inhibition assay
The cytotoxic effects of the compounds to cancer cells were assessed using the 3-(4,5-dimethyl-2-thiazolyl)-2,5-diphenyl-2H-tetrazolium bromide (MTT) assay.13 The cells were seeded into 96-well plates (cancer cells: 3 × 10³ per well in 100 μL of medium; HUVEC: 4 × 10³ per well in 100 μL of medium; HL7702: 8 × 10³ per well in 100 μL of medium). The compounds were added and incubated for 72 h after the cells were adhered. At the end of the incubation period, 20 μL of 5 mg mL−1 MTT was added to each well. After incubation for an additional 4 h in a 37 °C humidified incubator, the supernatant was discarded, and 200 μL of DMSO was added. After the formazan product was dissolved, the absorbance was read at 570 nm. The cell inhibitory rate was calculated with the following equation:
The cytotoxicities of compounds were expressed as IC50 that was defined as the drug concentration required inhibiting growth by 50% relative to controls.
2.5. In vivo hepatotoxicity assay
In vivo hepatotoxicity evaluation of the compounds were performed on the basis of our previously published study.13 Briefly, nine Kunming mice (4–6 weeks old, female, Experimental Animal Center of Shandong University, Jinan, China) were randomly divided into three groups of three mice each and were treated as the following details: Group I vehicle control; Group II–III treated with GA and LZY228, respectively (10 mg kg−1). Every day injected one time, continuously for three days. The blood serum samples were obtained and levels of aspartate aminotransferase (AST) and alanine aminotransferase (ALT) were determined using AST and ALT Assay Kits (Shanghai Rongsheng Biological Pharmaceutical Co., Ltd., Shanghai, China) based on a spectrophotometric method, respectively.
2.6. Fluorescence polarization assay (FPA)
FPA was used to evaluate for Hsp90 inhibitors based on displacement of a fluorescent compound GA-FITC that specifically binds to the Hsp90 ATP-binding site.13 Briefly, reaction mixes (100 μL) containing 20 mM HEPES (pH = 7.3), 50 mM KCl, 2 mM DTT, 20 mM Na2MoO4, 5 mM MgCl2, 0.01% Triton X-100 with 0.1 mg mL−1 BSA, 50 nM of recombinant Hsp90α protein (ab80369, Abcam®, Cambridge, UK), 5 nM of GA-FITC (ab141589, Abcam®), and a series of concentrations of tested compounds were added in a black 96-well plates (Corning Costar #3650, Tewksbury, MA, USA). After incubation for 5 h, plates were read on Omega POLARstar Multi-Mode Microplate Reader (BMG Labtech, Darmstadt, Germany) (λex = 485 nm, λem = 520 nm). Polarization values (mP) were used to calculate competitive effects, which were represented as percentage of control (% control) and calculated following the formula: % control = 100 × (mPc − mPf)/(mPb − mPf), where mPc, mPb, and mPf are recorded mP values from wells containing tested compounds, control wells containing both GA-FITC and Hsp90, and wells containing only the fluorescent probe GA-FITC, respectively. IC50 values were determined as the competitor concentrations at which 50% of bound GA-FITC was displaced.
2.7. Western blot assay
MDA-MB 231 cells were treated with or without compounds for different time courses, and then harvested and lysed in ice-cold lysis buffer (20 mM Tris–HCl, pH 7.4, 150 mM NaCl, 1 mM EDTA, 1 mM EGTA, 1% Triton, 2.5 mM sodium pyrophosphate, 1 mM β-glycerolphosphate, 1 mM sodium orthovanadate, 1 mg mL−1 leupeptin, 1 mM phenylmethylsulfonyl fluoride). The lysate was mixed with equal volume of 2× loading buffer (4% SDS, 10% 2-mercaptoethanol, 20% glycerol, and 0.2 mg mL−1 bromophenol blue in 0.1 M Tris–HCl, pH 6.8), and boiled for 10 min immediately. The boiled lysates were subjected to 8–12% SDS-PAGE, and then transferred to PVDF membranes (Millipore), which was then blocked with 5% BSA in phosphate-buffered saline with 0.1% Tween-20 for 1 h, and incubated overnight with the corresponding primary antibodies in the blocking solution at 4 °C. Primary antibodies were detected using either a Peroxidase-conjugated ImmunoPure Goat Anti-Rabbit IgG (H + L) or Peroxidase-conjugated ImmunoPure Goat Anti-Mouse IgG (H + L) secondary antibody and enhanced chemiluminescence.
2.8. In vivo antitumor assay
For xenograft model of MDA-MB-231 cell line, logarithmically growing MDA-MB-231 cells at the cell density of 5 × 10⁶ cells in 200 μL physiological saline solution were subcutaneously implanted onto three female athymic nude mice (6–7 weeks old, obtained from Slac Laboratory, Shanghai, China). After two weeks injection, the nude mice were sacrificed and solid tumors were obtained, which were cut into fragments and implanted into the right flank of nude mice (6–7 weeks old). When average tumor volume reached 100 mm3, mice were randomized into treatment and control groups (6 mice per group). The drugs were injected via caudal vein every three days at a dose of 10 mg kg−1 body weight, whereas the vehicle control group received an equal volume of 5% glucose injection containing 1% DMSO and 2% lecithin. 17-AAG was administrated as a positive control drug. During treatment, subcutaneous tumors were measured with a vernier caliper every three days, and body weight was monitored regularly. Tumor volume (V) = (length × width2)/2, where length represents the largest tumor diameter and width represents the perpendicular tumor diameter. After treated for 15 days with drugs, the animals were sacrificed and solid tumors were removed and weighted. Tumor growth inhibition (TGI) was calculated as [(averaged tumor weight of control group − averaged tumor weight of drug-treated group)/averaged tumor weight of control group] × 100%. Relative increment ratio (T/C) was calculated according to the formula: T/C = mean RTV of drug-treated group/mean RTV of control group. RTV, namely relative tumor volume = Vt/V0, (Vt: the tumor volume measured at the end of treatment; V0: the tumor volume measured at the beginning of treatment).14 Data were analyzed by Student's two-tailed t test. A P level <0.05 was considered statistically significant.
2.9. Molecular modeling
AutoDock Vina 1.1.215 was used to explore the binding mode between LZY228 and Hsp90 (PDB ID: 1YET). The PDBQT formats of protein and ligand were prepared by AutoDock Tools 1.5.6 package (http://mgltools.scripps.edu. The search grid of Hsp90 was identified as center_x: 40.695, center_y: −46.782 and center_z: 65.693 with dimensions size_x: 16, size_y: 16, and size_z: 16. For Vina docking, the default parameters were used if it was not mentioned. Then a MD study was performed to revise the docking result using Amber 1216–18 on Dell Precision T5500 workstation. Minimization of the complex was first performed (500 steps of each steepest descent and conjugate gradient method), then 500 ps of heating, and 50 ps of density equilibration with weak restraints were done and at last 50 ns of MD simulations were carried out using the GPU (NVIDIA® Tesla K20c, Santa Clara, CA, USA) accelerated PMEMD (Particle Mesh Ewald Molecular Dynamics) module.
3. Results and discussion
3.1. Synthesis of LZY228
Commercially available GA (1, Shanghai Yingrui Chemical Technology Co., Ltd., Shanghai, China) was used as the starting material for the synthesis of intermediate 2 according to the similar method as reported in the literatures.13,19–23 The title compound LZY228 was prepared as shown in Scheme 1 by the condensation of intermediate 2 with ferulic acid, which was characterized by physicochemical, MS, 1H-NMR and 13C-NMR spectral data.
 |
| | Scheme 1 Synthesis route of LZY228. Reagents and conditions: (i) 1,6-hexanediamine, dichloromethane, room temperature, 3.5 h; (ii) ferulic acid, NHS, EDC·HCl, DMF, room temperature, 24 h. | |
3.2. In vitro anti-proliferative activity
Setting 17-AAG and GA as the positive controls, LZY228 was first screened for its in vitro antitumor activities against seven cancer cell lines (A549, HeLa, MDA-MB-231, A431, BGC-823, SW480 and HepG2). Results indicated that LZY228 showed selectively antiproliferative activity against MDA-MB-231 toward other six cell lines (Table 1).
Table 1 In vitro cytotoxicities of LZY228, 17-AAG and GA
| Compd |
IC50 (nM) |
| HUVEC |
HL7702 |
A549 |
HeLa |
MDA-MB-231 |
A431 |
BGC-823 |
SW480 |
HepG2 |
| LZY228 |
1582 ± 285 |
5361 ± 793 |
336 ± 18 |
341 ± 36 |
270 ± 32 |
685 ± 77 |
709 ± 86 |
873 ± 74 |
472 ± 59 |
| 17-AAG |
271 ± 38 |
105 ± 7 |
87 ± 6 |
112 ± 18 |
324 ± 76 |
72 ± 4 |
725 ± 99 |
614 ± 85 |
82 ± 16 |
| GA |
18 ± 3 |
133 ± 20 |
91 ± 7 |
731 ± 53 |
59 ± 13 |
45 ± 6 |
40 ± 8 |
298 ± 34 |
45 ± 7 |
3.3. In vitro and in vivo hepatotoxicity evaluations
Further studies were conducted to evaluate hepatotoxicity of LZY228 compared with the positive controls. However, LZY228 showed reduced hepatotoxicity compared with the GA in terms of cell survival assessed using the MTT assay and in vivo hepatotoxicity via AST and ALT release. These results were first confirmed in human umbilical vein endothelial cells (HUVEC) and normal human hepatocytes (HL7702). For HUVEC, compound LZY228 was about 5-fold and 83-fold less toxic than 17-AAG and GA, respectively, while for HL7702, compound LZY228 was approximate 54-fold and 38-fold less toxic than 17-AAG and GA, respectively (Table 1). As shown in Table 2, it is obvious that the AST and ALT activities of GA-treated group were both significantly higher than that of vehicle control group (P < 0.001), revealing the severe hepatotoxicity of GA. To our surprise, the AST and ALT levels of LZY228-treated mice were both significantly lower than that of GA group (P < 0.001), and also showed no significant differences versus vehicle control mice (P > 0.05), indicating that compound LZY228 was a promising antitumor agent with low hepatotoxicity, which can be further developed for the treatment of breast cancer.
Table 2 In vivo hepatotoxicity evaluation of LZY228, GA and vehicle-treated mice
| Compd |
AST (U L−1) |
ALT (U L−1) |
| LZY228 |
199.3 ± 33.1 |
72.7 ± 10.9 |
| GA |
317.2 ± 39.1 |
273.0 ± 25.3 |
| Vehicle |
197.2 ± 11.2 |
60.7 ± 6.9 |
3.4. Hsp90 inhibitory activity
Compound LZY228 was then evaluated by fluorescence polarization assay (FPA) for its ability to inhibit recombinant Hsp90 with GA and 17-AAG as the reference controls, and the results are summarized in Table 3. Compound LZY228 exhibited excellent Hsp90 inhibitory activity with an IC50 value of 0.41 μM, which is more potent than that of 17-AAG (IC50 = 0.78 μM).
Table 3 The IC50 values of LZY228, 17-AAG and GA at inhibiting Hsp90α
| Compd |
IC50 (μM) |
| LZY228 |
0.41 ± 0.15 |
| 17-AAG |
0.78 ± 0.22 |
| GA |
0.14 ± 0.05 |
3.5. Inhibition of Hsp90 in cellular system
Inhibition of Hsp90 by LZY228 in cellular systems was performed by western blot assay. A decrease in Hsp90 client proteins (including Her2, AKT and CDK4) and a compensatory increase in Hsp70 are the two most common biomarkers used for inhibition of Hsp90 in cells.24 The levels of Hsp70 were all markedly increased when treated with LZY228, GA and 17AAG at the concentration of 0.5 μM (Fig. 3). Importantly, LZY228 significantly downregulated the levels of the Hsp90 clients Her2, Akt and CDK4, and upregulated the chaperone protein Hsp70 in a dose-dependent manner. When considered together with its markedly decreased hepatotoxicity in mice, this suggests that LZY228 may have a greater therapeutic window than 17-AAG and hence considerable potential for application in the therapy of cancers.
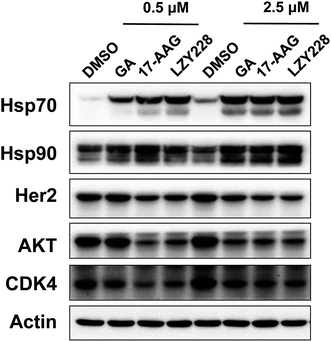 |
| | Fig. 3 Evaluation of LZY228 as the inhibitor of Hsp90 in cellular systems. | |
3.6. In vivo antitumor activity evaluations
Encouraged by the potent in vitro antitumor activity against MDA-MB-231 cells and less in vivo hepatotoxic of LZY228, we went on to explore its in vivo antitumor activity in a MDA-MB-231 xenograft model. 17-AAG was administrated as a positive control drug. TGI and T/C were calculated to reveal the antitumor effects in tumor weight and tumor volume, respectively. In the MDA-MB-231 xenograft model, compound LZY228, with the higher TGI value (78.9%) and lower T/C value (29.7%), demonstrated superior antitumor activity to the reference drug 17-AAG (TGI = 55.1%, T/C = 41.9%) after treatment for 15 days (Table 4). The excellent activity against MDA-MB-231 tumors was also explicitly observed in the tumor growth curve (Fig. 4A) and the final tumor tissue size (Fig. 4B).
Table 4 The inhibitory effect of LZY228 on MDA-MB-231 xenografts in nude micea
| Compd |
TGI (%) |
T/C (%) |
| Compared with the control group, all treated groups showed statistically significant (P < 0.05) T/C and TGI by Student's two-tailed t test. |
| LZY228 |
78.9 ± 2.7 |
29.7 ± 5.9 |
| 17-AAG |
55.1 ± 5.5 |
41.9 ± 11.3 |
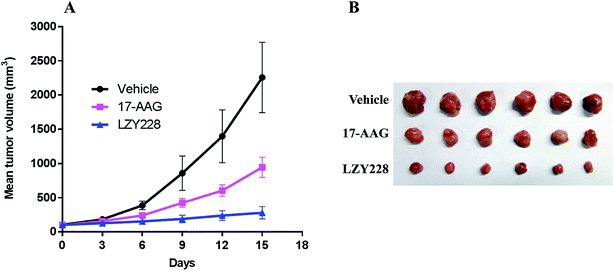 |
| | Fig. 4 Growth curve of implanted MDA-MB-231 xenograft in nude mice (A). Data are expressed as the mean ± standard deviation. Picture of dissected MDA-MB-231 tumor tissues (B). | |
3.7. Molecular modeling
On the basis of the above in vivo experiment results, it was concluded that relative to 17-AAG, compound LZY228 exhibited more potent MDA-MB-231 inhibitory activity and lower in vivo hepatotoxicity, which could be a promising antitumor candidate for further study. Then molecular docking and MD refinement of Hsp90-LZY228 complex was performed using Autodock vina 1.1.215 and Amber 12.16–18 Hsp90-LZY228 complex was equilibrated after 50 ns MD simulation, and the plot of RMSD (in ångstrom) of the complex is shown in Fig. 5A. The predicted binding mode of LZY228 to Hsp90 is shown in Fig. 5B. The tip of LZY228 ansa ring which has the 6-position methoxy group, 7-carbamate group and 8- and 10-methyl groups, is likely to bind near the bottom of the Hsp90 pocket and makes a high density of van der Waals contacts, whereas the benzoquinone is positioned near the entrance of the pocket and makes only a few contacts.25 Importantly, 1-carbanyl group forms hydrogen bond with residue Phe128, and the carbamate amino group make hydrogen bonds with both residues Asp83 and Thr174. In middle of LZY228 ansa ring, the 11-hydroxyl group makes a hydrogen bond contact with Lys48. At the pocket entrance, the 18-carbonyl oxygen atom of the ansa ring and 17-nitrogen atom are both make hydrogen bonds to Asp44. The 21-carbonyl oxygen atom of the ansa ring makes hydrogen bonds to Lys102 and Gly125. It is worthy to point out that the phenyl ring of feruloyl group forms a cation-π interaction26 with residue Gln123, which may be the main difference between LZY228 and GA.
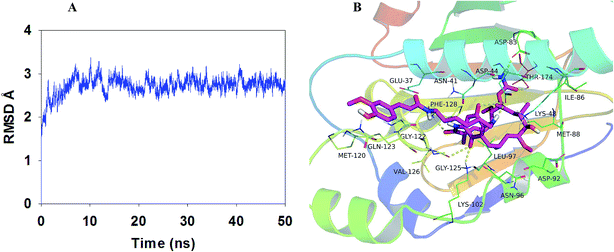 |
| | Fig. 5 Plot of RMSD (in ångstrom) for the Hsp90-LZY228 complex during 50 ns MD simulation (A). The binding model of Hsp90-LZY228 complex was shown by PyMoL (B). | |
4. Conclusions
In conclusion, three novel geldanamycin–ferulic acid conjugates were synthesized and structurally confirmed by 1H-NMR, 13C-NMR, and MS spectral analysis and evaluated for their anti-proliferation activity against MDA-MB-231 cells. In particular, LZY228 showed the most potent activity with an IC50 value 0.27 ± 0.03 μM, which was more active than 17-AAG. Hepatotoxicity evaluation in mice demonstrated that the AST and ALT levels of LZY228-treated group was lower than that of GA group, indicating that LZY228 was a promising candidate for further optimization and development of novel antitumor agents. In addition, an excellent in vivo antitumor potency of LZY228 was observed in MDA-MB-231 xenograft model, which was superior to reference drug 17-AAG. Docking and molecular dynamics study of the Hsp90-LZY228 complex give us an explanation of theoretical binding model of 1,6-hexanediamine-bearing 17-ferulamido-17-demethoxygeldanamycins at molecular level and some hints about the structural modifications of GA. Further modifications of this novel family of potent Hsp90 inhibitors are ongoing in our laboratories and will be reported in due course.
Conflicts of interest
The authors declare that there is no conflict of interest.
Acknowledgements
This work was supported by the National Natural Science Foundation of China (81502921, 81530091, 81673317, 81602979).
Notes and references
- C. DeBoer, P. A. Meulman, R. J. Wnuk and D. H. Peterson, J. Antibiot., 1970, 23, 442–447 CrossRef CAS PubMed.
- C. E. Stebbins, A. A. Russo, C. Schneider, N. Rosen, F. U. Hartl and N. P. Pavletich, Cell, 1997, 89, 239–250 CrossRef CAS.
- C. Moser, S. A. Lang and O. Stoeltzing, Anticancer Res., 2009, 29, 2031–2042 CAS.
- J. G. Supko, R. L. Hickman, M. R. Grever and L. Malspeis, Cancer Chemother. Pharmacol., 1995, 36, 305–315 CrossRef CAS PubMed.
- E. A. Ronnen, G. V. Kondagunta, N. Ishill, S. M. Sweeney, J. K. DeLuca and L. Schwartz, et al., Invest. New Drugs, 2006, 24, 543–546 CrossRef CAS PubMed.
- E. R. Glaze, A. L. Lambert, A. C. Smith, J. G. Page, W. D. Johnson and D. L. McCormick, et al., Cancer Chemother. Pharmacol., 2005, 56, 637–647 CrossRef CAS PubMed.
- H. Behrsing, K. Amin, C. Ip, L. Jimenez and C. Tyson, Toxicol. In Vitro, 2005, 19, 1079–1088 CrossRef CAS PubMed.
- H.-Y. Kim, J. Park, K.-H. Lee, D.-U. Lee, J.-H. Kwak and Y. S. Kim, et al., Toxicology, 2011, 282, 104–111 CrossRef CAS PubMed.
- M. Srinivasan, R. Rukkumani, A. Ram Sudheer and V. P. Menon, Fundam. Clin. Pharmacol., 2005, 19, 491–496 CrossRef CAS PubMed.
- D. N. Krishnan, N. Prasanna, E. P. Sabina and M. K. Rasool, Comp. Clin. Pathol., 2013, 22, 1177–1181 CrossRef CAS.
- L. Panneerselvam, K. Subbiah, A. Arumugam and J. G. Senapathy, Biol. Trace Elem. Res., 2013, 151, 85–91 CrossRef CAS PubMed.
- X. Z. Fu, Y. Ou, J. Y. Pei, Y. Liu, J. Li and W. Zhou, et al., Eur. J. Med. Chem., 2012, 49, 211–218 CrossRef CAS PubMed.
- L. Zhenyu, J. Lejiao, W. Jifeng, W. Xingkang, S. Guowei and L. Chunhua, et al., Chem. Biol. Drug Des., 2015, 85, 181–188 CrossRef PubMed.
- Y. Zhang, H. Fang, J. Feng, Y. Jia, X. Wang and W. Xu, J. Med. Chem., 2011, 54, 5532–5539 CrossRef CAS PubMed.
- O. Trott and A. J. Olson, J. Comput. Chem., 2010, 31, 455–461 CAS.
- L. C. Pierce, R. Salomon-Ferrer, C. A. F. de Oliveira, J. A. McCammon and R. C. Walker, J. Chem. Theory Comput., 2012, 8, 2997–3002 CrossRef CAS PubMed.
- A. W. Götz, M. J. Williamson, D. Xu, D. Poole, S. Le Grand and R. C. Walker, J. Chem. Theory Comput., 2012, 8, 1542–1555 CrossRef PubMed.
- R. Salomon-Ferrer, A. W. Götz, D. Poole, S. Le Grand and R. C. Walker, J. Chem. Theory Comput., 2013, 9, 3878–3888 CrossRef CAS PubMed.
- Y. Kasuya, Z. Lu, P. Kopeckova and J. Kopecek, Bioorg. Med. Chem. Lett., 2001, 11, 2089–2091 CrossRef CAS PubMed.
- F. Wuest, V. Bouvet, B. Mai and P. LaPointe, Org. Biomol. Chem., 2012, 10, 6724–6731 RSC.
- Z. Li, L. Jia, H. Xu, C. Lu and Y. Shen, Med. Chem., 2015, 11, 482–488 CrossRef CAS PubMed.
- Z. Li, L. Jia, J. Wang, X. Wu, H. Hao and H. Xu, et al., Eur. J. Med. Chem., 2014, 85, 359–370 CrossRef CAS PubMed.
- Z. Li, L. Jia, J. Wang, X. Wu, H. Hao and Y. Wu, et al., Eur. J. Med. Chem., 2014, 87, 346–363 CrossRef CAS PubMed.
- R. R. Kitson, C. H. Chang, R. Xiong, H. E. Williams, A. L. Davis and W. Lewis, et al., Nat. Chem., 2013, 5, 307–314 CrossRef CAS PubMed.
- C. E. Stebbins, A. A. Russo, C. Schneider, N. Rosen, F. U. Hartl and N. P. Pavletich, Cell, 1997, 89, 239–250 CrossRef CAS PubMed.
- J. C. Ma and D. A. Dougherty, Chem. Rev., 1997, 97, 1303–1324 CrossRef CAS PubMed.
Footnote |
| † Electronic supplementary information (ESI) available. See DOI: 10.1039/c9ra08665j |
|
| This journal is © The Royal Society of Chemistry 2019 |
Click here to see how this site uses Cookies. View our privacy policy here. 
 Open Access Article
 This Open Access Article is licensed under a Creative Commons Attribution-Non Commercial 3.0 Unported Licence
 a,
Lejiao Jiab,
Hui Tanga,
Yuemao Shenc and
Chengwu Shen
a,
Lejiao Jiab,
Hui Tanga,
Yuemao Shenc and
Chengwu Shen