 Open Access Article
Creative Commons Attribution 3.0 Unported Licence
Probing structural transformation and optical and magnetic properties in Cr doped GdMnO3: Jahn–Teller distortion, photoluminescence and magnetic switching effect
Priyanka Tiwari,
Sandeep Kumar and
Chandana Rath *
*
School of Materials Science and Technology, Indian Institute of Technology (Banaras Hindu University), Varanasi 221005, India. E-mail: crath.mst@iitbhu.ac.in
First published on 2nd December 2019
Abstract
The systematic evolution of structure, photoluminescence and different magnetic transitions in GdMnO3 is reported after Cr doping. With increasing the Cr concentration from 10 to 40 at%, Rietveld refinement of X-ray diffraction patterns demonstrates that an O′ type orthorhombic structure transforms to O type, manifesting a reduction in lattice volume. The noticeable reduction in lattice volume is ascribed to the smaller size of the Cr3+ ion compared to Mn3+. The structural transformation is accompanied with a considerable decrease in the Jahn–Teller distortion factor evaluated from XRD, Raman and photoluminescence measurements. Magnetic studies reveal a considerable enhancement in Néel temperature (TN) from ∼42 K for x = 0 to 130 K for x = 0.4. Interestingly, we observe magnetization reversal (MR) with spin reorientation (TSR) for x = 0.3. The mechanism for such a magnetic behavior is discussed on the basis of competition between Mn, Cr and Gd. The incorporation of Cr not only constructively modifies the crystal structure and evokes the magnetic reversal phenomenon but also contributes towards the enhanced emission spectra. The promising structure and magnetic properties of Cr doped GdMnO3 offer potential pathways for spintronics and magnetic switching devices.
Introduction
Rare earth manganites (RMnO3, R = rare earth) possess complex spin arrangements leading to unusual magnetic ordering such as antiferromagnetic (AFM) and cycloidal spin structures including spin reorientation (TSR).1–5 Since the last decade, a wide group of researchers has reported extensive investigations to comprehend the nature of spin, charge, orbital ordering or the exchange interaction of the transition metals. Recently, theoretical calculations along with experimental evidence reveal that such manganites exhibit distorted perovskites with an orthorhombic structure. The manganites of RMnO3 type containing undersized trivalent R ions like GdMnO3 demonstrate a ferroelectricity phenomenon induced due to competition between magnetic interactions evoking an antiferromagnetic (AFM) spin ordering that results into the lattice modulations.6–12 GdMnO3 show intriguing and captivating magnetic properties. GdMnO3 crystallizes into an orthorhombic (O′) structure showing canted AFM at ∼23 K along with Néel temperature (TN) at ∼42 K. In general, the manganites exhibit inherent Jahn–Teller (J–T) distortion evoking unfavorable structural imperfections which essentially modify different physical properties.13–19 Usually, the structural distortions can be perceived by employing sensitive characterization tools such as Raman, X-ray absorption, and photoluminescence (PL) spectroscopy etc. In this regards, Modi et al. have reported that the room temperature Raman spectra of GdMn1−xCrxO3 (0 ≤ x ≤ 0.2) shows the reduction of Raman shift as doping concentration increases that related to anti-symmetric Jahn–Teller stretching mode and symmetric stretching mode. The broadening of Raman peaks can be consequence of lattice disorder as induced by Cr doping in Mn site.20 While Li et al. have reported that there is a broadening of the Raman spectrum appeared from 400 to 900 cm−1 with increasing magnetic field from 0 to 20 kOe in La0.75Ca0.25MnO3.21 The reason behind such broadening is associated with the structural changes. It is known that PL emissions of perovskite materials including CaTiO3 and SrZrO3 are affected considerably due to the intrinsic structure related distortions.22,23 A wide group of researchers have reported the considerable tuning of magnetic properties, in particular after doping various ions at Gd or Mn site.24 In this context, Nandy et al. and Sarguna et al. discuss the significant improvement of the magnetic properties by doping Na+ and Y3+ in Gd site.25,26 The magnetic properties can also be modified if a non J–T active element replaces the J–T active element within the GdMnO3 lattice. In this regard, including our previous studies,24 Pal et al. and Modi et al. have reported the magnetic properties of GdMnO3 after doping Fe and Cr at Mn site, respectively.20,27 While Pal et al. report the presence of TSR in GdMn1−xFexO3 when x > 0.4, we could show in our previous report that TSR could observe even when x = 0.3.24Since Cr exhibits desired non J–T active characteristic, the interaction between R and Cr3+ also suggests an unusual negative magnetization (NM) phenomenon.28 The unexpected magnetic behavior of NM was first predicted by Néel in the year, 1948.29 In case of NM behavior, a definite temperature at which the value of magnetization becomes zero is termed as the compensation temperature (Tcomp). Interestingly, the magnetization shows negative value along with some spin reorientation below Tcomp. In general, the NM phenomenon emerges either with changing the temperature or the degree of the magnetic field. Therefore, such a phenomenon is unusual since it arises even under the influence of applied magnetic field having fix direction. The exclusive properties of the NM have laid down various potential applications such as magnetic switching, magneto caloric and spintronics devices etc.30–32 Usually, NM phenomenon has been reported in rare earth orthochromites, orthoferrites, and orthovanadates.33–37 For example, Pena et al. have found negative magnetization in Gd1−xCaxMnO3 (0.2 ≤ x ≤ 0.4) powders with ferrimagnetic transition.10 Yingnan et al. report that when Sr is doped at Gd site, the magnetization reversal is observed in Gd1−xSrxMnO3 (0.1 ≤ x ≤ 0.3).38 In epitaxial film of Gd0.67Ca0.33MnO3, Ma et al. show the NM behavior at low temperature due to f–d interaction.39 Modi et al. have reported the structural, electrical and magnetic properties of GdMn1−xCrxO3 when x ≤ 0.2 having orthorhombic structure with space group Pbnm synthesized through solid state reaction technique. It has been observed a crossover of ZFC magnetization from positive value at x = 0 to negative value at x = 0.2. The negative magnetization is understood on the basis of competing WFM–FM interactions.20 It is interesting to extend the Cr doping concentration above 0.2 to examine the unusual magnetic behavior in GdMnO3. Besides, Cr3+ also plays an important role in negative magnetization and provides a prospective pathway to realize the magneto electric coupling and enhancement in multiferrocity. Surprisingly, there exists only a few reports which discuss NM phenomenon in rare earth manganites.
Therefore, in this work, we demonstrate the correlation between structural transformation and intriguing magnetic transitions in Cr doped GdMnO3 varying dopant concentration from 10 to 40 at%. GdMn1−xCrxO3 (x = 0.1, 0.2, 0.3 and 0.4) synthesized via facile sol–gel method reveals that O′ type orthorhombic structure transforms to O type followed by a notable decrease in the J–T distortion factor with increasing Cr concentration. Raman and PL spectra endorse the dramatic decrease in the J–T distortion factor. Temperature and field dependent magnetization including time dependent remanent magnetization measurements are carried out to evaluate unique properties like NM, compensation, magnetic switching etc. in these compounds.
Experimental details
GdMn1−xCrxO3 (x = 0.1, 0.2, 0.3 and 0.4) were prepared via facile and robust sol–gel technique. For Cr doped GdMnO3 sample, the stoichiometric amounts of gadolinium nitrate (Gd(NO3)3·6H2O, Sigma Aldrich, >99.9%), manganese chloride (MnCl2·6H2O, Himedia, >98%) and chromium chloride (CrCl3·6H2O) were mixed with distilled water and citric acid. The ratio of cation to citric acid was kept constant at 1![[thin space (1/6-em)]](https://www.rsc.org/images/entities/char_2009.gif) :
:![[thin space (1/6-em)]](https://www.rsc.org/images/entities/char_2009.gif) 1. First, the solution mixture was continuously stirred at 80 °C for 20 minutes. Then, the dropwise addition of ethylene glycol to the mixture solution formed the gel. Afterwards, the obtained gel was dried at 100 °C for 6 hours to produce precursor resin. Following grinding of resin using mortar and pestle, the powders were procured which appeared dark brown in color. GdMn1−xCrxO3 (x = 0.1, 0.2, 0.3 and 0.4) samples were calcined at 1100 °C for 5 hours in air. For structural characterization, the powders were studied using Rigaku make powder X-ray diffractometer (XRD) operating in the Bragg Brentano geometry equipped with a 3 kW rotating anode producing Cu Kα radiation. The prominent vibrational modes emerging in GdMn1−xCrxO3 were investigated through Raman spectroscopy using Horiba Jobin Yvon. The excitation and emission spectra were collected with PL spectrometer (Hitachi F-4600). The magnetic property measurement system (MPMS) of Quantum Design, USA working between temperature range from 2 to 300 K were employed to characterize the magnetic properties.
1. First, the solution mixture was continuously stirred at 80 °C for 20 minutes. Then, the dropwise addition of ethylene glycol to the mixture solution formed the gel. Afterwards, the obtained gel was dried at 100 °C for 6 hours to produce precursor resin. Following grinding of resin using mortar and pestle, the powders were procured which appeared dark brown in color. GdMn1−xCrxO3 (x = 0.1, 0.2, 0.3 and 0.4) samples were calcined at 1100 °C for 5 hours in air. For structural characterization, the powders were studied using Rigaku make powder X-ray diffractometer (XRD) operating in the Bragg Brentano geometry equipped with a 3 kW rotating anode producing Cu Kα radiation. The prominent vibrational modes emerging in GdMn1−xCrxO3 were investigated through Raman spectroscopy using Horiba Jobin Yvon. The excitation and emission spectra were collected with PL spectrometer (Hitachi F-4600). The magnetic property measurement system (MPMS) of Quantum Design, USA working between temperature range from 2 to 300 K were employed to characterize the magnetic properties.
Results and discussion
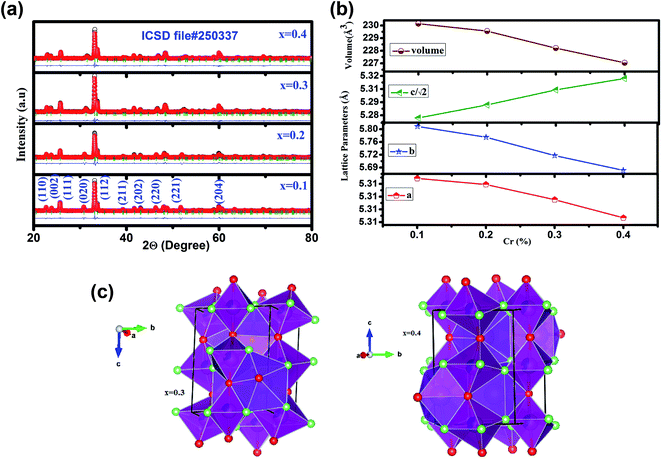
Fig. 1 (a) illustrates the room temperature XRD patterns along with Rietveld refinement of GdMn1−xCrxO3 (x = 0.1, 0.2, 0.3 and 0.4). XRD data refined over 2Θ = 20–80° having O′ type distorted perovskite structure considering pseudo-Voigt function, space group, Pbnm, upto x = 0.3 as evidenced from the Bragg's positions indicated by green bars. Thus, GdMn1−xCrxO3 crystallizes as a single phase without any trace of impurity phase. Interestingly, with increasing concentration of Cr from 0.3 to 0.4, O′ orthorhombic structure transforms into O type one with space group Pbnm. In our recent work, we have demonstrated structural transformation from O′ orthorhombic to O type orthorhombic one by varying concentration of Fe from 30 to 50 at% in GdMnO3.24 Due to orthorhombic structure, we have expressed the lattice parameters as a ≈ b ≈ c/√2. For a < c/√2 < b, the perovskite adopts O type orthorhombic structure whereas the condition i.e. c/√2 < a < b satisfies the O′ orthorhombic structure. After Rietveld refinement, the obtained parameters are tabulated in Table 1. Following the fitting parameters, the Rietveld refinement appears to be fairly satisfactory looking at the difference plot shown as blue line and the small value of χ2. The change in lattice parameters with composition of Cr is shown in Fig. 1(b). One may notice from Fig. 1(b) that with increasing Cr concentration while a and b decreases, c increases with reduction in lattice volume from 231.22 to 228.20 Å3 with increasing Cr from 0.1 to 0.4. The significant decrease in lattice volume is attributed to the difference in ionic radii of Cr and Mn ions. The smaller ionic radius of Cr3+ (0.61 Å) than that of Mn3+ (0.64 Å) shows a noticeable decrease in lattice volume confirming the substitution of Cr3+ ions at Mn3+ site in the lattice. Further, on the basis of parameters obtained from Rietveld refinement, we show a representative unit cell of the crystal structure in three dimension (3D) indicating MnO6 octahedra with spatial orientations and atom positions using Vesta software depicted in Fig. 1(c) for x = 0.3 and 0.4.40 In MnO6 octahedra, O1 atoms (red balls) reside at the two apical positions whereas O2 atoms (green balls) occupy four equatorial positions. The equatorial Mn–O2 bonds have two distinct bond lengths indicated as long (l) and short (s). If all of the Mn–O and average 〈Mn–O〉 bond lengths are calculated from XRD patterns, the coherent J–T distortion is estimated by following expression.| σJT2 = 1/3Σi[(Mn–O)i − 〈Mn–O〉]2 | (1) |
| Parameters | x = 0.1 | x = 0.2 | x = 0.3 | x = 0.4 |
|---|---|---|---|---|
| Gd (x, y, z) | (0.9833(6), 0.0806(4), 0.25) | (0.9840(7), 0.0768(5), 0.25) | (0.9850(5), 0.0720(3), 0.25) | (0.9807(5), 00.691, 0.25) |
| Mn/Cr (x, y, z) | 0.5, 0, 0 | (0.5, 0, 0) | (0.5, 0, 0) | (0.5, 0, 0) |
| O1 (x, y, z) | (0.095(3), 0.492(3), 0.25) | (0.096(4), 0.475(4), 0.25) | (0.1137(3), 0.4649(3), 0.25) | 0.087(4), 0.450(4), 0.25 |
| O2 (x, y, z) | (0.703(3), 0.303(3), 0.0437(19)) | (0.705(4), 0.298(4), 0.047(2)) | (0.7788(3), 0.8215(3), 0.0495(3)) | 0.697(3), 0.306(3), 0.035(2) |
| χ2 | 1.33 | 2.12 | 2.77 | 2.30 |
| Mn–O1 (Å) | 1.93 | 1.944(6) | 1.982(9) | 1.958(6) |
| Mn–O2 (Å) (l) | 2.24 | 2.07(2) | 2.214(14) | 2.046(17) |
| Mn–O2′ (Å) (s) | 1.87 | 1.99(2) | 1.901(7) | 1.968(16) |
| Mn–O1–Mn (deg) | 148 | 148.4 | 142.53(12) | 147.8(2) |
| Mn–O2–Mn (deg) | 147.5 | 151.1(9) | 148.86(11) | 151.2(7) |
| |a − b| | 0.4896 | 0.4594 | 0.4089 | 0.3685 |
| σJT | 0.066 | 0.053 | 0.046 | 0.037 |
The estimated values of σJT tabulated in Table 1. For GdMnO3, there exists a large J–T distortion factor i.e. σJT = 0.2.24 However, after incorporating Cr into the host lattice, σJT is found to be ∼0.066 which reduces to 0.053 and 0.046 with increasing the Cr concentration from 0.1 to 0.2 and 0.3, respectively. For x = 0.4, where O′ to O orthorhombic structural transformation takes place, J–T distortion reduces to 0.037 which is almost 50% of the J–T factor observed in case of x = 0.1. The considerable reduction in J–T distortion factor is ascribed to the replacement of J–T active element Mn3+ ions by the non-J–T active, Cr3+ ions in the lattice. Further, we observe that the difference in a and b i.e., |a − b| deceases from 0.4896 to 0.3685 when Cr concentration increases from 10 to 40 at%. Such decreasing trend clearly indicates that orthorhombic structure tends towards a more symmetrical structure i.e., the tetragonal structure.
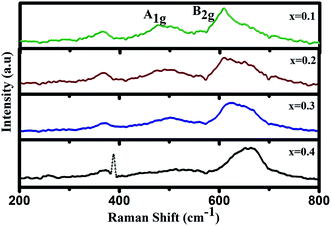
To confirm the change in J–T distortion with increasing Cr concentration, we have undertaken of Raman spectroscopic measurement. Raman spectra of GdMn1−xCrxO3 (x = 0.1, 0.2, 0.3 and 0.4) at room temperature are shown in Fig. 2. In case of x = 0.1, the spectrum exhibits a tilting mode at 365 cm−1 along with the two J–T stretching modes i.e. anti-stretching (as) mode, A1g at 474 cm−1 and stretching (s) mode, B2g at 608 cm−1 in Fig. 2.41 A1g and B2g modes arise due to in-plane antisymmetric vibration and stretching of O2, respectively which are correlated with J–T distortion. With increasing concentration of Cr from 0.2 to 0.3, both A1g and B2g are found to be red-shifted indicating smaller Mn–O bond length (dMn–O) keeping the intensity of peaks almost same. Apparently, at x = 0.4, the peak intensity drastically suppressed. Similar reduction in the peak intensity has been reported in GdMnO3 after increasing the Cr concentration to 0.2 by Modi et al.20 Li et al. have also found the broadening of the Raman peaks within 400–900 cm−1 in La0.75Ca0.25MnO3 when the magnetic field increases from 0 to 2.5 kOe at room temperature. Such broadening of peaks indicates the reduction in orthorhombic distortion or MnO6 octahedral distortion inducing structural changes.21 In the present case, the drastic reduction in peak intensity in x = 0.4 thus confirms the structural transformation from O′ to O type orthorhombic leading to significant decrease in J–T distortion. The fingerprint of J–T distortion induced structural transformation in Cr doped GdMnO3 is investigated further through photoluminescence studies.
Photoluminescence properties
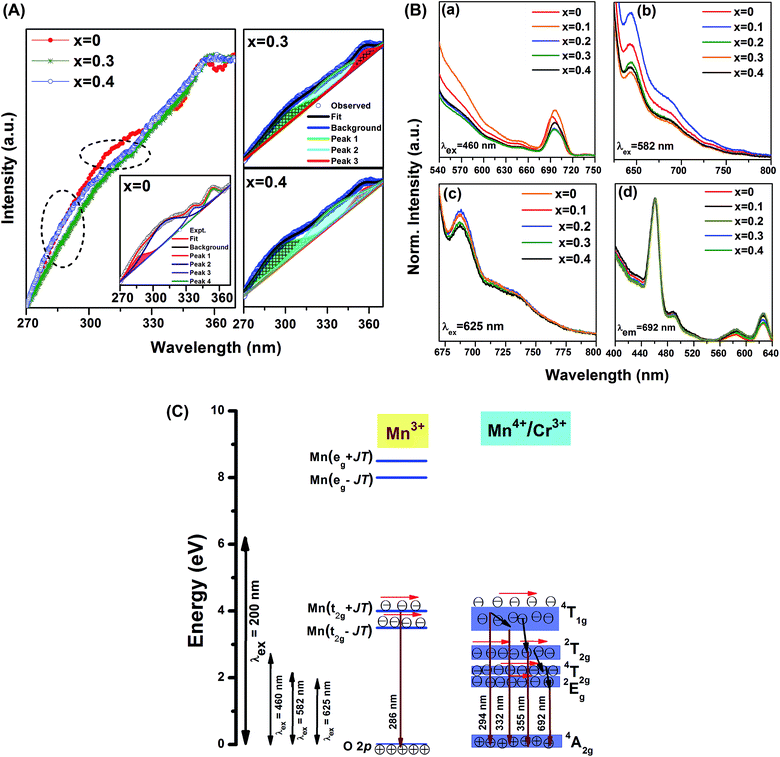
Fig. 3(A) depicts the emission spectra of GdMn1−xCrxO3 (x = 0, 0.3 and 0.4) after exciting with 200 nm. The spectra consist of broad emission peaks in wavelength range of 270–370 nm. For a simplified comparative analysis, we have deconvoluted the emission spectra to reveal dominant emission peaks. The emission spectrum of pure GdMnO3 shows four distinct peaks at ∼286, 308, 336 and 353 nm. In case of large J–T distortion, it is known that Mn3+ exhibits four distinct energy levels at 3.5, 4, 8 and 8.5 eV corresponding to transition from O 2p to Mn(t2g − JT), Mn(t2g + JT), Mn(eg − JT), Mn(eg + JT), respectively.42 The emission peak at ∼286 can be assigned to O 2p → Mn(t2g + JT) transition of Mn3+. The peak at 308 nm is attributed to the band transition, 4T1g → 4A2g of Mn4+. Owing to broad nature of this peak, the energy level Mn(t2g − JT) of Mn3+ having comparable energy to Mn4+ can also contribute towards this emission. The other peak located at 336 nm while emerges from relaxation of electrons from 4T1g energy band to 4A2g, peak at 353 nm originates from the electronic transition, 2T2g → 4A2g, corresponding to Mn4+.43 After doping Cr (x = 0.3 and 0.4), three peaks are found to be located at ∼294, 332 and 355 nm. Surprisingly, the emission peak at ∼286 nm observed in GdMnO3 disappears completely by incorporating Cr in host lattice. The disappearance of above peak could be due to the J–T distortion factor of 0.2 observed in GdMnO3 which reduces to 0.046 and 0.037 in x = 0.3 and 0.4, respectively. Under reduced J–T distortion, the energy gap between Mn(t2g − JT) and Mn(t2g + JT) reduces significantly. Considering this fact, the broad emission peak at ∼294 nm arises mainly from 4T1g → 4A2g of Mn4+ whereas other peaks at ∼332 and 355 nm remain same. In this context, in our previous work, we have also shown the disappearance of peak at ∼286 nm after doping Fe in GdMnO3 where J–T distortion has been reduced by one order magnitude.24 Moreira et al. have also mentioned the disappearance of PL emission peak in CaTiO3 due to undistorted or ordered TiO6 clusters.23 J–T distortion factor less by one order magnitude thus influences the PL spectra in Cr doped GdMnO3.Fig. 3(B) shows the emission spectra of GdMn1−xCrxO3 (x = 0–0.4) under an excitation wavelength of 460, 582 and 625 nm. After exciting at wavelength of 460 nm, the emission spectrum of GdMnO3 exhibits a broad peak ranging from 675–720 nm centered at ∼692 nm lying in red region. This emission peak is attributed to the spin-forbidden, 2Eg → 4A2g transition of Mn4+ ion. Since Mn4+ exhibits large effective positive charge, this transition is found to be dominated in the emission spectrum due to strong crystal field of the host.43 After incorporating Cr into GdMnO3, although the intensity of emission peak at ∼692 nm changes significantly, no change in peak position is observed. Exciting GdMnO3 with 582 nm, one broad emission having a maximum at 645 nm is observed indicating a blue-shift of ∼45 nm. Under an excitation wavelength of 625 nm, for GdMnO3, the broadband emission peak is found to be located at ∼690 nm. In case of x = 0–0.2, the intensity of peak is nearly same which diminishes for x = 0.3 and 0.4. The peak position of emission i.e. ∼692 nm of Mn4+ can vary significantly depending on the host material and excitation wavelength. For example, while this peak is observed at ∼617 nm in Na2SiF6, same peak is found to be red shifted by ∼100 nm showing prominent emission at 723 nm in SrTiO3.44
The excitation spectra have been taken by monitoring λem = 692 nm depicted in Fig. 3(C). In GdMnO3, the excitation spectrum is comprised of a strong peak at ∼460 nm along with a shoulder peak at ∼490 nm. This excitation peak is primarily attributed to 4A2g → 2T2g electronic transition of Mn4+ ion in the lattice. Two more sharp peaks are observed to be centered at ∼582 and ∼625 nm. The former one originates because of 4A2g → 4T2g transitions whereas the latter one is ascribed to the local vibration-activated 2Eg ↔ 4A2g transitions of Mn4+ ion.44 We do not observe any change in the intensity of peak at ∼460 nm with increasing Cr concentration. However, one can see an appreciable enhancement in the intensity of excitation peaks at ∼582 and 625 nm for x = 0.1 and 0.2 which reduces when x = 0.3 and 0.4. It is known that energy bands of Cr3+ are almost similar to Mn4+ which may result into overlapping of different energy bands. Therefore, we have proposed an energy band diagram to explain the luminescence behavior of GdMn1−xCrxO3 showing various energy levels such as O 2p, Mn(t2g − JT), Mn(t2g + JT), Mn(eg − JT), Mn(eg + JT) of Mn3+ under J–T effect, 2Eg, 4T2g, 2T2g, 4T1g, 4A2g associated to Mn4+ and Cr3+ ion, respectively. After exciting with 200 nm, the excited electrons do not reach to Mn(eg − JT) and Mn(eg + JT) of Mn3+ due to large energy gap. However, the energetic electrons are only transferred to Mn(t2g − JT) and Mn(t2g + JT) which relax to O 2p showing emissions at 286, 294/308, 332 and 355 nm. After exciting with 460 nm, the electrons are not excited to t2g of Mn3+ or 4T1g of Mn4+/Cr3+ due to significant energy gap. In pure GdMnO3, the excited electrons reach at 2T2g of Mn4+ which follow multistep relaxation via 4T2g to 2Eg and eventually come back to 4A2g inducing strong emission peak at ∼692 nm. In the presence of Cr3+ ion, the similar energy levels of Cr3+ and Mn4+ can influence the intensity of this emission peak by providing additional energetic electrons. Under excitation with higher wavelength of 582 nm, the excited electrons residing at 4T2g of Mn4+/Cr3+ de-excited to 2Eg and finally relax to 4A2g showing a similar emission band at ∼645 nm. However, at λex = 625 nm, this emission band arises due to absorption/emission process occurring between 4A2g and 2Eg energy levels. Thus, it is established that in Cr doped GdMnO3, the photoluminescence properties of Mn4+ can be modified by Cr3+ ion due to the presence of additional energetic electrons providing improved emissions in red region under different excitation wavelengths.
Magnetic properties
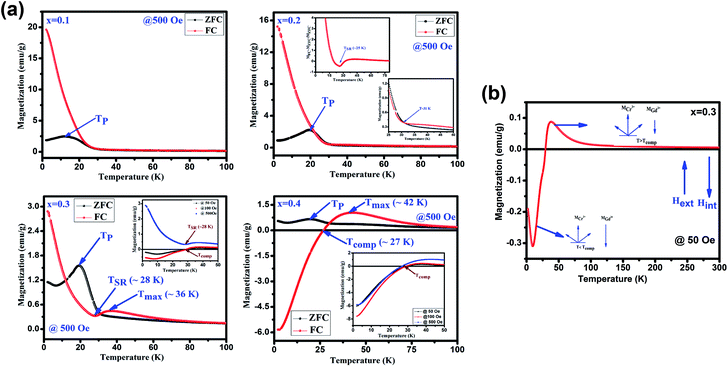
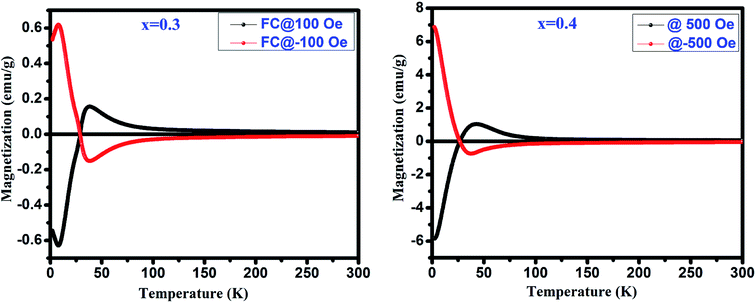
Fig. 4(a) depicts the temperature dependent magnetization (M vs. T) under the applied magnetic field of 500 Oe for GdMn1−xCrxO3 (x = 0.1–0.4). With decreasing temperature from 300 K, below TN, MZFC and MFC bifurcates at ∼31 K for x = 0.1. Further, decreasing temperature, while MZFC increases and attains the maximum magnetization at temperature TP, which is broad in nature, MFC increases continuously. In the case of x = 0.2, however, after bifurcation of MZFC and MFC at ∼63 K, MZFC crosses over the MFC at temperature ∼31 K, indicating a magnetic phase transition. Upon reducing temperature further, MZFC attains maxima (∼2.2 emu g−1) at TP ∼ 19 K, whereas MFC increases continuously. For x = 0.3, although bifurcation is observed at ∼95 K, TP remains same as in case of x = 0.2 except a decrease in Mmax to ∼1.56 emu g−1. On the other hand, MFC in the case of x = 0.3 shows a maximum of 0.45 emu g−1 at Tmax ∼36 K followed by decrease in magnetization attaining a minimum value of ∼0.32 emu g−1 at ∼28 K. The temperature at which minimum magnetization observed is known to be spin-reorientation temperature (TSR). Although TSR, is not detectable from ZFC and FC plot in x = 0.2, it is observed at ∼25 K by plotting (MZFC − MFC)/MZFC vs. T (shown in the inset Fig. 4(a)). In case of x = 0.4, after bifurcation of MZFC and MFC at ∼110 K, MZFC attains a maxima of 0.71 emu g−1 at ∼19 K same as the TP of x = 0.2. Besides, with decreasing temperature, MFC increases showing a Mmax ∼1 emu g−1 at ∼42 K and further decreasing temperature, MFC crosses the temperature axis (T = 0) at ∼27 K, known to be compensation temperature, Tcomp. Below Tcomp, the MFC becomes negative and attains a minimum magnetization, −5.83 emu g−1, at temperature ∼2 K. It is important to note that when x is 0.4, an interesting property of magnetization reversal is observed with applying magnetic field of 500 Oe. Further, decreasing the applied magnetic field to 50 and 100 Oe, we could observe the magnetization reversal in x = 0.3 as well which is absent under an applied field of 500 Oe. Moreover, except at x = 0.1, we show that with increase in Cr concentration upto 0.4, one can observe TSR and Tcomp with varying the applied field from 50 to 500 Oe. The mechanism of the magnetization reversal can be understood in terms of negative exchange interaction between two components such as Cr and Gd ions. The ferromagnetic order emerging due to canted AFM ordering of Cr3+ produces an internal field at paramagnetically ordered Gd3+ ions which are aligned to that of net Cr3+ moment. When external field is applied, the component of Cr3+ (MCr) is pointed along the external field direction while Gd3+ ion experiencing the internal field opposite to that of external field. Therefore, the net magnetization of the system, Ms = MCr − MGd varies with temperature and external field. In the region T > Tcomp, the MCr dominates over MGd resulting into a net positive magnetization in field direction giving a maxima in MFC (shown in Fig. 4(b)). At a critical temperature magnetization corresponding to MGd and MCr cancel out, resulting a zero magnetization known as Tcomp. Decreasing the temperature further the magnetization becomes negative as the moment of Gd3+ ion is increased while MCr3+ remains the same. As a consequence, MGd3+ dominates over the magnetization corresponding to MCr3+. A typical MFC magnetization vs. temperature plot of Cr3+ and Gd3+ under 50 Oe at T > Tcomp and T < Tcomp is shown in Fig. 4(b). While with applying low field, we could observe a magnetization maxima in FC curve and magnetization reversal followed by spin reorientation transition, with application of high field (500 Oe), the rotation of moment of MGd3+ ion takes place along the external field direction since the applied field is large enough to overcome the internal field generates by Cr3+ ions. Hence a positive magnetization is observed in whole temperature range. With varying Cr concentration, the applied field strength also changes which essentially evokes a positive magnetization in FC mode. For instance, in x = 0.1 and x = 0.2, the magnetization is always positive independent of applied field. However, in x = 0.3 while the FC magnetization is positive under 500 Oe, we do not observe positive magnetization upto 500 Oe for x = 0.4. Magnetization reversal has been reported in orthochromites, orthoferrites and orthovanadates.45–47 The TSR is also observed at ∼4.8 K from (MZFC − MFC)/MZFC plot as in case of x = 0.3. The presence of TSR could be ascribed to the interactions between different ion pairs such as Gd–Gd, Cr–Mn and Gd–Mn.The peak TP observed in M vs. T measurements is a possible fingerprint of the presence of spin-glass (SG) behavior. The presence of SG behavior has been validated after analyzing the time dependent remanant magnetization measurements for x = 0.1–0.4 shown in Fig. 5. This measurement is carried out by cooling sample from 300 to 15 K in under applied magnetic field of 100 Oe and then the field is removed. The magnetization is measured with varying time for 3 h. In general, the relaxation for SG behavior satisfies the power law, M (t) = M0t−b where M0 i.e. M at t = 0 known as initial magnetization and b is the decay parameter.22 It is clear from fitting of experimental data with above equation that the remanent magnetization satisfies the power law corroborating the SG like behavior in all samples.
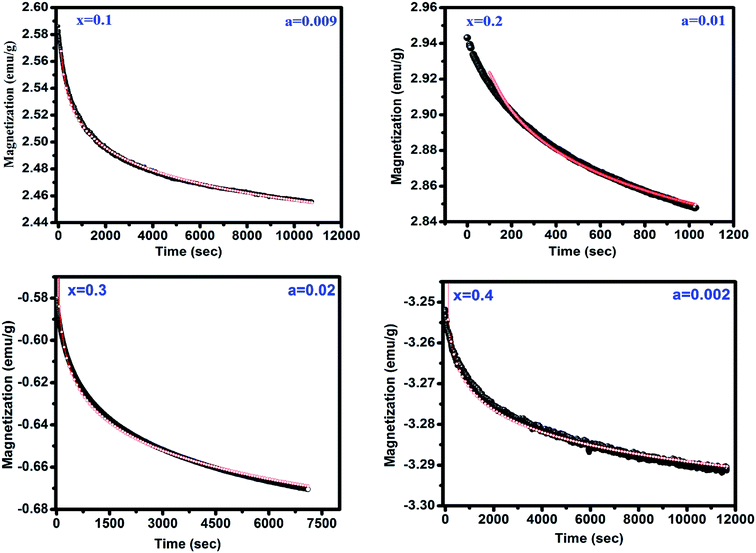 | ||
| Fig. 5 Magnetic relaxation after field cooling in 100 Oe. The red line shows the fitting to the power law function. | ||
To determine the magnetic transition temperature, 1/χ vs. temperature curves are plotted for GdMn1−xCrxO3 (x = 0.1–0.4) shown in Fig. 6. The antiferromagnetic Néel temperature (TN) is found to be increased from ∼49 and ∼130 K when x is varied from 0.1 to 0.4. The estimated values are much higher than that of GdMnO3 (i.e. TN ∼ 42 K).24 It is interesting that as we dope Cr3+ in Mn3+ site, the TN is increased. This may be understood in terms of dilution of the Mn–Mn interaction due to Cr–Mn and Cr–Cr exchange interactions. In addition, from 1/χ vs. temperature plots, the effective magnetic moment (μeff) is calculated after fitting the data in paramagnetic region using Curie–Weiss law i.e. 1/χ = (T − Θ)/C, where C is Curie constant and Θ is Curie–Weiss temperature (insets of Fig. 6). The negative value of Θ indicates the antiferromagnetic coupling between the atoms in all samples. The μeff is estimated theoretically using the formula, μeff = [(μGd)2 + (1 − x) (μMn)2 + x(μCr)2]1/2. The theoretical values of μeff are found to be 9.25, 9.20, 9.15 and 9.10 μB for x = 0.1, 0.2, 0.3 and 0.4, respectively, which clearly shows a decreasing trend with increasing Cr concentration.
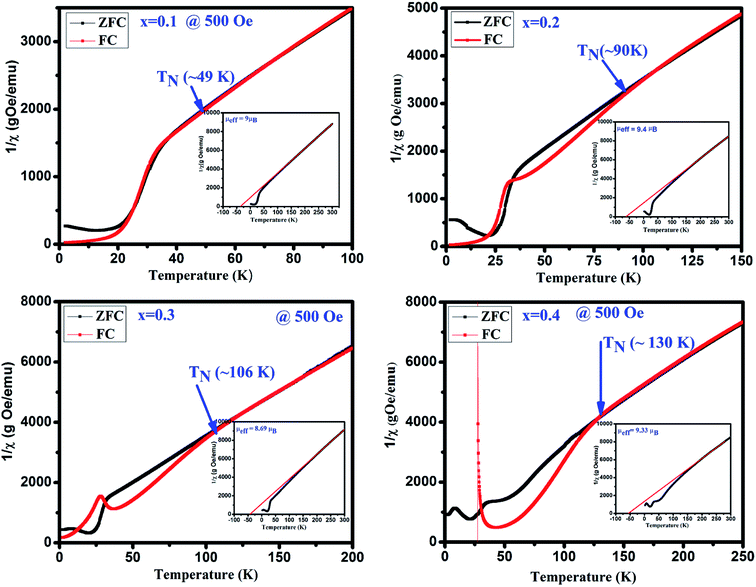 | ||
| Fig. 6 The inverse susceptibility 1/χ plots of ZFC and FC in the presence of 500 Oe and insects show Curie–Weiss law fitting of the GdMn1−xCrxO3 (x = 0.1, 0.2, 0.3 and 0.4). | ||
Further we have recorded the magnetization (M) as a function of the external field (H) below TN i.e. at 20 and 4 K for GdMn1−xCrxO3 (x = 0.1–0.4) in ZFC mode shown in Fig. 7. At 20 K, the magnetization with a slim loop increases linearly with increasing field which does not saturate upto 70 kOe (inset of Fig. 7). Further, with decreasing the temperature to 4 K, the area under the loop enhances and the loops are symmetrical along magnetic and magnetization axes, indicate the absence of exchange bias. After analyzing the hysteresis loops measured at 4 and 20 K, the calculated values of maximum magnetization (Mmax), coercivity (Hc) and remanence (Mr) are given in Table 3. One may note that Mmax increases with increase in Cr concentration except at x = 0.3 corroborates with μeff calculated from Curie–Weiss fitting and is in contrast with the theoretical value of μeff. The increase in Mmax thus supports the presence of Mn4+ and oxygen vacancies. It is presumed that as the concentration of Mn4+ decreases compared to Mn3+ with increase in Cr concentration, magnetization increases as observed in the present case. Generally, the magnetization hysteresis loop and its linear increasing nature at high field appear due to the weak ferromagnetic ordering which primarily induced by deviation of the collinearity of the moments in an antiferromagnet. Mao et al. discuss a similar behavior of magnetization as a function of external field in case of YFe0.5Cr0.5O3.48
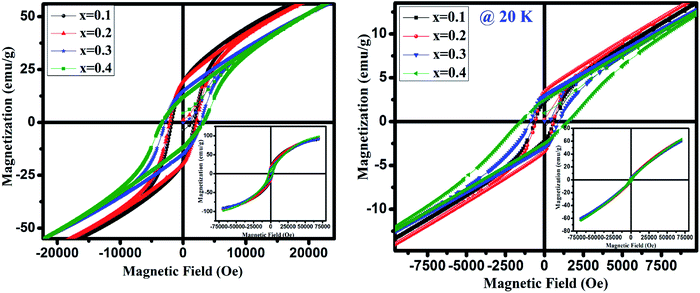 | ||
| Fig. 7 Magnetic field dependent magnetization at 4 K and 20 K of GdMn1−xCrxO3 (x = 0.1, 0.2, 0.3 and 0.4). | ||
| Composition | External field | MCr (emu g−1) | HI (Oe) | Θ |
|---|---|---|---|---|
| x = 0.3 | 50 Oe | 0.98 | −61.32 | −51.24 |
| 100 Oe | 1.88 | −121.50 | −50.89 | |
| x = 0.4 | 50 Oe | 7.56 | −188.42 | −28.73 |
| 100 Oe | 11.40 | −278.16 | −34.54 | |
| 500 Oe | 12.74 | −642.79 | −49.4 |
| Temperature | Mmax@7 kOe (emu g−1) | HC (Oe) | Mr (emu g−1) | |||||||||
|---|---|---|---|---|---|---|---|---|---|---|---|---|
| x = 0.1 | x = 0.2 | x = 0.3 | x = 0.4 | x = 0.1 | x = 0.2 | x = 0.3 | x = 0.4 | x = 0.1 | x = 0.2 | x = 0.3 | x = 0.4 | |
| 4 K | 90 | 95 | 92 | 98 | 1815 | 2158 | 2838 | 3232 | 19.3 | 19 | 14 | 12 |
| 20 K | 60 | 63 | 60 | 63 | 619 | 593 | 924 | 1556 | 2.2 | 3 | 3 | 2.3 |
The magnetization reversal has been further investigated by fitting the FC magnetization curves employing following equation:
 | (2) |
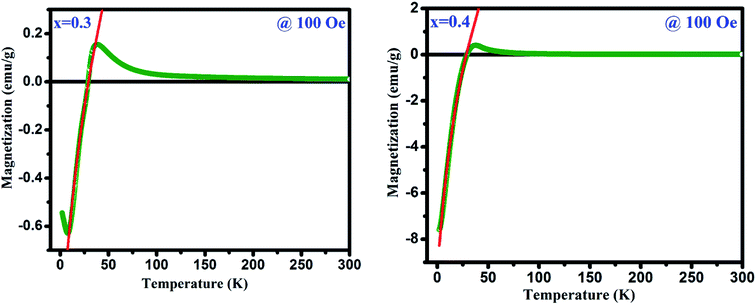 | ||
| Fig. 8 Magnetization curves at 100 Oe applied field in FC mode (the red line shows fitting with eqn (2)). | ||
Owing to the existence of characteristic features like magnetic reversal, Cr doped GdMnO3 (x = 0.3 and x = 0.4) has been explored for distinct magnetic switching effect. At 100 Oe, the sample is cooled down to 10 K in FC mode and magnetic switching measurements are recorded shown in Fig. 10. First, the magnetization is measured for 180 s at 10 K. Then, the magnetic field is quickly increased to 500 Oe and 1700 for x = 0.3 and 0.4, respectively followed by measuring the magnetization for constant time interval of 180 s. Apparently, these samples exhibit a promising magnetic switching effect. The measurement cycles are repeated for several times to examine the switching reproducibility which indicated reversible and continuous switching of the magnetization over cycles. The switching between the positive and negative magnetization states can be triggered through changing the magnitude of the field with fixed field direction. Moreover, this can be tuned in a predictable way. The magnetic switching effects driven by external magnetic field render promising application of these materials in magnetic data storage and magnetic switching based nonvolatile magnetic memory.
Conclusions
In summary, we systematically examined the structural evolution and rich sequence of magnetic transitions in Cr doped GdMnO3 synthesized using sol–gel method. As Cr concentration is increased from 0.1 to 0.4, we observed the structural transformation from O′ to O type orthorhombic one along with the reduction in lattice volume. The decrease in lattice volume was due to the smaller ionic radius of Cr3+ ion compared to Mn3+. The structural transformation was manifested by the reduction in J–T distortion factor estimated by the bond length obtained from Rietveld refinement. Raman spectra supported the observed reduction in J–T distortion factor as reflected showing decrease in the intensity of asymmetric stretching bonds at 487 and 610 cm−1. Further, the emission peak at ∼286 nm in PL spectra disappeared indicating decrease in J–T distortion factor. PL study demonstrated the emission spectra related to Mn4+ energy levels which improved after incorporating 10 at% of Cr3+. Magnetic measurements showed an increase in TN from ∼42 K for x = 0 to ∼130 K when x reached 0.4. Besides magnetization reversal with spin reorientation and magnetic switching effect are also observed as x reached 0.3. These materials can be used in magnetic switching, magneto caloric and spintronics devices.Conflicts of interest
There are no conflicts to declare.Acknowledgements
The authors are grateful to the Central Instrument Facility (CIF), IIT (BHU), Varanasi, for MPMS instrument for magnetic measurements. Authors acknowledge Dr Chandan Upadhyay, SMST, IIT (BHU) for PL measurements.References
- J. Magesh, P. Murugavel, R. V. K. Mangalam, K. Singh, Ch. Simon and W. Prellier, Appl. Phys. Lett., 2012, 101, 1–4 CrossRef.
- T. Goto, T. Kimura, G. Lawes, A. P. Ramirez and Y. Tokura, Phys. Rev. Lett., 2004, 92, 1–4 CrossRef PubMed.
- S. Ishiwata, Y. Kaneko, Y. Tokunaga, Y. Taguchi, T. Arima and Y. Tokura, Phys. Rev. B: Condens. Matter Mater. Phys., 2010, 81, 1–4 Search PubMed.
- T. Arima, T. Goto, Y. Yamasaki, S. Miyasaka, K. Ishii, M. Tsubota, T. Inami, Y. Murakami and Y. Tokura, Phys. Rev. B: Condens. Matter Mater. Phys., 2005, 72, 1–4 Search PubMed.
- W. S. Ferreira, J. A. Moreira, A. Almeida, M. R. Chaves, J. P. Araújo, J. B. Oliveira, J. M. Machado, D. Silva, M. A. Sá, T. M. Mendonça and P. S. Carvalho, Phys. Rev. B: Condens. Matter Mater. Phys., 2009, 79, 1–10 CrossRef.
- M. Kenzelmann, A. B. Harris, S. Jonas, C. Broholm, J. Schefer, S. B. Kim, C. L. Zhang, S. W. Cheong, O. P. Vajk and J. W. Lynn, Phys. Rev. Lett., 2005, 95, 1–4 CrossRef PubMed.
- T. Kimura, G. Lawes, T. Goto, Y. Tokura and A. P. Ramirez, Phys. Rev. B: Condens. Matter Mater. Phys., 2005, 71, 1–13 CrossRef.
- S. Harikrishnan, S. Robler, C. M. N. Kumar, H. L. Bhat, U. K. Robler, S. Wirth, F. Steglich and S. Elizabeth, J. Phys.: Condens. Matter, 2009, 21, 1–10 CrossRef PubMed.
- A. I. Milstein and O. P. Sushkov, Phys. Rev. B: Condens. Matter Mater. Phys., 2015, 91, 1–9 CrossRef.
- O. Pena, M. Bahout, K. Ghanimi, P. Duran, D. Gutierrez and C. Moure, J. Mater. Chem., 2002, 12, 2480–2485 RSC.
- O. Peña, D. Gutiérrez, P. Durán, K. Ghanimi and C. Moure, Bol. Soc. Esp. Ceram., 2004, 43, 706–709 CrossRef.
- T. Kimura, S. Ishihara, H. Shintani, K. T. Arima, K. Ishizaka and Y. Tokura, Phys. Rev. B: Condens. Matter Mater. Phys., 2003, 68, 1–4 CrossRef.
- P. K. Siwach, H. K. Singh and O. N. Srivastava, J. Phys.: Condens. Matter, 2008, 20, 1–43 CrossRef PubMed.
- A. Pal, W. Prellier and P. Murugavel, J. Phys.: Condens. Matter, 2018, 30, 1–7 CrossRef PubMed.
- Y. Tokura and Y. Tomioka, J. Magn. Magn. Mater., 1999, 200, 1–23 CrossRef CAS.
- C. N. R. Rao, A. Arulraj, A. K. Cheetha and B. Raveau, J. Phys.: Condens. Matter, 2000, 12, 83–106 CrossRef.
- C. N. R. Rao, A. Arulraj, P. N. Santosh and A. K. Cheetham, Chem. Mater., 1998, 10, 2714–2722 CrossRef CAS.
- R. M. Sarguna, V. Sridharan, S. S. Samatham, V. Ganesan, S. Bhardwaj, A. M. Awasthi, M. D. Mukadam, S. M. Yusuf, A. K. Sinha and N. Subramanian, J. Phys.: Condens. Matter, 2014, 26, 1–6 CrossRef PubMed.
- L. Li, L. Lin, Z. B. Yan, Q. Y. He and J. M. Liu, J. Appl. Phys., 2012, 112, 1–5 CrossRef PubMed.
- A. Modi and N. K. Gaur, J. Alloys Compd., 2015, 644, 575–581 CrossRef CAS.
- J. Li, C. H. A. Huan, Y. W. Du, D. Feng and Z. X. Shen, Phys. Rev. B: Condens. Matter Mater. Phys., 2000, 63, 1–5 CrossRef.
- V. M. Longo, L. S. Cavalcante, R. Erlo, V. R. Mastelaro, A. T. de Figueiredo, J. R. Sambrano, S. de Lazaro, A. Z. Freitas, L. Gomes, N. D. Vieira Jr, J. A. Varela and E. Longo, Acta Mater., 2008, 56, 2191–2202 CrossRef CAS.
- M. L. Moreira, E. C. Paris, G. S. d. Nascimento, V. M. Longo, J. R. Sambrano, V. R. Mastelaro, M. I. B. Bernardi, J. Andre, J. A. Varela and E. Longo, Acta Mater., 2009, 57, 5174–5185 CrossRef CAS.
- P. Tiwari, S. Kumar and C. Rath, J. Appl. Phys., 2019, 126, 1–12 CrossRef.
- A. Nandy, A. Roychowdhury, T. Kar, D. Das and S. K. Pradhan, RSC Adv., 2016, 6, 20609–20620 RSC.
- R. M. Sarguna, V. Sridharan, S. S. Samatham, V. Ganesan, S. Bhardwaj, A. M. Awasthi, M. D. Mukadam, S. M. Yusuf, A. K. Sinha and N. Subramanian, J. Phys.: Condens. Matter, 2014, 26, 1–6 CrossRef PubMed.
- A. Pal, C. D. Sekhar, A. Venimadhav and P. Murugavel, J. Phys.: Condens. Matter, 2017, 29, 1–7 CrossRef PubMed.
- S. Kumar, I. Coondoo, M. Vasundhara, A. K. Patra, A. L. Kholkin and N. Panwar, J. Appl. Phys., 2017, 121, 1–7 Search PubMed.
- P. Mandal, A. Sundaresan and C. N. R. Rao, Phys. Rev. B: Condens. Matter Mater. Phys., 2010, 82, 1–4 CrossRef.
- Y. M. Cao, S. X. Cao, W. Ren, Z. J. Feng, S. J. Yuan, B. J. Kang, B. Lu and J. C. Zhang, Appl. Phys. Lett., 2014, 104, 1–4 Search PubMed.
- S. M. Yusuf, A. Kumar and J. V. Yakhmi, Appl. Phys. Lett., 2009, 95, 1–3 CrossRef.
- Y. Ren, T. T. M. Palstra, D. I. Khomskii, E. Pellegrin, A. A. Nugroho, A. A. Menovsky and G. A. Sawatzky, Nature, 1998, 396, 441–444 CrossRef CAS.
- K. Yoshii, Mater. Res. Bull., 2012, 47, 3243–3248 CrossRef CAS.
- S. J. Yuan, W. Ren, F. Hong, Y. B. Wang, J. C. Zhang, L. Bellaiche, S. X. Cao and G. Cao, Phys. Rev. B: Condens. Matter Mater. Phys., 2013, 87, 1–6 Search PubMed.
- H. Shen, Z. Cheng, F. Hong, J. Xu, S. Yuan, S. Cao and X. Wang, Appl. Phys. Lett., 2013, 103, 1–5 Search PubMed.
- R. Huang, S. Cao, W. Ren, S. Zhan, B. Kang and J. Zhang, Appl. Phys. Lett., 2013, 103, 1–5 Search PubMed.
- Y. Ren, T. T. M. Palstra, D. I. Khomskii, E. Pellegrin, A. A. Nugroho, A. A. Menovsky and G. A. Sawatzky, Nature, 1998, 396, 441–444 CrossRef CAS.
- Z. Yingnan, L. Junjia, Z. Ziqing, L. Fuyang, Z. Xudong and L. Xiaoyang, Chemical Research in Chinese University, 2015, 31, 699–703 CrossRef.
- Y. Ma, Appl. Phys. Lett., 2005, 86, 1–5 Search PubMed.
- https://jp-minerals.org/vesta/en/6.
- S. Merten, V. B. Bamberg, B. Damaschke, K. Samwer and V. Moshnyaga, Phys. Rev. Mater., 2019, 3, 1–8 Search PubMed.
- A. Rusydi, R. Rauer, G. Neuber, M. Bastjan, I. Mahns, S. Müller, P. Saichu, B. Schulz, S. G. Singer, A. I. Lichtenstein, D. Qi, X. Gao, X. Yu, A. T. S. Wee, G. Stryganyuk, K. Dörr, G. A. Sawatzky, S. L. Cooper and M. Rubhausen, Phys. Rev. B: Condens. Matter Mater. Phys., 2008, 78, 1–5 CrossRef.
- T. Arai and S. Adachi, Jpn. J. Appl. Phys., 2011, 50, 1–5 Search PubMed.
- M. G. Brik and A. M. Srivastava, J. Lumin., 2013, 133, 69–72 CrossRef CAS.
- K. Vijayanandhini, C. Simon, V. Pralong, Y. Breard, V. Caignaert, B. Raveau, P. Mandal and A. Sundaresan, J. Phys.: Condens. Matter, 2009, 21, 1–8 CrossRef PubMed.
- N. Dasari, P. Mandal, A. Sundaresan and N. S. Vidhyadhiraja, Europhys. Lett., 2012, 99, 1–6 CrossRef.
- A. V. Mahajan, D. C. Johnston, D. R. Torgeson and F. Borsa, Phys. Rev. B: Condens. Matter Mater. Phys., 1992, 46, 10966–10972 CrossRef CAS PubMed.
- J. Mao, Y. Sui, X. Zhang, Y. Su, X. Wang, Z. Liu, Y. Wang, R. Zhu, Y. Wang, W. Liu and J. Tang, Appl. Phys. Lett., 2011, 98, 1–3 Search PubMed.
- S. Biswas, M. H. Khan, S. Pal and E. Bose, J. Magn. Magn. Mater., 2013, 328, 31–34 CrossRef CAS.
| This journal is © The Royal Society of Chemistry 2019 |

