 Open Access Article
Carbon quantum dots as a fluorophore for “inner filter effect” detection of metronidazole in pharmaceutical preparations
Jianghong Tang *,
Yaheng Zhang,
Yuhai Liu,
Dan Liu
 ,
Hengfei Qin
 and
Ning Lian
School of Chemistry and Environmental Engineering, Jiangsu University of Technology, Changzhou 213001, China. E-mail: tjh01@jsut.edu.cn
First published on 21st November 2019
Abstract
With houttuynia cordata as carbon source, photoluminescent carbon quantum dots (CDs) were obtained via a one-step hydrothermal procedure. The absorption band of metronidazole (MNZ, maximum absorption wavelength at 319 nm) can well overlap with the excitation bands of CDs (maximum excitation wavelength at 320 nm). A fluorescent approach has been developed for detection of MNZ based on the inner filter effect (IFE), in which as-prepared CDs act as an IFE fluorophore and the MNZ as an IFE absorber. We have investigated the mechanism of quenching the fluorescence of CDs and found that the IFE leads to an exponential decay in fluorescence intensity of CDs with increasing concentration of MNZ, but showed a good linear relationship (R2 = 0.9930) between ln(F0/F) with the concentration of MNZ in the range of 3.3 × 10⁻⁶ to 2.4 × 10⁻⁴ mol L−1. Due to the absence of surface modification of the CDs or establishing any covalent linking between the absorber (MNZ) and the fluorophore (CDs), the developed method is simple, rapid, low-cost and less time-consuming. Meanwhile, it possesses a higher sensitivity, wider linear range, and satisfactory selectivity and has potential application for detection of MNZ in pharmaceutical preparations.
1. Introduction
Metronidazole (MNZ), chemically 1-(2-hydroxyethyl)-2-methyl-5-nitroimidazole, is a synthetic nitroimidazole derivative with broad-spectrum anti-microbial properties.1 It has been widely used for antiprotozoal, antiamebic and antibacterial drugs, and is generally effective in the treatment of trichomoniasis, giardiasis, and amoebiasis diseases.2–4 It has also been added to fish and poultry feed to eliminate parasites5 or promote weight gain.6,7 Due to its low price and efficient treatment of bacterial infections, many commercial companies still illegally use MNZ as an additive in cosmetic materials.8 Long term use of MNZ drugs will lead to its accumulation in the human body, and some toxic reactions including seizures, peripheral neuropathy, and cerebellar ataxia, can occur which may pose health risks to humans.9 Although there is not enough evidence to confirm its carcinogenic effect on humans, many countries have banned MNZ use in the feed of animals.10 Thus, its determination can be of great importance.Several quantitative analytical methods have been reported to detect the concentration of MNZ in different matrices, such as ultraviolet spectrophotometry,11,12 fluorescence spectroscopy,13,14 gas chromatography,15 high-performance liquid chromatography,16 immunoassay,17 solid phase extraction,18 electrochemical sensor.19–21 However, spectrophotometric methods have some drawbacks such as requirement of long time heating, the use of nonaqueous systems, narrow range of determination, stability of the colored product formed, etc.11,20 HPLC method requires a long time involving gradient elution using expensive solvents.20 The nitro group in MNZ structure, as the active center for electrochemical sensing, has shown poor reproducibility and sensitivity at conventional electrodes.10 In general, modification of electrodes surfaces with suitable materials to improve the sensitivity and stability. Regarding some disadvantages of these reported methods, it is very significant to develop an alternative facile method with high selectivity and sensitivity for MNZ determination.
In recent years, fluorescent carbon dots (CDs) received great attention for their advantageous features, such as excellent aqueous dispersibility, special optical characteristics, low toxicity, good biocompatibility and good photostability.22,23 To date, CDs as a new type of emerging fluorescent nanomaterials, have been reported for their promising applications in metal cations and anions analysis,24,25 photocatalysis,26 biological imaging,27,28 biosensors,29–32 environmental analysis,33,34 small molecules detection.35–37 In view of carbon sources, the synthetic strategy are used to prepare carbon dots mainly refers to three kinds of classes, combustion/strong acid oxidizing raw carbon materials,26 hydrothermal process of biomass,38,39 carbonization of small molecule carbon precursors with different passivation reagents, achieving simultaneous fabrication and surface functionalization of CDs.24,40 It is worth note that hydrothermal process of biomass is a simple, cost-effective and environmentally friendly method, and the number of bioresources that can be used for the preparation of carbon dots is more than that of other two types of carbon materials.39
The inner filter effect (IFE), one of the non-irradiation energy conversions, is owing to the absorption of the excitation and/or emission radiation of fluorophores by absorbers in the detection system.41–43 Only the absorption spectra of the absorbers overlap with the excitation and/or emission bands of the fluorophore, the IFE would generate effectively. It is a useful strategy for conversion the analytical absorption signals into fluorescence signals. The absorption of the excitation of fluorophores by absorbers is called primary inner filter effect (pIFE), and secondary inner filter effect (sIFE) refers to the absorption of emission light.44 There is no chemical covalent interaction between the absorber and the fluorophore in the detection system. Therefore, implementing the IFE process is facile, simple and inexpensive.
Houttuynia cordata is a perennial plant belonging to the saururaceae family, which is a traditional medicinal plant in eastern Asia. It possesses very promising antiviral properties and is used as antipyretic, detoxicant, anti-ulcer remedy anti-inflammatory agent. It contains many chemical components consisting of C, H, O three kinds of elements, such as decanoy acetaldehyde (C12H22O2), lauraldehyde (C12H24O), a-pinene (C10H16), methyl nonyl ketone (C11H22O), β-sitosterol (C29H50O), camphene (C10H16), stearic acid (C18H36O2), chlorogenic acid (C16H18O9), quercetin (C15H10O7),45,46 and so on.
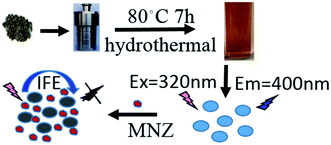
In the present work, eco-friendly CDs were prepared using houttuynia cordata as the carbon source through the hydrothermal process. Due to the absorption band of MNZ can well overlap with excitation light of the prepared CDs, a fluorescent assay has been developed for detecting of MNZ based on IFE (Fig. 1).41
2. Experiment section
2.1 Materials
Houttuynia cordata was purchased from Zhongcheng Pharmacy (Changzhou, China). MNZ (Sun Chemical Technology Shanghai Co., Ltd) was dissolved in water to prepare a 1.00 × 10⁻² mol L−1 stock solution. All chemicals were of analytic grade purity and used in this work without further purification. Ultrapure water prepared from a Milli-Q water purification system (Millipore, Billerica, MA, USA) were used throughout the experiment.2.2 Apparatus and methods
All fluorescence spectra and intensities were recorded on a Cary Eclipse fluorescence spectrometer (Varian, USA), excitation and emission bandwidths set on 5 and 10 nm, respectively. Fluorescence lifetime was measured with FluoroMax+ (America) instruments by using an excitation wavelength of 375 nm. X-ray photoelectron spectroscopy (XPS) measurements were carried out with ESCALAB 250Xi (America) X-ray photoelectron spectrometer. An electronic thermo regulating Water-bath (NTT-2100, EYELA, Japan) was used to control the temperature. A UV-1800PC Spectrophotometer (Shanghai, China) was used for acquiring the UV-vis absorption spectra in a given wavelength range. Fourier transform-infrared spectrometry (FTIR) was recorded at room temperature with a Nicolet IR200 Spectrometer (America) ranging from 650 to 4000 cm−1. The microstructures and size of CDs were acquired on transmission electron microscopy (JEM-2100, Japan) with a 200 kV accelerating voltage.2.3 Preparation of fluorescence CDs
CDs were prepared through a simple hydrothermal method with the houttuynia cordata as the carbon source. At first, 0.5 g of houttuynia cordata pieces was dispersed in 30 mL of ultrapure water with sonication for 10 minutes. Then, it was transferred into a 50 mL Teflon-equipped stainless steel autoclave, sealed, heated to 80 °C for 7 h in an air drying oven, and then cooled to room temperature naturally. To remove indispersible matters, the resultant brown yellow mixture was centrifuged at 15![[thin space (1/6-em)]](https://www.rsc.org/images/entities/char_2009.gif) 000 rpm for 20 min. The supernatant containing CDs was collected and filtered through a 0.22 μm filter membrane. The obtained suspension of carbon dots was stored at 4 °C for further characterization and applications.
000 rpm for 20 min. The supernatant containing CDs was collected and filtered through a 0.22 μm filter membrane. The obtained suspension of carbon dots was stored at 4 °C for further characterization and applications.
2.4 General procedure for fluorescence titration
2.5 mL CDs solution and 0.5 mL Tris buffer solution (pH = 8.0) was taken into 1.0 cm quartz cuvette. The mixture was titrated by successive additions of MNZ working solution (the final of MNZ concentrations range from 3.3 × 10⁻⁶ to 2.4 ×10⁻⁴ mol L−1). The drug was added from a concentrated stock solution so that volume increment was negligible. Titrations were done manually by using trace syringes, and the fluorescence signal was gained at excitation and emission wavelength of 320 and 440 nm. The experiments of the quenching mechanism were performed at three temperatures (298, 308, and 318 K). Fluorescence titration can be used for the detection of real sample.472.5 Real sample preparation
Take 10 tablets MNZ tables and grind fine, about 70 mg of the powder was dissolved in water and diluted to 100.0 mL. Filter them with dry filter paper and discard the initial portion, the filtrate was collected and used for analytical determinations.3. Results and discussion
3.1 Characterization of the CDs
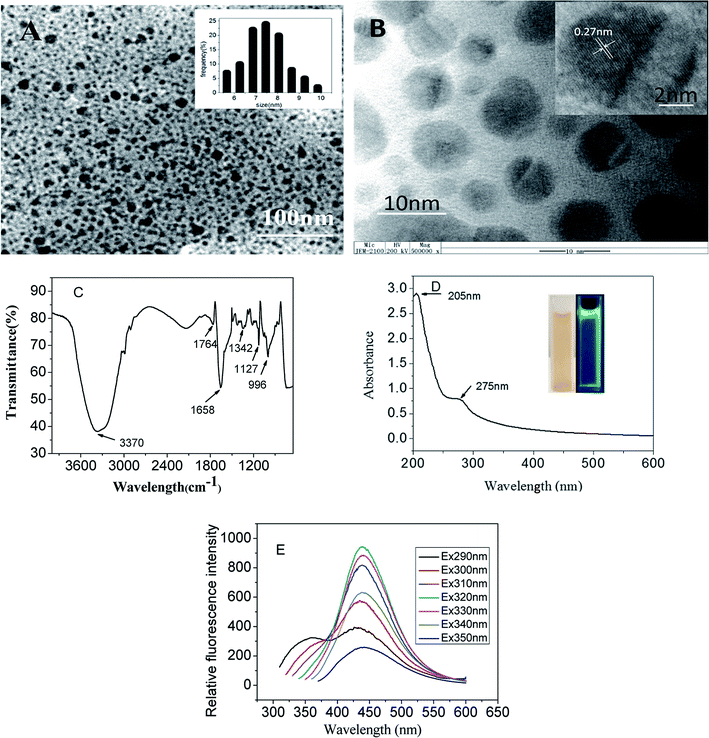
The size and morphology of the CDs were characterized by TEM. From the Fig. 2A and B, it can be observed that the CDs display excellent monodispersity in aqueous solution and a quasi-spherical irregular morphology. Their diameters are not of uniform size distributed in the range of 6–10 nm with an average diameter of 7.5 ± 2.6 nm (based on statistical analysis of 100 dots). The HRTEM image (inset of Fig. 2B) demonstrates clear lattice fringes with an interplanar spacing of 0.27 nm, which is similar to other previously reported CDs.24The FT-IR spectroscopy was employed to identify the surface functional groups of the synthesized CDs. As shown in Fig. 2C, the broad absorption band at 3370 cm−1 and peak at 1764 cm−1 were assigned to the stretching vibration of –OH and –COOH respectively. These indicated that there were many hydroxyl and carboxyl groups on CDs surface, which enabled the prepared CDs to exhibit excellent water solubility. The peaks at 1658 and 1342 cm−1 were attributed to the bending vibrations of C![[double bond, length as m-dash]](https://www.rsc.org/images/entities/char_e001.gif) C and C–O, the asymmetric and symmetric stretching vibrations of C–O–C appeared at 1127 and 996 cm−1. The FT-IR analysis indicated that CDs have been successfully synthesized through the hydrothermal process.
C and C–O, the asymmetric and symmetric stretching vibrations of C–O–C appeared at 1127 and 996 cm−1. The FT-IR analysis indicated that CDs have been successfully synthesized through the hydrothermal process.
The UV-visible absorption spectrum of CDs in aqueous solution was investigated. As shown in Fig. 2D, the prepared CDs depicted two absorption peaks at the wavelengths 205 and 275 nm. The absorption peak at 205 nm corresponded to the formation of carboxyl group chromophores, and peak at 275 nm ascribed to π–π* transition of C![[double bond, length as m-dash]](https://www.rsc.org/images/entities/char_e001.gif) C bond.24 Furthermore, the color of the CDs aqueous solution was pale yellow under ambient daylight but exhibited strong cyan emission under the 365 nm ultraviolet radiation (Fig. 2D, inset).
C bond.24 Furthermore, the color of the CDs aqueous solution was pale yellow under ambient daylight but exhibited strong cyan emission under the 365 nm ultraviolet radiation (Fig. 2D, inset).
The excitation dependent emission spectra of prepared CDs were obtained under the excitation wavelength from 290 to 350 nm (Fig. 2E). It was observed that with the excitation wavelength increased from 290 to 310 nm, the maximum emission peak position of CDs exhibited slightly red-shift. While the excitation wavelength was over 310 nm, the maximum emission wavelength remained constant, and the fluorescence intensity was firstly increased and subsequently decreased. The maximum fluorescence intensity at 440 nm corresponded to the excitation wavelength of 320 nm. Such excitation wavelength-dependent fluorescence behavior was ascribed to the existence of several surface state emissive trap as well as the different morphologies of CDs.24 The fluorescence quantum yield of prepared CDs was calculated to be 10.5% using quinine sulfate as the standard (54%).
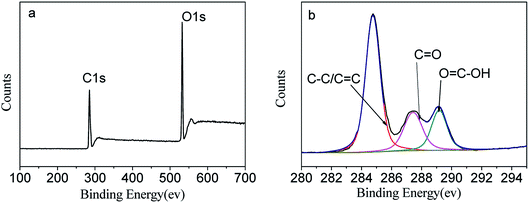
XPS was performed to explore the composition and the valent state of the prepared CDs. In the survey spectrum (Fig. 3a) there were two dominant peaks at 284.6 eV (C 1s), and 532.1 eV (O 1s) which can be attributed to C 1s, and O 1s. The high-resolution C 1s spectrum (Fig. 3b) exhibits three distinct carbon states of C![[double bond, length as m-dash]](https://www.rsc.org/images/entities/char_e001.gif) C/C–C with a binding energy at 284.7 eV, C
C/C–C with a binding energy at 284.7 eV, C![[double bond, length as m-dash]](https://www.rsc.org/images/entities/char_e001.gif) O at 287.5 eV and O
O at 287.5 eV and O![[double bond, length as m-dash]](https://www.rsc.org/images/entities/char_e001.gif) C–OH at 289.1 eV24,25 which in accord with the FT-IR analysis. These results suggested that there are apparent hydrophilic functional groups on the surface of the as-prepared CDs.
C–OH at 289.1 eV24,25 which in accord with the FT-IR analysis. These results suggested that there are apparent hydrophilic functional groups on the surface of the as-prepared CDs.
3.2 Analysis of quenching mechanism
The efficient IEF would occur when the absorption band of the absorber (quenchers) possesses a good spectral overlap with the excitation and/or emission bands of the fluorophore. As observed in Fig. 4, the maximum absorption wavelength of MNZ aqueous solution is 319 nm, and the prepared CDs has maximum excitation wavelength at 320 nm, showing absorption band of MNZ almost completely overlapping with the excitation bands of CDs. Owing to MNZ shield the excitation light for CDs, increasing the concentration of MNZ could be successfully converted to fluorescence quenching of CDs.42,48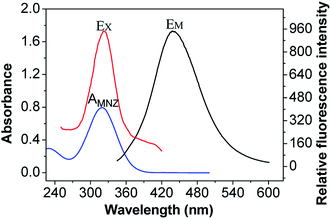 | ||
| Fig. 4 Fluorescence excitation (EX) and emission (EM) spectra of CDs and UV-vis absorption spectrum of MNZ (AMNZ). | ||
The efficiency of quenching of a fluorophore species by a quencher species could be described by the Stern–Volmer equation.
| F0/F = 1 + KQτ0[Q] = 1 + KSV[Q] | (1) |
Quenching can be induced by different mechanisms, such as dynamic quenching, static quenching, inner filter effect, and so on. Dynamic quenching process based on the excited-state fluorophore return to the ground state by the collision action with the quencher, static quenching arose from the formation of a nonfluorescent ground-state complex between fluorophore and quencher, IFE would generate when the quenchers absorb the excitation and/or emission of the fluorophore in the detection system. The quenching constant increased with increasing temperature for dynamic quenching while it decreased with increasing temperature for static quenching. The process of IFE does not belong to the static or dynamic quenching process,49 the quenching constant of IFE was no temperature-dependent.
In order to further clarify the fluorescence quenching mechanism, the interaction of MNZ with CDs was studied by fluorescence titration at three different temperatures. The quenching constant for the interaction of CDs and MNZ were listed in Table 1. As Table 1 showed, the quenching constant display a very small change. It can be seen in Fig. 5 that the Stern–Volmer plots were a linear relationship between F0/F and concentration of MNZ, but the slopes were not temperature-dependent, suggesting that the quenching mechanism neither dynamic nor static quenching, the possible quenching mechanism is IFE.
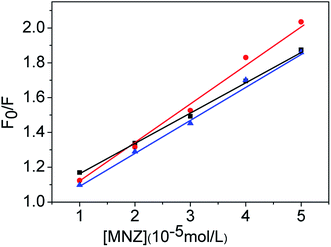 | ||
Fig. 5 Stern–Volmer plots for the MNZ quenching of CDs fluorescence at three different temperatures (■298 K,  308 K, 308 K,  318 K), pH = 8.0, λex = 320 nm, λem = 440 nm. 318 K), pH = 8.0, λex = 320 nm, λem = 440 nm. | ||
Moreover, the fluorescence decays were measured to clarify the quenching mechanism, because the fluorescence lifetime of fluorophore is almost constant in IFE quenching process. As shown in Fig. 6, the data were found to be fit well to a three-exponential function, and the average fluorescence lifetime of CDs and CDs–MNZ were 3.531 and 3.526 ns, respectively. The fact that there is no change in the fluorescence lifetime of CDs before and after MNZ is added suggests that the mechanism of the quenching process probably is IEF.
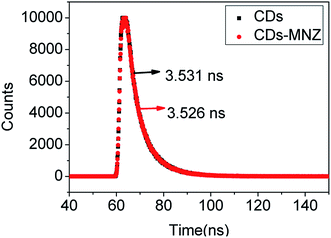 | ||
| Fig. 6 Fluorescence decay curves of CDs and CDs–MNZ with emission monitored at 440 nm and excitations at 375 nm. | ||
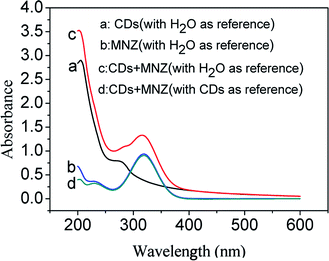
Practically, IFE is an attenuation of the excitation light or absorption of emission radiation by the quencher in solution. Because the IFE does not belong to the static or dynamic quenching. In this process, there is no new substance to form, the absorption peaks of the fluorophore or quencher would not change.44 Fig. 7 shows the UV absorption spectra of CDs, MNZ and the mixture solutions of CDs and MNZ. When using ultrapure water as reference solution, it can be seen that the absorption peaks of CDs, MNZ and the mixture of CDs and MNZ were different (Fig. 7a, b and c). However, with the same concentration CDs as reference solution, the absorption spectrum of the mixture containing CDs and MNZ (Fig. 7d) coincides with the spectrum of MNZ (Fig. 7b, with ultrapure water as reference) in the wavelength range of 240–600 nm. This case demonstrated that the absorption spectrum of the mixture is the sum of the absorbance of two component, CDs and MNZ. These evidences indicated there is no new substance to form between CDs and MNZ, and MNZ quenching CDs fluorescence is not static and dynamic, but IFE.
3.3 Effects of pH value
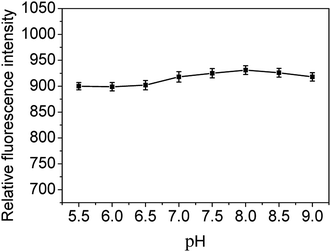
It is well known that both the size and surface states are crucial in the optical properties of CDs. Due to the protonation or deprotonation of the functional groups on the surface of CDs in acid and alkali solution, different pH values might affect the fluorescence intensity of CDs. In order to seek an optimal pH value for sensitive determination of MNZ, the effect of pH on the fluorescence intensity of the prepared CDs was investigated. The results (Fig. 8) showed that there is a slight variation of the fluorescence intensity of CDs in the pH from 5.5 to 9.0, and the fluorescence intensity reached its maximal value at pH 8.0. On the other hand, the nitrogen atoms on the imidazole ring of a MNZ molecule are easy to be protonated at low pH. With the decrease of pH, the maximum absorption wavelength of MNZ solution shifts towards the short wavelength,12,50 and this will weaken the absorption of MNZ on the excitation light of CDs, which also leads to the reduction of quenching efficiency. So the Tris–HCl buffer solution was chosen to keep pH the value of 8.0 in the present work.3.4 Quantitative determination of MNZ
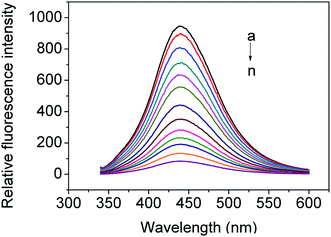
Fig. 9 shows the fluorescence emission spectra of as-prepared CDs solution in the absence and presence of MNZ (the final range of MNZ concentrations were from 3.3 × 10⁻⁶ to 2.4 × 10⁻⁴ mol L−1). It can be seen that CDs had a strong fluorescence emission band at 440 nm. The emission intensity of the CDs solution decreased gradually with the increase of concentration of MNZ step by step, implying that adding MNZ effectively quenched the fluorescence of the CDs. According to the experimental data, over 91% (suppressed efficiency E = 1 − F/F0) fluorescence intensity of CDs was quenched when the final concentration of MNZ increased to 2.4 × 10⁻⁴ mol L−1.According to the above experimental results, the plot of F0/F versus the concentration of MNZ displayed an exponential decay in the range of 3.3 × 10⁻⁶ to 2.4 × 10⁻⁴ mol L−1,51 but exhibited a linear relationship in the range of 3.3 × 10⁻⁶ to 5 × 10⁻⁵ mol L−1 with R2 = 0.9974, as shown Fig. 10A. The limit of detection (LOD) was calculated to be 1.2 × 10⁻⁷ mol L−1 using the equation LOD = 3σ/s, where σ is the standard deviation of the blank signals (n = 11), and s is the slope of the linear calibration curve. Meanwhile, the plot of exponential decay in Fig. 10A showed a good linear relationship (R2 = 0.9930) between ln(F0/F) and the concentration of MNZ in the range of 3.3 × 10⁻⁶ to 2.4 × 10⁻⁴ mol L−1 (Fig. 10B). The determination of MNZ in real samples can be calculated by the following linear equation:
| ln(F0/F) = 0.01016[MNZ] + 0.11998 | (2) |
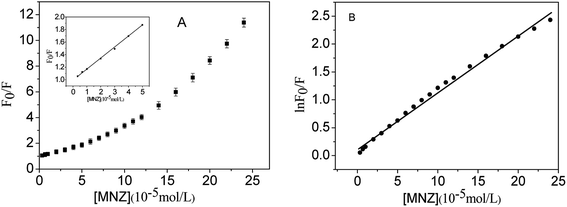 | ||
| Fig. 10 (A) The Stern–Volmer plot of CDs fluorescence quenched by MNZ. (B) Fitting curve of the plot in panel (A). λex = 320 nm, λem = 440 nm. pH = 8.0. | ||
| Method | Linear range (mol L−1) | LOD (mol L−1) | Ref. |
|---|---|---|---|
| Ultraviolet spectrophotometry | 5.8 × 10⁻⁶ to 1.9 × 10⁻⁴ | 1.7 × 10⁻⁶ | 11 |
| Covalent immobilization of indicator dye | 2.0 × 10⁻⁵ to 1.0 × 10⁻³ | 9.0 × 10⁻⁶ | 13 |
| GQDs-embedded SMIP | 2.010−7 to 1.5 × 10⁻⁵ | 1.5 × 10⁻⁷ | 14 |
| Gas chromatography | 5.8 × 10⁻⁶ to 1.2 × 10⁻³ | 5.8 × 10⁻⁷ | 15 |
| High performance liquid chromatography | 1.2 × 10⁻³ to 7.1 × 10⁻³ | — | 16 |
| Solid phase extraction | 2.0 × 10⁻⁷ to 1.0 × 10⁻⁴ | 5.0 × 10⁻⁸ | 18 |
| MIP-electrochemical sensor | 5.0 × 10⁻⁷ to 1.0 × 10⁻³ | 1.2 × 10⁻⁷ | 19 |
| Ion mobility spectrum-electrochemical sensor | 2.9 × 10⁻⁷ to 4.1 × 10⁻⁴ | 5.8 × 10⁻⁸ | 20 |
| 3D nanoporous-electrochemical sensor | 6 × 10⁻⁵ to 4 × 10⁻³ | 2 × 10⁻⁵ | 21 |
| CDs-dynamic quenching | 2.5 ×10⁻⁶–2.25 ×10⁻⁴ | 2.79 × 10⁻⁷ | 52 |
| CDs-IEF quenching | 0 to 5.8 × 10⁻⁵ | 1.50 × 10⁻⁶ | 53 |
| CdS quantum dots | 5.8 × 10⁻⁵ to 3.5 × 10⁻⁴ | 1.3 × 10⁻⁵ | 54 |
| CDs-IEF quenching | 3.3 × 10⁻⁶ to 2.4 × 10⁻⁴ | 1.2 × 10⁻⁷ | This method |
3.5 Effects of coexisting substances
To evaluate the selectivity of the proposed MNZ detection method, the effect of some potential interferents was investigated. We tested the responses of the CDs solution (pH 8.0) containing 1.0 ×10⁻⁴ mol L−1 MNZ without and with an interfering material, respectively. The results suggested that relative fluorescence intensity change caused by common ions except Fe3+ and some pharmaceutical species were less than 5.0% (Table 3). Therefore, this method has a sufficient selectivity for MNZ, making it practicable for practical applications in analyzing pharmaceutical preparations.| Materials | Concentration (mol L−1) | Relative fluorescence intensity change (F2 − F1/F1) (%) |
|---|---|---|
| a F1 and F2 are fluorescence intensities CDs detection solution (pH 8.0) exposed to 1.0 × 10⁻⁴ mol L−1 MNZ, without and with coexisting substance, respectively. | ||
| KCl | 1.0 × 10⁻³ | 0.52 |
| NaCl | 1.0 × 10⁻³ | 1.12 |
| NH4Cl | 1.0 × 10⁻³ | 3.81 |
| NaNO3 | 1.0 × 10⁻³ | 2.10 |
| Na2CO3 | 1.0 × 10⁻³ | 2.89 |
| CaCl2 | 1.0 × 10⁻³ | 4.45 |
| MgSO4 | 1.0 × 10⁻³ | 3.47 |
| AlCl3 | 1.0 × 10⁻³ | 2.10 |
| Fe(NO3)3 | 1.0 × 10⁻³ | 13.32 |
| ZnCl2 | 1.0 × 10⁻³ | 1.44 |
| Glucose | 1.0 × 10⁻³ | 4.52 |
| 5-Hydroxymethylfurfual | 1.0 × 10⁻³ | 1.83 |
| Tryptophan | 1.0 × 10⁻³ | 2.16 |
| Urea | 1.0 × 10⁻³ | 3.20 |
| Lidocaine | 1.0 × 10⁻³ | 2.61 |
| Erythromycin | 1.0 × 10⁻³ | 3.21 |
| Diphenhydramine | 1.0 × 10⁻³ | 4.01 |
| Chlorphenirammum | 1.0 × 10⁻³ | 3.20 |
| Sulfaguanidine | 1.0 × 10⁻³ | 2.98 |
3.6 Analytical applications
The proposed method was used for determinations of MNZ content in commercial MNZ tablets and to test the recovery from the spiked tablets. The preparation of sample solutions, as discussed in the experimental section, analyzed using fluorescence titration by linear eqn (2). The content of MNZ in the tablets (labelled value 0.250 g per tablet) determined by the present method was compared with those assayed by UV-vis method,12 which suggests that there is a good agreement between the quantitative data from the two methods. The intra- and inter-day results obtained are listed in Table 4. The recoveries of for the detection of spiked MNZ in pharmaceutical tablets in intra- and inter-day were 101.5–104.9% and 101.1–103.4%. Therefore, these results revealed that this method showed good precision and accuracy and has potential application for the detecting of MNZ in pharmaceutical preparations.| Detected (μM) | Spiked (μM) | Intra-day results | Inter-day results | Present method (g per tablet) | UV-vis method (g per tablet) | ||||
|---|---|---|---|---|---|---|---|---|---|
| Total found (μM) | Recovery (%) | RSD (%) n = 5 | Total found (μM) | Recovery (%) | RSD (%) n = 5 | ||||
| 30.36 ± 0.31 | 30.00 | 61.82 ± 0.45 | 104.9 | 3.6 | 61.38 ± 0.29 | 103.4 | 4.2 | 0.252 ± 0.032 | 0.255 ± 0.021 |
| 60.00 | 91.23 ± 0.28 | 101.5 | 2.3 | 91.01 ± 0.33 | 101.1 | 3.8 | |||
| 90.00 | 122.55 ± 0.51 | 102.4 | 2.1 | 121.88 ± 0.61 | 101.7 | 5.2 | |||
4. Conclusion
Using houttuynia cordata as a carbon source, new CDs were successfully prepared through a one-step hydrothermal method. We have demonstrated a fluorescent approach for detection of MNZ based on IFE, in which as-prepared CDs act as an IFE fluorophore and the MNZ as an IFE absorber. Due to no surface modification of fluorophore (CDs) and covalent bond coupling between absorber (MNZ) and fluorophore, the developed method is facile, rapid, low cost and less time-consuming. The results revealed that this method showed satisfactory selectivity and has potential application for the detecting of MNZ in pharmaceutical preparations.Conflicts of interest
The authors declared that they have no conflict of interest.Acknowledgements
The authors acknowledge the funding support from National Natural Science Foundation of China (31800495) and Natural Science Foundation of Jiangsu Province (BK20181040).References
- A. M. Jarrad, T. Karoli, A. Debnath, C. Y. Tay, J. X. Huang, G. Kaeslin, A. G. Elliott, Y. Miyamoto, S. Ramu and A. M. Kavanagh, Eur. J. Med. Chem., 2015, 101, 96–102 CrossRef CAS PubMed.
- L. A. Dunn, K. T. Andrews, J. S. Mccarthy, J. M. Wright, T. S. Skinner-Adams, P. Upcroft and J. A. Upcroft, Int. J. Antimicrob. Agents, 2007, 29, 98–102 CrossRef CAS PubMed.
- J. Z. Huang, X. L. Shen, R. L. Wang, Q. Zeng and L. S. Wang, RSC Adv., 2017, 7, 535–542 RSC.
- H. Qureshi, A. Ali, R. Baqai and W. Ahmed, J. Int. Med. Res., 1997, 25, 167–170 CrossRef CAS PubMed.
- H. B. Ammar, M. Brahim, R. Abdelhedi and Y. Samet, Sep. Purif. Technol., 2016, 157, 9–16 CrossRef CAS.
- Z. Fang, X. Qiu, J. Chen and X. Qiu, Appl. Catal., B, 2010, 100, 221–228 CrossRef CAS.
- W. Cheng, M. Yang and Y. Y. Xie, Environ. Technol., 2013, 34, 2977–2987 CrossRef CAS PubMed.
- M. Liu, X. Y. Li, J. J. Li, X. M. Su, Z. Y. Wu, P. F. Li, F. H. Lei, X. C. Tan and Z. W. Shi, Anal. Bioanal. Chem., 2015, 407, 3875–3880 CrossRef CAS PubMed.
- N. Xiao, J. Deng, J. L. Cheng, S. Q. Ju, H. Q. Zhao, J. Xie, D. Qian and J. He, Biosens. Bioelectron., 2016, 81, 54–60 CrossRef CAS PubMed.
- E. Shahnazari-Shahrezaie and A. Nezamzadeh-Ejhieh, RSC Adv., 2017, 7, 14247–14253 RSC.
- P. Nagaraja, K. R. Sunitha, R. A. Vasantha and H. S. Yathirajan, J. Pharm. Biomed. Anal., 2002, 28, 527–535 CrossRef CAS PubMed.
- X. Zhang, L. Q. Tong and L. Y. Zhang, Jiangsu Pharmaceutical and Clinical Research, 2004, 4, 14–15 Search PubMed.
- S. H. Tan, J. H. Jiang, B. N. Yan, G. L. Shen and R. Q. Yu, Anal. Chim. Acta, 2006, 560, 191–196 CrossRef CAS.
- M. Mehrzad-Samarin, F. Faridbod, A. S. Dezfuli and M. R. Ganjali, Biosens. Bioelectron., 2017, 92, 618–623 CrossRef CAS PubMed.
- J. H. Wang, J. Chromatogr. A, 2001, 918, 435–438 CrossRef CAS PubMed.
- A. Mishal and D. Sober, J. Pharm. Biomed. Anal., 2005, 39, 819–823 CrossRef CAS PubMed.
- C. S. Thompson, I. M. Traynor, T. L. Fodey and S. R. H. Crooks, Anal. Chim. Acta, 2009, 637, 259–264 CrossRef CAS PubMed.
- D. Chen, J. Deng, J. Liang, J. Xie, K. H. Huang and C. H. Hu, Anal. Methods, 2013, 5, 722–728 RSC.
- Y. Gu, X. Y. Yan, C. Li, B. Zheng, Y. R. Li, W. L. Liu, Z. Q. Zhang and M. Yang, Biosens. Bioelectron., 2016, 77, 393–399 CrossRef CAS PubMed.
- M. T. Jafari, B. Rezaei and B. Zaker, Anal. Chem., 2009, 81, 3585–3591 CrossRef CAS PubMed.
- Y. C. Li, Y. Liu, Y. Yang, F. Yu, J. Liu, H. Song, J. Liu, H. Tang, B. C. Ye and Z. P. Sun, ACS Appl. Mater. Interfaces, 2015, 7, 15474–15480 CrossRef CAS PubMed.
- S. L. Hu, Chem. Rec., 2016, 16, 219–230 CrossRef CAS PubMed.
- H. Hamishehkar, B. Ghasemzadeh, A. Naseri, R. Salehi and F. Rasoulzadeh, Spectrochim. Acta, Part A, 2015, 150, 934–939 CrossRef CAS PubMed.
- Z. Fu, M. H. Yao, X. Q. Niu and F. L. Cui, Sens. Actuators, B, 2016, 226, 486–494 CrossRef CAS.
- X. T. Cao, J. Ma, Y. P. Lin, B. X. Yao, F. M. Li, W. Weng and X. C Lin, Spectrochim. Acta, Part A, 2015, 151, 875–880 CrossRef CAS PubMed.
- S. L. Hu, R. X. Tian, L. L. Wu, Q. Zhao, J. L. Yang, J. Liu and S. R. Cao, Chem.–Asian J., 2013, 8, 1035–1041 CrossRef CAS PubMed.
- W. Zhang, R. X. Wang, W. Liu, X. Wang, P. Li, W. Zhang, H. Wang and B. Tang, Chem. Sci., 2018, 9, 721–727 RSC.
- V. Sharma, N. Kaur, P. Tiwari and S. M. Mobin, J. Photochem. Photobiol., B, 2018, 182, 137–145 CrossRef CAS PubMed.
- S. Huang, L. M. Wang, C. S. Huang, J. N. Xie, W. Su, J. R. Sheng and Q. Xiao, Sens. Actuators, B, 2015, 221, 1215–1222 CrossRef CAS.
- X. M. Xu, Y. Cen, G. H. Xu, F. D. Wei, M. L. Shi and Q. Hu, Biosens. Bioelectron., 2019, 131, 232–236 CrossRef CAS PubMed.
- S. M. Ardekani, A. Dehghani, P. Ye, K. A. Nguyen and V. G. Gomes, J. Colloid Interface Sci., 2019, 552, 378–387 CrossRef CAS PubMed.
- Q. Yang, J. H. Li, X. Y. Wang, H. Xiong and L. X. Chen, Anal. Chem., 2019, 91, 6561–6568 CAS.
- J. L. Yu, X. Y. Wang, Q. Kang, J. H. Li, D. Z. Shen and L. X. Chen, Environ. Sci.: Nano, 2017, 4, 493–502 RSC.
- X. Y. Wang, J. L. Yu, X. Q. Wu, J. Q. Fu, Q. Kang, D. Z. Shen, J. H. Li and L. X. Chen, Biosens. Bioelectron., 2016, 81, 438–444 CrossRef CAS PubMed.
- M. Jahanbakhshi and B. Habibi, Biosens. Bioelectron., 2016, 81, 143–150 CrossRef CAS PubMed.
- H. L. Tao, X. F. Liao, Q. Y. Wu, X. L. Xie, F. X. Zhong, Z. S. Yi, M. Qin and Z. L. Wu, Spectrochim. Acta, Part A, 2016, 153, 268–272 CrossRef CAS PubMed.
- S. L. Yang, L. Wang, L. Zuo, C. Zhao, H. Y. Li and L. Ding, Microchim. Acta, 2019, 186, 652–660 CrossRef PubMed.
- Z. Y. Yan, Z. W. Zhang and J. Q. Chen, Sens. Actuators, B, 2016, 225, 469–473 CrossRef CAS.
- J. Zhang, L. Dong and S. H. Yu, Sci. Bull., 2015, 60, 785–791 CrossRef CAS.
- B. B. Campos, M. M. Oliva, R. Contreras-Cáceres, E. Rodriguez-Castellón, J. Jiménez-Jiménez, J. C. G. Esteves da Silva and M. Algarra, J. Colloid Interface Sci., 2016, 465, 165–173 CrossRef CAS PubMed.
- G. L. Li, H. L. Fu, X. J. Chen, P. W. Gong, G. Chen, L. Xia, H. Wang, J. M. You and Y. N. Wu, Anal. Chem., 2016, 88, 2720–2726 CrossRef CAS PubMed.
- S. Khezri, M. Bahram and N. Samadi, Anal. Methods, 2017, 9, 6513–6524 RSC.
- H. Kim, B. I. Lee and S. H. Byeon, Chem. Commun., 2015, 51, 725–728 RSC.
- Q. Gu and J. E. Kenny, Anal. Chem., 2009, 81, 420–426 CrossRef CAS PubMed.
- K. H. Chiow, M. C. Phoon, T. Putti, B. K. H. Tan and V. T. Chow, Asian Pac. J. Trop. Med., 2016, 9, 1–7 CrossRef CAS PubMed.
- Q. G. Ma, R. R. Wei, Z. Q. Wang, W. M. Liu, Z. P. Sang, Y. P. Li and H. C. Huang, J. Ethnopharmacol., 2017, 195, 166–172 CrossRef CAS PubMed.
- J. H. Tang, S. D. Qi and X. G. Chen, J. Mol. Struct., 2005, 779, 87–95 CrossRef CAS.
- M. Zheng, Z. G. Xie, D. Qu, D. Li, P. Du, X. B. Jing and Z. C. Sun, ACS Appl. Mater. Interfaces, 2013, 5, 13242–13247 CrossRef CAS PubMed.
- F. L. Zu, F. Y. Yan, Z. J. Bai, J. X. Xu, Y. Y. Wang, Y. C. Huang and X. G. Zhou, Microchim. Acta, 2017, 184, 1899–1914 CrossRef CAS.
- W. H. Liu, Y. Wang, J. H. Tang, G. L. Shen and R. Q. Yu, Anal. Sci., 1998, 14, 547–551 CrossRef CAS.
- W. Y. Zhai, C. X. Wang, P. Yu, Y. X. Wang and L. Q. Mao, Anal. Chem., 2014, 86, 12206–12213 CrossRef CAS PubMed.
- X. P. Yang, M. X. Liu, Y. R. Yin, F. L. Tang, H. Xu and X. J. Liao, Sensors, 2018, 18, 964–978 CrossRef PubMed.
- J. R. Zhao, X. H. Pan, X. B. Sun, W. Pan, G. F. Yu and J. P. Wang, Luminescence, 2018, 33, 704–712 CrossRef CAS PubMed.
- R. I. El-Bagary, A. A. El-Zaher, E. F. Elkady and A. A. Mandour, Future J. Pharm. Sci., 2018, 4, 185–190 CrossRef.
| This journal is © The Royal Society of Chemistry 2019 |

